Races in Shelbyville, Indiana (IN) Detailed Stats
Data:
Races - White alone (%)
Races - White alone (% change since 2000)
Races - Black alone (%)
Races - Black alone (% change since 2000)
Races - American Indian alone (%)
Races - American Indian alone (% change since 2000)
Races - Asian alone (%)
Races - Asian alone (% change since 2000)
Races - Hispanic (%)
Races - Hispanic (% change since 2000)
Races - Native Hawaiian and Other Pacific Islander alone (%)
Races - Native Hawaiian and Other Pacific Islander alone (% change since 2000)
Races - Two or more races(%)
Races - Two or more races(% change since 2000)
Races - Other race alone (%)
Races - Other race alone (% change since 2000)
Racial diversity
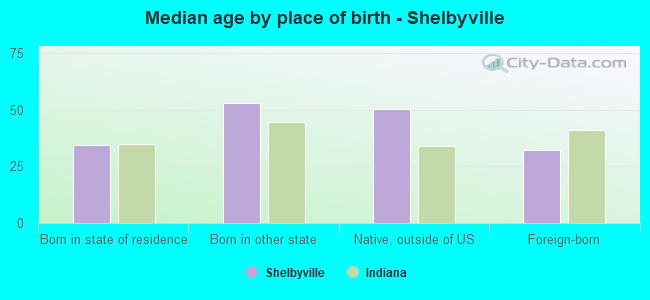
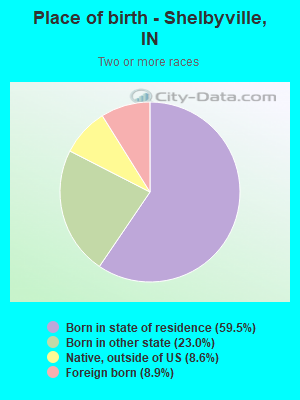
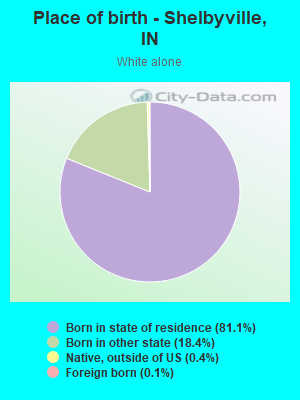
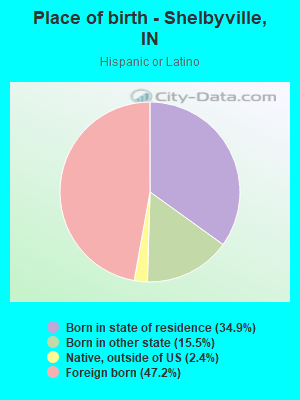
Place of birth - Born in state of residence (%)
Place of birth - Born in state of residence (%) - White
Place of birth - Born in state of residence (%) - Black or African American
Place of birth - Born in state of residence (%) - Asian
Place of birth - Born in state of residence (%) - Hispanic or Latino
Place of birth - Born in state of residence (%) - American Indian and Alaska Native
Place of birth - Born in state of residence (%) - Multirace
Place of birth - Born in state of residence (%) - Other Race
Place of birth - Born in other state (%)
Place of birth - Born in other state (%) - White
Place of birth - Born in other state (%) - Black or African American
Place of birth - Born in other state (%) - Asian
Place of birth - Born in other state (%) - Hispanic or Latino
Place of birth - Born in other state (%) - American Indian and Alaska Native
Place of birth - Born in other state (%) - Multirace
Place of birth - Born in other state (%) - Other Race
Place of birth - Native, outside of US (%)
Place of birth - Native, outside of US (%) - White
Place of birth - Native, outside of US (%) - Black or African American
Place of birth - Native, outside of US (%) - Asian
Place of birth - Native, outside of US (%) - Hispanic or Latino
Place of birth - Native, outside of US (%) - American Indian and Alaska Native
Place of birth - Native, outside of US (%) - Multirace
Place of birth - Native, outside of US (%) - Other Race
Place of birth - Foreign born (%)
Place of birth - Foreign born (%) - White
Place of birth - Foreign born (%) - Black or African American
Place of birth - Foreign born (%) - Asian
Place of birth - Foreign born (%) - Hispanic or Latino
Place of birth - Foreign born (%) - American Indian and Alaska Native
Place of birth - Foreign born (%) - Multirace
Place of birth - Foreign born (%) - Other Race
Residents speaking English at home (%)
Residents speaking English at home - Born in the United States (%)
Residents speaking English at home - Native, born elsewhere (%)
Residents speaking English at home - Foreign born (%)
Residents speaking Spanish at home (%)
Residents speaking Spanish at home - Born in the United States (%)
Residents speaking Spanish at home - Native, born elsewhere (%)
Residents speaking Spanish at home - Foreign born (%)
Residents speaking other language at home (%)
Residents speaking other language at home - Born in the United States (%)
Residents speaking other language at home - Native, born elsewhere (%)
Residents speaking other language at home - Foreign born (%)
Marital status - Never married (%)
Marital status - Now married (%)
Marital status - Separated (%)
Marital status - Widowed (%)
Marital status - Divorced (%)
Ancestries Reported - Arab (%)
Ancestries Reported - Czech (%)
Ancestries Reported - Danish (%)
Ancestries Reported - Dutch (%)
Ancestries Reported - English (%)
Ancestries Reported - French (%)
Ancestries Reported - French Canadian (%)
Ancestries Reported - German (%)
Ancestries Reported - Greek (%)
Ancestries Reported - Hungarian (%)
Ancestries Reported - Irish (%)
Ancestries Reported - Italian (%)
Ancestries Reported - Lithuanian (%)
Ancestries Reported - Norwegian (%)
Ancestries Reported - Polish (%)
Ancestries Reported - Portuguese (%)
Ancestries Reported - Russian (%)
Ancestries Reported - Scotch-Irish (%)
Ancestries Reported - Scottish (%)
Ancestries Reported - Slovak (%)
Ancestries Reported - Subsaharan African (%)
Ancestries Reported - Swedish (%)
Ancestries Reported - Swiss (%)
Ancestries Reported - Ukrainian (%)
Ancestries Reported - United States (%)
Ancestries Reported - Welsh (%)
Ancestries Reported - West Indian (%)
Ancestries Reported - Other (%)
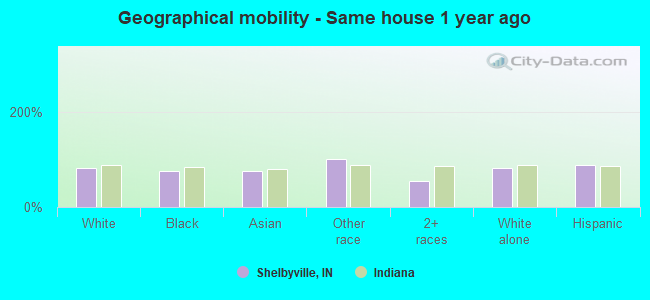
Geographical mobility - Same house 1 year ago (%)
Geographical mobility - Same house 1 year ago (%) - White
Geographical mobility - Same house 1 year ago (%) - Black or African American
Geographical mobility - Same house 1 year ago (%) - Asian
Geographical mobility - Same house 1 year ago (%) - Hispanic or Latino
Geographical mobility - Same house 1 year ago (%) - American Indian and Alaska Native
Geographical mobility - Same house 1 year ago (%) - Multirace
Geographical mobility - Same house 1 year ago (%) - Other Race
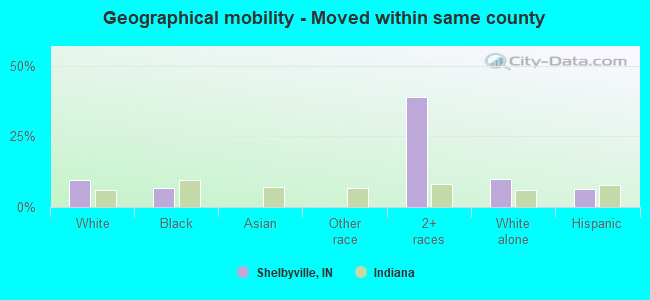
Geographical mobility - Moved within same county (%)
Geographical mobility - Moved within same county (%) - White
Geographical mobility - Moved within same county (%) - Black or African American
Geographical mobility - Moved within same county (%) - Asian
Geographical mobility - Moved within same county (%) - Hispanic or Latino
Geographical mobility - Moved within same county (%) - American Indian and Alaska Native
Geographical mobility - Moved within same county (%) - Multirace
Geographical mobility - Moved within same county (%) - Other Race
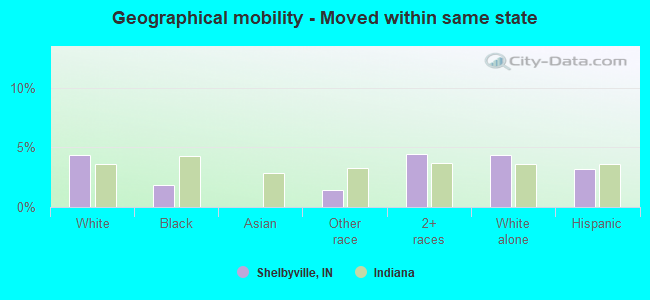
Geographical mobility - Moved from different county within same state (%)
Geographical mobility - Moved from different county within same state (%) - White
Geographical mobility - Moved from different county within same state (%) - Black or African American
Geographical mobility - Moved from different county within same state (%) - Asian
Geographical mobility - Moved from different county within same state (%) - Hispanic or Latino
Geographical mobility - Moved from different county within same state (%) - American Indian and Alaska Native
Geographical mobility - Moved from different county within same state (%) - Multirace
Geographical mobility - Moved from different county within same state (%) - Other Race
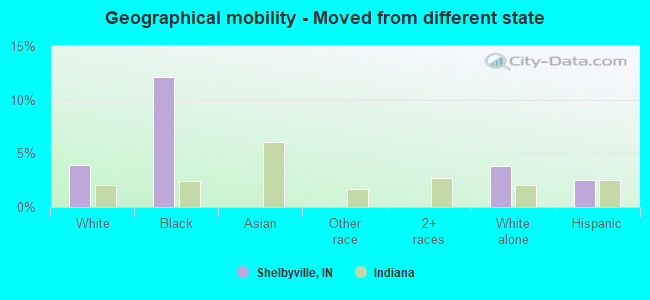
Geographical mobility - Moved from different state (%)
Geographical mobility - Moved from different state (%) - White
Geographical mobility - Moved from different state (%) - Black or African American
Geographical mobility - Moved from different state (%) - Asian
Geographical mobility - Moved from different state (%) - Hispanic or Latino
Geographical mobility - Moved from different state (%) - American Indian and Alaska Native
Geographical mobility - Moved from different state (%) - Multirace
Geographical mobility - Moved from different state (%) - Other Race
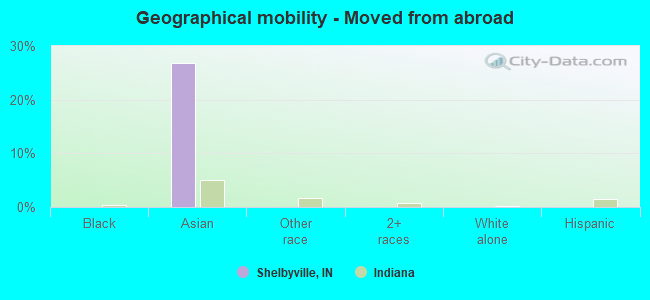
Geographical mobility - Moved from abroad (%)
Geographical mobility - Moved from abroad (%) - White
Geographical mobility - Moved from abroad (%) - Black or African American
Geographical mobility - Moved from abroad (%) - Asian
Geographical mobility - Moved from abroad (%) - Hispanic or Latino
Geographical mobility - Moved from abroad (%) - American Indian and Alaska Native
Geographical mobility - Moved from abroad (%) - Multirace
Geographical mobility - Moved from abroad (%) - Other Race
Place of birth for the foreign-born population - Ireland (%)
Place of birth for the foreign-born population - Denmark (%)
Place of birth for the foreign-born population - Norway (%)
Place of birth for the foreign-born population - Sweden (%)
Place of birth for the foreign-born population - United Kingdom (%)
Place of birth for the foreign-born population - England (%)
Place of birth for the foreign-born population - Scotland (%)
Place of birth for the foreign-born population - Other Northern Europe (%)
Place of birth for the foreign-born population - Austria (%)
Place of birth for the foreign-born population - Belgium (%)
Place of birth for the foreign-born population - France (%)
Place of birth for the foreign-born population - Germany (%)
Place of birth for the foreign-born population - Netherlands (%)
Place of birth for the foreign-born population - Switzerland (%)
Place of birth for the foreign-born population - Other Western Europe (%)
Place of birth for the foreign-born population - Greece (%)
Place of birth for the foreign-born population - Italy (%)
Place of birth for the foreign-born population - Portugal (%)
Place of birth for the foreign-born population - Spain (%)
Place of birth for the foreign-born population - Other Southern Europe (%)
Place of birth for the foreign-born population - Albania (%)
Place of birth for the foreign-born population - Belarus (%)
Place of birth for the foreign-born population - Bosnia and Herzegovina (%)
Place of birth for the foreign-born population - Bulgaria (%)
Place of birth for the foreign-born population - Croatia (%)
Place of birth for the foreign-born population - Czechoslovakia (%)
Place of birth for the foreign-born population - Hungary (%)
Place of birth for the foreign-born population - Latvia (%)
Place of birth for the foreign-born population - Lithuania (%)
Place of birth for the foreign-born population - North Macedonia (Macedonia) (%)
Place of birth for the foreign-born population - Moldova (%)
Place of birth for the foreign-born population - Poland (%)
Place of birth for the foreign-born population - Romania (%)
Place of birth for the foreign-born population - Russia (%)
Place of birth for the foreign-born population - Serbia (%)
Place of birth for the foreign-born population - Ukraine (%)
Place of birth for the foreign-born population - Other Eastern Europe (%)
Place of birth for the foreign-born population - China (%)
Place of birth for the foreign-born population - Hong Kong (%)
Place of birth for the foreign-born population - Taiwan (%)
Place of birth for the foreign-born population - Japan (%)
Place of birth for the foreign-born population - Korea (%)
Place of birth for the foreign-born population - Other Eastern Asia (%)
Place of birth for the foreign-born population - Afghanistan (%)
Place of birth for the foreign-born population - Bangladesh (%)
Place of birth for the foreign-born population - India (%)
Place of birth for the foreign-born population - Iran (%)
Place of birth for the foreign-born population - Kazakhstan (%)
Place of birth for the foreign-born population - Nepal (%)
Place of birth for the foreign-born population - Pakistan (%)
Place of birth for the foreign-born population - Sri Lanka (%)
Place of birth for the foreign-born population - Uzbekistan (%)
Place of birth for the foreign-born population - Other South Central Asia (%)
Place of birth for the foreign-born population - Burma (%)
Place of birth for the foreign-born population - Cambodia (%)
Place of birth for the foreign-born population - Indonesia (%)
Place of birth for the foreign-born population - Laos (%)
Place of birth for the foreign-born population - Malaysia (%)
Place of birth for the foreign-born population - Philippines (%)
Place of birth for the foreign-born population - Singapore (%)
Place of birth for the foreign-born population - Thailand (%)
Place of birth for the foreign-born population - Vietnam (%)
Place of birth for the foreign-born population - Other South Eastern Asia (%)
Place of birth for the foreign-born population - Armenia (%)
Place of birth for the foreign-born population - Iraq (%)
Place of birth for the foreign-born population - Israel (%)
Place of birth for the foreign-born population - Jordan (%)
Place of birth for the foreign-born population - Kuwait (%)
Place of birth for the foreign-born population - Lebanon (%)
Place of birth for the foreign-born population - Saudi Arabia (%)
Place of birth for the foreign-born population - Syria (%)
Place of birth for the foreign-born population - Turkey (%)
Place of birth for the foreign-born population - Yemen (%)
Place of birth for the foreign-born population - Other Western Asia (%)
Place of birth for the foreign-born population - Eritrea (%)
Place of birth for the foreign-born population - Ethiopia (%)
Place of birth for the foreign-born population - Kenya (%)
Place of birth for the foreign-born population - Somalia (%)
Place of birth for the foreign-born population - Uganda (%)
Place of birth for the foreign-born population - Zimbabwe (%)
Place of birth for the foreign-born population - Other Eastern Africa (%)
Place of birth for the foreign-born population - Cameroon (%)
Place of birth for the foreign-born population - Congo (%)
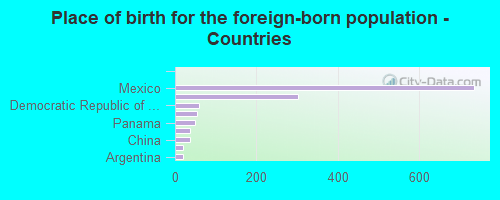
Place of birth for the foreign-born population - Democratic Republic of Congo (Zaire) (%)
Place of birth for the foreign-born population - Other Middle Africa (%)
Place of birth for the foreign-born population - Egypt (%)
Place of birth for the foreign-born population - Morocco (%)
Place of birth for the foreign-born population - Sudan (%)
Place of birth for the foreign-born population - Other Northern Africa (%)
Place of birth for the foreign-born population - South Africa (%)
Place of birth for the foreign-born population - Other Southern Africa (%)
Place of birth for the foreign-born population - Cabo Verde (%)
Place of birth for the foreign-born population - Ghana (%)
Place of birth for the foreign-born population - Liberia (%)
Place of birth for the foreign-born population - Nigeria (%)
Place of birth for the foreign-born population - Senegal (%)
Place of birth for the foreign-born population - Sierra Leone (%)
Place of birth for the foreign-born population - Other Western Africa (%)
Place of birth for the foreign-born population - Australia (%)
Place of birth for the foreign-born population - New Zealand (%)
Place of birth for the foreign-born population - Fiji (%)
Place of birth for the foreign-born population - Micronesia (%)
Place of birth for the foreign-born population - Bahamas (%)
Place of birth for the foreign-born population - Barbados (%)
Place of birth for the foreign-born population - Cuba (%)
Place of birth for the foreign-born population - Dominica (%)
Place of birth for the foreign-born population - Dominican Republic (%)
Place of birth for the foreign-born population - Grenada (%)
Place of birth for the foreign-born population - Haiti (%)
Place of birth for the foreign-born population - Jamaica (%)
Place of birth for the foreign-born population - St. Vincent and the Grenadines (%)
Place of birth for the foreign-born population - Trinidad and Tobago (%)
Place of birth for the foreign-born population - West Indies (%)
Place of birth for the foreign-born population - Other Caribbean (%)
Place of birth for the foreign-born population - Belize (%)
Place of birth for the foreign-born population - Costa Rica (%)
Place of birth for the foreign-born population - El Salvador (%)
Place of birth for the foreign-born population - Guatemala (%)
Place of birth for the foreign-born population - Honduras (%)
Place of birth for the foreign-born population - Mexico (%)
Place of birth for the foreign-born population - Nicaragua (%)
Place of birth for the foreign-born population - Panama (%)
Place of birth for the foreign-born population - Other Central America (%)
Place of birth for the foreign-born population - Argentina (%)
Place of birth for the foreign-born population - Bolivia (%)
Place of birth for the foreign-born population - Brazil (%)
Place of birth for the foreign-born population - Chile (%)
Place of birth for the foreign-born population - Colombia (%)
Place of birth for the foreign-born population - Ecuador (%)
Place of birth for the foreign-born population - Guyana (%)
Place of birth for the foreign-born population - Peru (%)
Place of birth for the foreign-born population - Uruguay (%)
Place of birth for the foreign-born population - Venezuela (%)
Place of birth for the foreign-born population - Other South America (%)
Place of birth for the foreign-born population - Canada (%)
Place of birth for the foreign-born population - Other Northern America (%)
Place of birth for the foreign-born population - Other (%)
Latest news about races in Shelbyville, IN collected exclusively by city-data.com from local newspapers, TV, and radio stations
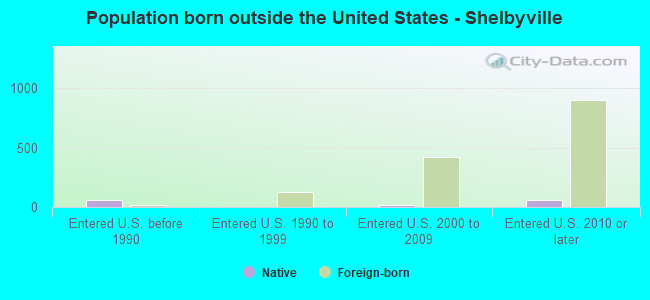
According to 2022 data, the most numerous races in Shelbyville, IN are White alone (16,603 residents), Black alone (533 residents), and Hispanic (1,803 residents). 89.5% of Shelbyville residents speak English at home. 7.1% of Shelbyville, IN residents are foreign-born (4.0% born in Latin America, 1.7% born in Asia, 0.7% born in Africa), which is 16.0% greater than the foreign-born rate of 6.0% across the entire state of Indiana.
Race distribution in Shelbyville
2000 2022
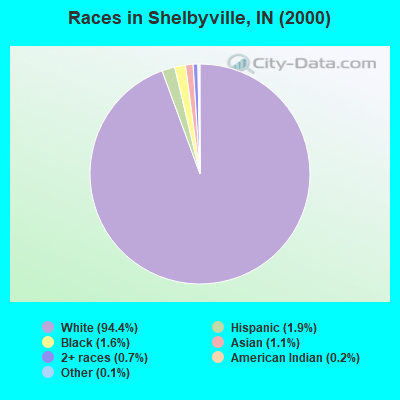
5,219,373 85.8% White alone 505,462 8.3% Black alone 214,536 3.5% Hispanic 61,115 1.0% Two or more races 58,424 1.0% Asian alone 13,654 0.2% American Indian alone 6,348 0.1% Other race alone 1,573 0.03% Native Hawaiian and Other
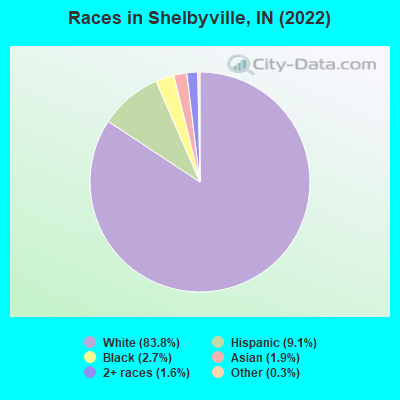
5,192,455 76.0% White alone 628,054 9.2% Black alone 534,528 7.8% Hispanic 263,242 3.9% Two or more races 172,880 2.5% Asian alone 33,467 0.5% Other race alone 5,866 0.09% American Indian alone 2,545 0.04% Native Hawaiian and Other
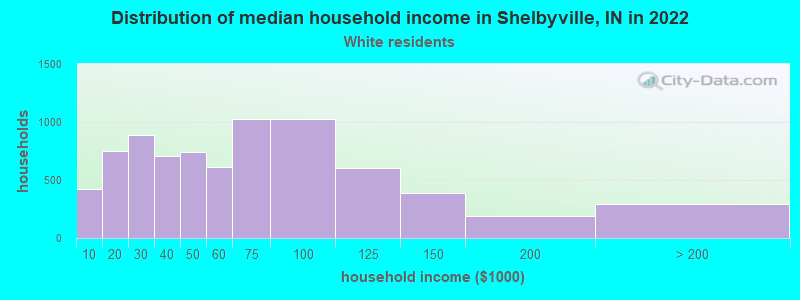
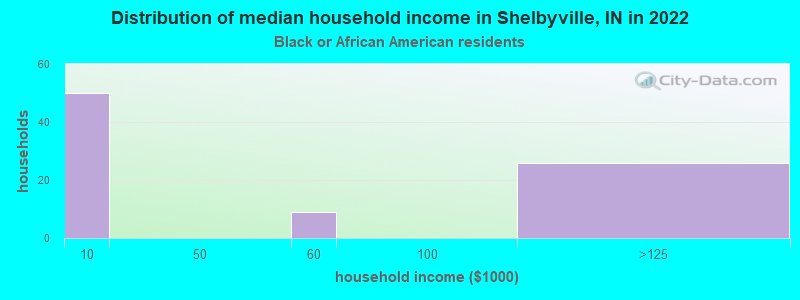
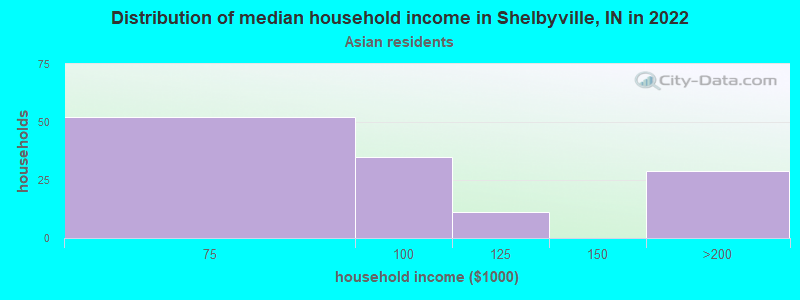
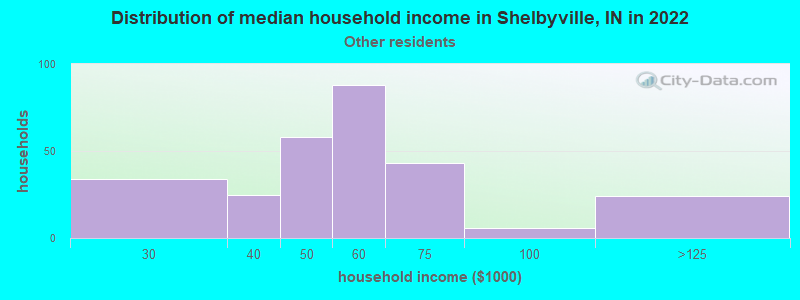
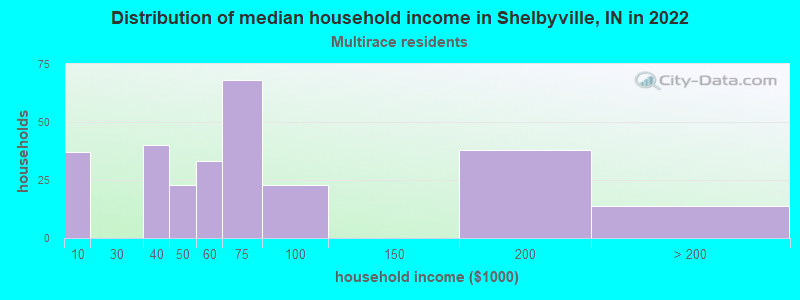
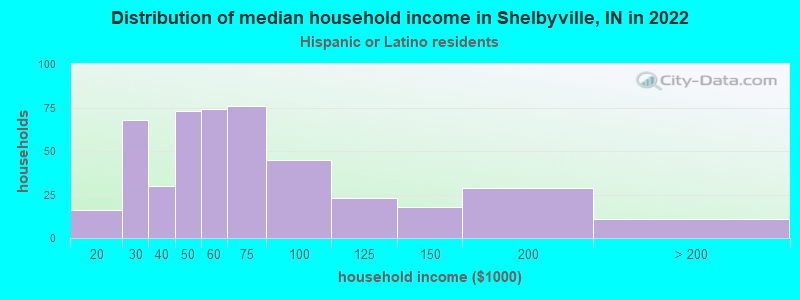
Income and house value in Shelbyville Median household income in 2022 $55,257 White non-Hispanic householders$85,986 Asian householders$49,754 Some other race householders$62,839 Two or more races householders$51,801 Hispanic or Latino race householdersMedian 2022 house value $157,734 White Non-Hispanic householders$120,428 Black or African American householders $117,712 Asian householders$125,680 Two or more races householders$249,007 Hispanic or Latino householders
Median age by race in Shelbyville
38.9 Median age for White residents36.1 41.1 21.9 Median age for Black or African American residents32.0 16.0 -558,797,523.8 Median age for American Indian / Alaska Native residents-654,255,318.5 -491,600,353.2 32.8 Median age for Asian residents31.9 36.4 -664,335,663.7 Median age for Native Hawaiian / Pacific Islander residents-644,025,156.6 -664,437,011.6 31.0 Median age for Other race residents31.3 31.4 34.8 Median age for Two or more races residents34.1 30.0 39.6 Median age for White alone residents36.3 43.2 28.9 Median age for Hispanic or Latino residents28.5 27.3
Owner/renter occupied households by race in Shelbyville
House owners and renters - White residents 4,587 60.3% Owner occupied3,023 39.7% Renter occupiedHouse owners and renters - Black or African American residents 20 26.7% Owner occupied55 73.3% Renter occupiedHouse owners and renters - Asian residents 17 13.7% Owner occupied107 86.3% Renter occupiedHouse owners and renters - Other race residents 30 11.3% Owner occupied237 88.7% Renter occupiedHouse owners and renters - Two or more races residents 87 32.1% Owner occupied184 67.9% Renter occupiedHouse owners and renters - White alone residents 4,531 60.2% Owner occupied2,999 39.8% Renter occupiedHouse owners and renters - Hispanic or Latino residents 136 29.8% Owner occupied319 70.2% Renter occupied
Language usage in Shelbyville
English speakers - Total 89.5% of residents of Shelbyville speak English at home.
7.4% of residents speak Spanish at home 694 51.8% Speak English very well647 48.2% Speak English less than very well3.1% of residents speak other language at home 227 39.9% Speak English very well342 60.1% Speak English less than very well
English speakers - Born in the United States 92.4% of residents of Shelbyville speak English at home.
5.1% of residents speak Spanish at home 152 89.4% Speak English very well18 10.6% Speak English less than very well2.7% of residents speak other language at home 91 100.0% Speak English very well
English speakers - Native, born elsewhere 40.9% of residents of Shelbyville speak English at home.
34.6% of residents speak Spanish at home 44 100.0% Speak English less than very well29.9% of residents speak other language at home 38 100.0% Speak English very well
English speakers - Foreign-born 7.4% of residents of Shelbyville speak English at home.
61.5% of residents speak Spanish at home 293 35.4% Speak English very well535 64.6% Speak English less than very well31.0% of residents speak other language at home 81 19.4% Speak English very well336 80.6% Speak English less than very well
White (Caucasian) - Speak only English Native:
98.3% (15,337)Foreign-born:
8.9% (22)
White (Caucasian) - Speak another language Native:
1.8% (281)Foreign-born:
85.8% (215)
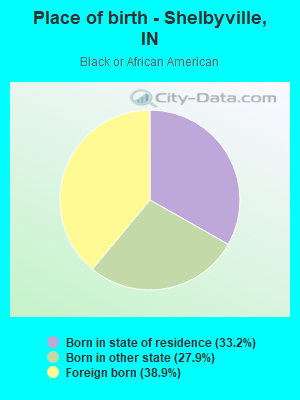
Black or African American - Speak only English Native:
99.5% (276)Foreign-born:
23.6% (56)
Other race - Speak only English Native:
40.7% (117)Foreign-born:
1.7% (9)
Other race - Speak another language Native:
57.4% (166)Foreign-born:
96.3% (491)
Two or more races - Speak only English Native:
60.5% (349)Foreign-born:
24.8% (16)
Two or more races - Speak another language Native:
43.5% (252)Foreign-born:
76.1% (48)
White alone - Speak only English Native:
98.8% (15,292)Foreign-born:
74.5% (15)
White alone - Speak another language Native:
1.1% (171)Foreign-born:
21.0% (4)
Hispanic or Latino - Speak only English Native:
34.6% (253)Foreign-born:
3.3% (29)
Hispanic or Latino - Speak another language Native:
66.6% (486)Foreign-born:
96.4% (830)
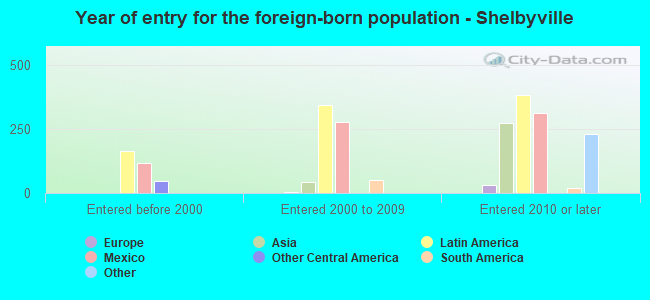
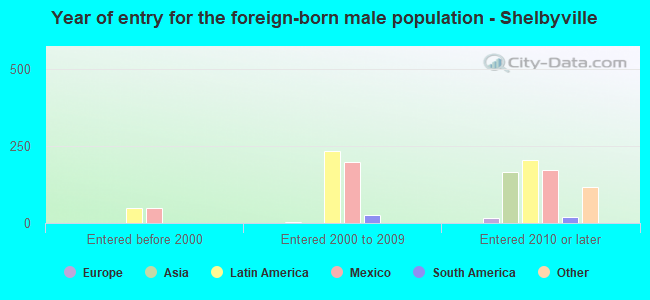
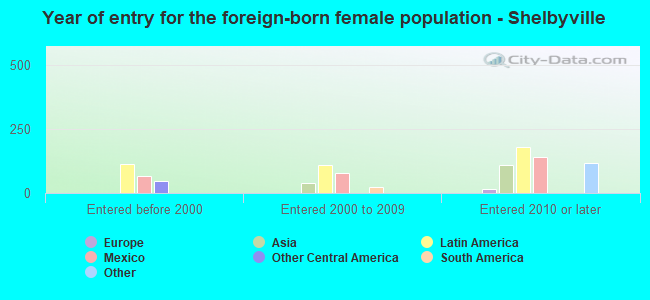
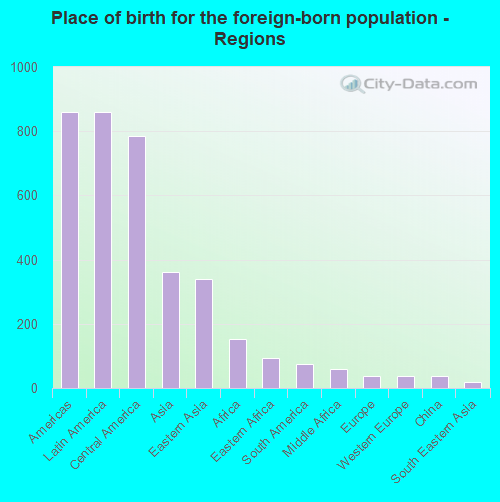
Foreign-born residents in Shelbyville 1,415 residents are foreign born (4.0% Latin America , 1.7% Asia , 0.7% Africa ).
This city:
7.1%Indiana:
5.6%
Marital status for residents in Shelbyville Marital status - White (Caucasian) population 15 years and over
Males 29.3% Never married48.8% Now married2.9% Separated4.4% Widowed14.5% DivorcedFemales 20.4% Never married48.0% Now married1.6% Separated9.0% Widowed21.0% DivorcedWomen who gave birth in the past 12 months Now married:
68.6% (253)Unmarried:
31.4% (116)
Women who did not give birth in the past 12 months Now married:
47.3% (1,535)Unmarried:
52.7% (1,711)
Marital status - Black or African American population 15 years and over
Males 36.8% Never married56.3% Now married3.4% Separated0.0% Widowed3.4% DivorcedFemales 50.5% Never married43.6% Now married0.0% Separated1.8% Widowed4.1% DivorcedWomen who did not give birth in the past 12 months Now married:
42.1% (77)Unmarried:
57.9% (106)
Marital status - Asian population 15 years and over
Males 0.0% Never married80.5% Now married19.5% Separated0.0% Widowed0.0% DivorcedFemales 0.0% Never married87.5% Now married12.5% Separated0.0% Widowed0.0% DivorcedWomen who gave birth in the past 12 months Now married:
100.0% (20)Unmarried:
0.0% (0)
Women who did not give birth in the past 12 months Now married:
100.0% (91)Unmarried:
0.0% (0)
Marital status - Other race population 15 years and over
Males 52.0% Never married33.5% Now married9.7% Separated0.0% Widowed4.8% DivorcedFemales 19.3% Never married48.8% Now married0.0% Separated0.0% Widowed31.9% DivorcedWomen who gave birth in the past 12 months Now married:
100.0% (10)Unmarried:
0.0% (0)
Women who did not give birth in the past 12 months Now married:
45.8% (85)Unmarried:
54.2% (101)
Marital status - Two or more races population 15 years and over
Males 9.4% Never married60.8% Now married0.0% Separated18.2% Widowed11.6% DivorcedFemales 35.4% Never married54.3% Now married0.0% Separated3.6% Widowed6.7% DivorcedWomen who did not give birth in the past 12 months Now married:
45.2% (96)Unmarried:
54.8% (116)
Marital status - White alone, not Hispanic / Latino population 15 years and over
Males 29.6% Never married48.0% Now married3.0% Separated4.6% Widowed14.8% DivorcedFemales 20.7% Never married47.5% Now married1.7% Separated9.1% Widowed21.0% DivorcedWomen who gave birth in the past 12 months Now married:
66.9% (239)Unmarried:
33.1% (118)
Women who did not give birth in the past 12 months Now married:
46.1% (1,434)Unmarried:
53.9% (1,675)
Marital status - Hispanic or Latino population 15 years and over
Males 31.1% Never married56.6% Now married2.3% Separated5.5% Widowed4.5% DivorcedFemales 13.2% Never married62.3% Now married0.0% Separated2.1% Widowed22.3% DivorcedWomen who gave birth in the past 12 months Now married:
100.0% (29)Unmarried:
0.0% (0)
Women who did not give birth in the past 12 months Now married:
60.7% (272)Unmarried:
39.3% (176)
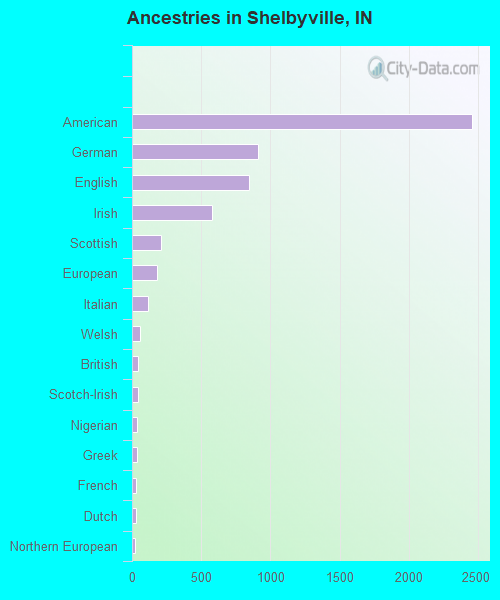
Ancestries in Shelbyville
2,455 29.3% American911 10.9% German845 10.1% English575 6.9% Irish206 2.5% Scottish177 2.1% European115 1.4% Italian58 0.7% Welsh45 0.5% British40 0.5% Scotch-Irish39 0.5% Nigerian38 0.5% Greek31 0.4% French28 0.3% Dutch24 0.3% Northern European17 0.2% Polish14 0.2% African10 0.1% Swedish7 0.08% Eastern European
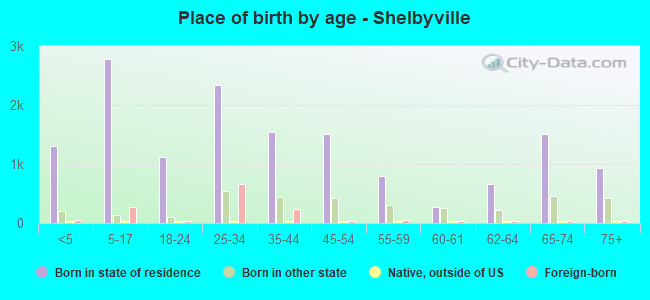
Children Nativity (place of birth) in Shelbyville
Children under 6 years - Living with two parents Both parents native 593 100.0% NativeBoth parents foreign-born 212 76.8% Native64 23.2% Foreign-bornOne native, one foreign-born parent 102 100.0% NativeChildren under 6 years - Living with one parent Native parent 558 100.0% NativeForeign-born parent 54 100.0% NativeChildren 6 to 17 years - Living with two parents Both parents native 1,774 96.8% Native59 3.2% Foreign-bornBoth parents foreign-born 165 69.8% Native71 30.2% Foreign-bornOne native, one foreign-born parent 170 86.4% Native27 13.6% Foreign-bornChildren 6 to 17 years - Living with one parent Native parent 607 88.0% Native83 12.0% Foreign-bornForeign-born parent 64 100.0% Native
Grandparents responsible for own grandchildren in Shelbyville
Grandparents (30 to 59 years) White / Caucasian 97 84.8% Responsible for grandchildren17 15.2% Not responsible for grandchildrenOther race 15 100.0% Not responsible for grandchildrenWhite alone, not Hispanic / Latino 100 84.5% Responsible for grandchildren18 15.5% Not responsible for grandchildrenHispanic or Latino 10 100.0% Not responsible for grandchildren
Grandparents (60 years and over) White / Caucasian 57 100.0% Not responsible for grandchildrenWhite alone, not Hispanic / Latino 58 100.0% Not responsible for grandchildren