Races in Shelbyville, Kentucky (KY) Detailed Stats
Data:
Races - White alone (%)
Races - White alone (% change since 2000)
Races - Black alone (%)
Races - Black alone (% change since 2000)
Races - American Indian alone (%)
Races - American Indian alone (% change since 2000)
Races - Asian alone (%)
Races - Asian alone (% change since 2000)
Races - Hispanic (%)
Races - Hispanic (% change since 2000)
Races - Native Hawaiian and Other Pacific Islander alone (%)
Races - Native Hawaiian and Other Pacific Islander alone (% change since 2000)
Races - Two or more races(%)
Races - Two or more races(% change since 2000)
Races - Other race alone (%)
Races - Other race alone (% change since 2000)
Racial diversity
Place of birth - Born in state of residence (%)
Place of birth - Born in state of residence (%) - White
Place of birth - Born in state of residence (%) - Black or African American
Place of birth - Born in state of residence (%) - Asian
Place of birth - Born in state of residence (%) - Hispanic or Latino
Place of birth - Born in state of residence (%) - American Indian and Alaska Native
Place of birth - Born in state of residence (%) - Multirace
Place of birth - Born in state of residence (%) - Other Race
Place of birth - Born in other state (%)
Place of birth - Born in other state (%) - White
Place of birth - Born in other state (%) - Black or African American
Place of birth - Born in other state (%) - Asian
Place of birth - Born in other state (%) - Hispanic or Latino
Place of birth - Born in other state (%) - American Indian and Alaska Native
Place of birth - Born in other state (%) - Multirace
Place of birth - Born in other state (%) - Other Race
Place of birth - Native, outside of US (%)
Place of birth - Native, outside of US (%) - White
Place of birth - Native, outside of US (%) - Black or African American
Place of birth - Native, outside of US (%) - Asian
Place of birth - Native, outside of US (%) - Hispanic or Latino
Place of birth - Native, outside of US (%) - American Indian and Alaska Native
Place of birth - Native, outside of US (%) - Multirace
Place of birth - Native, outside of US (%) - Other Race
Place of birth - Foreign born (%)
Place of birth - Foreign born (%) - White
Place of birth - Foreign born (%) - Black or African American
Place of birth - Foreign born (%) - Asian
Place of birth - Foreign born (%) - Hispanic or Latino
Place of birth - Foreign born (%) - American Indian and Alaska Native
Place of birth - Foreign born (%) - Multirace
Place of birth - Foreign born (%) - Other Race
Residents speaking English at home (%)
Residents speaking English at home - Born in the United States (%)
Residents speaking English at home - Native, born elsewhere (%)
Residents speaking English at home - Foreign born (%)
Residents speaking Spanish at home (%)
Residents speaking Spanish at home - Born in the United States (%)
Residents speaking Spanish at home - Native, born elsewhere (%)
Residents speaking Spanish at home - Foreign born (%)
Residents speaking other language at home (%)
Residents speaking other language at home - Born in the United States (%)
Residents speaking other language at home - Native, born elsewhere (%)
Residents speaking other language at home - Foreign born (%)
Marital status - Never married (%)
Marital status - Now married (%)
Marital status - Separated (%)
Marital status - Widowed (%)
Marital status - Divorced (%)
Ancestries Reported - Arab (%)
Ancestries Reported - Czech (%)
Ancestries Reported - Danish (%)
Ancestries Reported - Dutch (%)
Ancestries Reported - English (%)
Ancestries Reported - French (%)
Ancestries Reported - French Canadian (%)
Ancestries Reported - German (%)
Ancestries Reported - Greek (%)
Ancestries Reported - Hungarian (%)
Ancestries Reported - Irish (%)
Ancestries Reported - Italian (%)
Ancestries Reported - Lithuanian (%)
Ancestries Reported - Norwegian (%)
Ancestries Reported - Polish (%)
Ancestries Reported - Portuguese (%)
Ancestries Reported - Russian (%)
Ancestries Reported - Scotch-Irish (%)
Ancestries Reported - Scottish (%)
Ancestries Reported - Slovak (%)
Ancestries Reported - Subsaharan African (%)
Ancestries Reported - Swedish (%)
Ancestries Reported - Swiss (%)
Ancestries Reported - Ukrainian (%)
Ancestries Reported - United States (%)
Ancestries Reported - Welsh (%)
Ancestries Reported - West Indian (%)
Ancestries Reported - Other (%)
Geographical mobility - Same house 1 year ago (%)
Geographical mobility - Same house 1 year ago (%) - White
Geographical mobility - Same house 1 year ago (%) - Black or African American
Geographical mobility - Same house 1 year ago (%) - Asian
Geographical mobility - Same house 1 year ago (%) - Hispanic or Latino
Geographical mobility - Same house 1 year ago (%) - American Indian and Alaska Native
Geographical mobility - Same house 1 year ago (%) - Multirace
Geographical mobility - Same house 1 year ago (%) - Other Race
Geographical mobility - Moved within same county (%)
Geographical mobility - Moved within same county (%) - White
Geographical mobility - Moved within same county (%) - Black or African American
Geographical mobility - Moved within same county (%) - Asian
Geographical mobility - Moved within same county (%) - Hispanic or Latino
Geographical mobility - Moved within same county (%) - American Indian and Alaska Native
Geographical mobility - Moved within same county (%) - Multirace
Geographical mobility - Moved within same county (%) - Other Race
Geographical mobility - Moved from different county within same state (%)
Geographical mobility - Moved from different county within same state (%) - White
Geographical mobility - Moved from different county within same state (%) - Black or African American
Geographical mobility - Moved from different county within same state (%) - Asian
Geographical mobility - Moved from different county within same state (%) - Hispanic or Latino
Geographical mobility - Moved from different county within same state (%) - American Indian and Alaska Native
Geographical mobility - Moved from different county within same state (%) - Multirace
Geographical mobility - Moved from different county within same state (%) - Other Race
Geographical mobility - Moved from different state (%)
Geographical mobility - Moved from different state (%) - White
Geographical mobility - Moved from different state (%) - Black or African American
Geographical mobility - Moved from different state (%) - Asian
Geographical mobility - Moved from different state (%) - Hispanic or Latino
Geographical mobility - Moved from different state (%) - American Indian and Alaska Native
Geographical mobility - Moved from different state (%) - Multirace
Geographical mobility - Moved from different state (%) - Other Race
Geographical mobility - Moved from abroad (%)
Geographical mobility - Moved from abroad (%) - White
Geographical mobility - Moved from abroad (%) - Black or African American
Geographical mobility - Moved from abroad (%) - Asian
Geographical mobility - Moved from abroad (%) - Hispanic or Latino
Geographical mobility - Moved from abroad (%) - American Indian and Alaska Native
Geographical mobility - Moved from abroad (%) - Multirace
Geographical mobility - Moved from abroad (%) - Other Race
Place of birth for the foreign-born population - Ireland (%)
Place of birth for the foreign-born population - Denmark (%)
Place of birth for the foreign-born population - Norway (%)
Place of birth for the foreign-born population - Sweden (%)
Place of birth for the foreign-born population - United Kingdom (%)
Place of birth for the foreign-born population - England (%)
Place of birth for the foreign-born population - Scotland (%)
Place of birth for the foreign-born population - Other Northern Europe (%)
Place of birth for the foreign-born population - Austria (%)
Place of birth for the foreign-born population - Belgium (%)
Place of birth for the foreign-born population - France (%)
Place of birth for the foreign-born population - Germany (%)
Place of birth for the foreign-born population - Netherlands (%)
Place of birth for the foreign-born population - Switzerland (%)
Place of birth for the foreign-born population - Other Western Europe (%)
Place of birth for the foreign-born population - Greece (%)
Place of birth for the foreign-born population - Italy (%)
Place of birth for the foreign-born population - Portugal (%)
Place of birth for the foreign-born population - Spain (%)
Place of birth for the foreign-born population - Other Southern Europe (%)
Place of birth for the foreign-born population - Albania (%)
Place of birth for the foreign-born population - Belarus (%)
Place of birth for the foreign-born population - Bosnia and Herzegovina (%)
Place of birth for the foreign-born population - Bulgaria (%)
Place of birth for the foreign-born population - Croatia (%)
Place of birth for the foreign-born population - Czechoslovakia (%)
Place of birth for the foreign-born population - Hungary (%)
Place of birth for the foreign-born population - Latvia (%)
Place of birth for the foreign-born population - Lithuania (%)
Place of birth for the foreign-born population - North Macedonia (Macedonia) (%)
Place of birth for the foreign-born population - Moldova (%)
Place of birth for the foreign-born population - Poland (%)
Place of birth for the foreign-born population - Romania (%)
Place of birth for the foreign-born population - Russia (%)
Place of birth for the foreign-born population - Serbia (%)
Place of birth for the foreign-born population - Ukraine (%)
Place of birth for the foreign-born population - Other Eastern Europe (%)
Place of birth for the foreign-born population - China (%)
Place of birth for the foreign-born population - Hong Kong (%)
Place of birth for the foreign-born population - Taiwan (%)
Place of birth for the foreign-born population - Japan (%)
Place of birth for the foreign-born population - Korea (%)
Place of birth for the foreign-born population - Other Eastern Asia (%)
Place of birth for the foreign-born population - Afghanistan (%)
Place of birth for the foreign-born population - Bangladesh (%)
Place of birth for the foreign-born population - India (%)
Place of birth for the foreign-born population - Iran (%)
Place of birth for the foreign-born population - Kazakhstan (%)
Place of birth for the foreign-born population - Nepal (%)
Place of birth for the foreign-born population - Pakistan (%)
Place of birth for the foreign-born population - Sri Lanka (%)
Place of birth for the foreign-born population - Uzbekistan (%)
Place of birth for the foreign-born population - Other South Central Asia (%)
Place of birth for the foreign-born population - Burma (%)
Place of birth for the foreign-born population - Cambodia (%)
Place of birth for the foreign-born population - Indonesia (%)
Place of birth for the foreign-born population - Laos (%)
Place of birth for the foreign-born population - Malaysia (%)
Place of birth for the foreign-born population - Philippines (%)
Place of birth for the foreign-born population - Singapore (%)
Place of birth for the foreign-born population - Thailand (%)
Place of birth for the foreign-born population - Vietnam (%)
Place of birth for the foreign-born population - Other South Eastern Asia (%)
Place of birth for the foreign-born population - Armenia (%)
Place of birth for the foreign-born population - Iraq (%)
Place of birth for the foreign-born population - Israel (%)
Place of birth for the foreign-born population - Jordan (%)
Place of birth for the foreign-born population - Kuwait (%)
Place of birth for the foreign-born population - Lebanon (%)
Place of birth for the foreign-born population - Saudi Arabia (%)
Place of birth for the foreign-born population - Syria (%)
Place of birth for the foreign-born population - Turkey (%)
Place of birth for the foreign-born population - Yemen (%)
Place of birth for the foreign-born population - Other Western Asia (%)
Place of birth for the foreign-born population - Eritrea (%)
Place of birth for the foreign-born population - Ethiopia (%)
Place of birth for the foreign-born population - Kenya (%)
Place of birth for the foreign-born population - Somalia (%)
Place of birth for the foreign-born population - Uganda (%)
Place of birth for the foreign-born population - Zimbabwe (%)
Place of birth for the foreign-born population - Other Eastern Africa (%)
Place of birth for the foreign-born population - Cameroon (%)
Place of birth for the foreign-born population - Congo (%)
Place of birth for the foreign-born population - Democratic Republic of Congo (Zaire) (%)
Place of birth for the foreign-born population - Other Middle Africa (%)
Place of birth for the foreign-born population - Egypt (%)
Place of birth for the foreign-born population - Morocco (%)
Place of birth for the foreign-born population - Sudan (%)
Place of birth for the foreign-born population - Other Northern Africa (%)
Place of birth for the foreign-born population - South Africa (%)
Place of birth for the foreign-born population - Other Southern Africa (%)
Place of birth for the foreign-born population - Cabo Verde (%)
Place of birth for the foreign-born population - Ghana (%)
Place of birth for the foreign-born population - Liberia (%)
Place of birth for the foreign-born population - Nigeria (%)
Place of birth for the foreign-born population - Senegal (%)
Place of birth for the foreign-born population - Sierra Leone (%)
Place of birth for the foreign-born population - Other Western Africa (%)
Place of birth for the foreign-born population - Australia (%)
Place of birth for the foreign-born population - New Zealand (%)
Place of birth for the foreign-born population - Fiji (%)
Place of birth for the foreign-born population - Micronesia (%)
Place of birth for the foreign-born population - Bahamas (%)
Place of birth for the foreign-born population - Barbados (%)
Place of birth for the foreign-born population - Cuba (%)
Place of birth for the foreign-born population - Dominica (%)
Place of birth for the foreign-born population - Dominican Republic (%)
Place of birth for the foreign-born population - Grenada (%)
Place of birth for the foreign-born population - Haiti (%)
Place of birth for the foreign-born population - Jamaica (%)
Place of birth for the foreign-born population - St. Vincent and the Grenadines (%)
Place of birth for the foreign-born population - Trinidad and Tobago (%)
Place of birth for the foreign-born population - West Indies (%)
Place of birth for the foreign-born population - Other Caribbean (%)
Place of birth for the foreign-born population - Belize (%)
Place of birth for the foreign-born population - Costa Rica (%)
Place of birth for the foreign-born population - El Salvador (%)
Place of birth for the foreign-born population - Guatemala (%)
Place of birth for the foreign-born population - Honduras (%)
Place of birth for the foreign-born population - Mexico (%)
Place of birth for the foreign-born population - Nicaragua (%)
Place of birth for the foreign-born population - Panama (%)
Place of birth for the foreign-born population - Other Central America (%)
Place of birth for the foreign-born population - Argentina (%)
Place of birth for the foreign-born population - Bolivia (%)
Place of birth for the foreign-born population - Brazil (%)
Place of birth for the foreign-born population - Chile (%)
Place of birth for the foreign-born population - Colombia (%)
Place of birth for the foreign-born population - Ecuador (%)
Place of birth for the foreign-born population - Guyana (%)
Place of birth for the foreign-born population - Peru (%)
Place of birth for the foreign-born population - Uruguay (%)
Place of birth for the foreign-born population - Venezuela (%)
Place of birth for the foreign-born population - Other South America (%)
Place of birth for the foreign-born population - Canada (%)
Place of birth for the foreign-born population - Other Northern America (%)
Place of birth for the foreign-born population - Other (%)
Latest news about races in Shelbyville, KY collected exclusively by city-data.com from local newspapers, TV, and radio stations
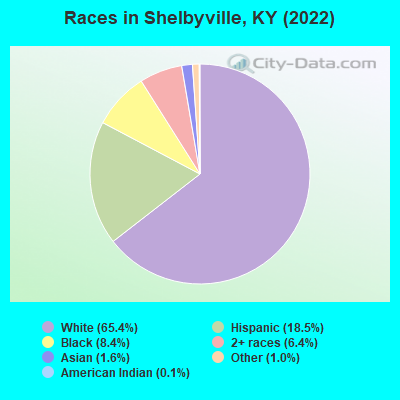
According to 2022 data, the most numerous races in Shelbyville, KY are White alone (11,294 residents), Black alone (1,455 residents), and Hispanic (3,193 residents). 81.6% of Shelbyville residents speak English at home. 9.7% of Shelbyville, KY residents are foreign-born (7.0% born in Latin America, 1.3% born in Africa, 1.0% born in Asia), which is 58.7% greater than the foreign-born rate of 4.0% across the entire state of Kentucky.
Race distribution in Shelbyville
2000 2022
3,608,013 89.3% White alone 293,639 7.3% Black alone 59,939 1.5% Hispanic 37,750 0.9% Two or more races 29,368 0.7% Asian alone 7,939 0.2% American Indian alone 3,846 0.10% Other race alone 1,275 0.03% Native Hawaiian and Other
3,710,998 82.2% White alone 343,194 7.6% Black alone 187,483 4.2% Hispanic 187,394 4.2% Two or more races 62,240 1.4% Asian alone 13,529 0.3% Other race alone 4,302 0.10% American Indian alone 3,170 0.07% Native Hawaiian and Other
Income and house value in Shelbyville Median household income in 2022 $75,784 White non-Hispanic householders$51,381 Black householders$109,882 Some other race householders$49,307 Two or more races householders$85,693 Hispanic or Latino race householdersMedian 2022 house value $267,989 White Non-Hispanic householders$133,429 Black or African American householders$192,228 Some other race householders$293,996 Two or more races householdersover $1,000,000 Hispanic or Latino householders
Median age by race in Shelbyville
38.8 Median age for White residents38.3 39.5 40.9 Median age for Black or African American residents47.4 27.2 -521,556,256.1 Median age for American Indian / Alaska Native residents-607,449,856.1 -630,065,358.8 41.1 Median age for Asian residents34.9 42.0 -755,186,721.2 Median age for Native Hawaiian / Pacific Islander residents-724,043,715.1 -853,801,168.7 37.4 Median age for Other race residents36.0 39.4 26.6 Median age for Two or more races residents27.2 28.8 39.2 Median age for White alone residents38.9 39.7 28.5 Median age for Hispanic or Latino residents26.0 28.8
Owner/renter occupied households by race in Shelbyville
House owners and renters - White residents 2,989 59.2% Owner occupied2,059 40.8% Renter occupiedHouse owners and renters - Black or African American residents 298 50.9% Owner occupied288 49.1% Renter occupiedHouse owners and renters - Asian residents 81 100.0% Renter occupiedHouse owners and renters - Other race residents 260 67.7% Owner occupied124 32.3% Renter occupiedHouse owners and renters - Two or more races residents 298 39.0% Owner occupied467 61.0% Renter occupiedHouse owners and renters - White alone residents 2,891 60.9% Owner occupied1,854 39.1% Renter occupiedHouse owners and renters - Hispanic or Latino residents 394 44.8% Owner occupied486 55.2% Renter occupied
Language usage in Shelbyville
English speakers - Total 81.6% of residents of Shelbyville speak English at home.
14.9% of residents speak Spanish at home 1,380 57.4% Speak English very well1,025 42.6% Speak English less than very well3.5% of residents speak other language at home 275 48.7% Speak English very well290 51.3% Speak English less than very well
English speakers - Born in the United States 91.7% of residents of Shelbyville speak English at home.
5.1% of residents speak Spanish at home 161 73.2% Speak English very well59 26.8% Speak English less than very well3.3% of residents speak other language at home 144 100.0% Speak English very well
English speakers - Native, born elsewhere 31.4% of residents of Shelbyville speak English at home.
74.7% of residents speak Spanish at home 195 100.0% Speak English very well
English speakers - Foreign-born 7.2% of residents of Shelbyville speak English at home.
71.1% of residents speak Spanish at home 210 18.3% Speak English very well935 81.7% Speak English less than very well23.3% of residents speak other language at home 88 23.5% Speak English very well287 76.5% Speak English less than very well
White (Caucasian) - Speak only English Native:
95.4% (10,608)Foreign-born:
8.7% (33)
White (Caucasian) - Speak another language Native:
4.5% (503)Foreign-born:
83.7% (321)
Black or African American - Speak only English Native:
96.6% (1,202)Foreign-born:
13.4% (35)
Black or African American - Speak another language Native:
3.1% (38)Foreign-born:
85.3% (223)
Asian - Speak another language Native:
100.0% (105)Foreign-born:
100.0% (157)
Other race - Speak another language Native:
57.7% (413)Foreign-born:
98.6% (368)
Two or more races - Speak only English Native:
68.7% (1,151)Foreign-born:
13.7% (79)
Two or more races - Speak another language Native:
33.1% (554)Foreign-born:
86.7% (500)
White alone - Speak only English Native:
98.4% (10,384)Foreign-born:
57.5% (16)
White alone - Speak another language Native:
1.6% (172)Foreign-born:
44.4% (13)
Hispanic or Latino - Speak only English Native:
29.9% (524)Foreign-born:
5.5% (66)
Hispanic or Latino - Speak another language Native:
68.6% (1,204)Foreign-born:
94.6% (1,125)
Foreign-born residents in Shelbyville 1,673 residents are foreign born (7.0% Latin America , 1.3% Africa , 1.0% Asia ).
This city:
9.7%Kentucky:
4.1%
Marital status for residents in Shelbyville Marital status - White (Caucasian) population 15 years and over
Males 24.8% Never married60.4% Now married1.9% Separated0.8% Widowed12.0% DivorcedFemales 20.5% Never married48.9% Now married5.8% Separated9.9% Widowed14.9% DivorcedWomen who gave birth in the past 12 months Now married:
97.6% (156)Unmarried:
2.4% (4)
Women who did not give birth in the past 12 months Now married:
52.3% (1,586)Unmarried:
47.7% (1,445)
Marital status - Black or African American population 15 years and over
Males 36.2% Never married50.2% Now married1.6% Separated1.5% Widowed10.5% DivorcedFemales 56.7% Never married34.9% Now married0.0% Separated5.0% Widowed3.4% DivorcedWomen who did not give birth in the past 12 months Now married:
28.6% (129)Unmarried:
71.4% (323)
Marital status - Asian population 15 years and over
Males 0.0% Never married55.4% Now married0.0% Separated0.0% Widowed44.6% DivorcedFemales 0.0% Never married49.4% Now married0.0% Separated22.9% Widowed27.6% DivorcedWomen who did not give birth in the past 12 months Now married:
64.1% (75)Unmarried:
35.9% (42)
Marital status - Other race population 15 years and over
Males 24.6% Never married53.9% Now married7.7% Separated0.0% Widowed13.8% DivorcedFemales 40.1% Never married23.5% Now married0.0% Separated0.0% Widowed36.4% DivorcedWomen who did not give birth in the past 12 months Now married:
14.8% (51)Unmarried:
85.2% (296)
Marital status - Two or more races population 15 years and over
Males 43.3% Never married52.8% Now married0.0% Separated0.0% Widowed3.9% DivorcedFemales 42.7% Never married37.0% Now married2.3% Separated3.6% Widowed14.4% DivorcedWomen who did not give birth in the past 12 months Now married:
37.3% (322)Unmarried:
62.7% (541)
Marital status - White alone, not Hispanic / Latino population 15 years and over
Males 24.4% Never married61.0% Now married1.3% Separated0.9% Widowed12.4% DivorcedFemales 20.8% Never married48.8% Now married5.3% Separated10.6% Widowed14.5% DivorcedWomen who gave birth in the past 12 months Now married:
97.6% (158)Unmarried:
2.4% (4)
Women who did not give birth in the past 12 months Now married:
50.6% (1,418)Unmarried:
49.4% (1,384)
Marital status - Hispanic or Latino population 15 years and over
Males 31.7% Never married51.8% Now married6.6% Separated0.0% Widowed9.8% DivorcedFemales 42.9% Never married36.6% Now married4.1% Separated0.0% Widowed16.4% DivorcedWomen who did not give birth in the past 12 months Now married:
38.9% (416)Unmarried:
61.1% (653)
Ancestries in Shelbyville
1,406 14.7% American1,074 11.2% English789 8.3% Irish526 5.5% German377 3.9% Scottish337 3.5% Scotch-Irish205 2.1% Senegalese201 2.1% Italian165 1.7% European147 1.5% British37 0.4% French36 0.4% Ethiopian32 0.3% Polish29 0.3% Dutch16 0.2% Scandinavian15 0.2% Swedish10 0.1% Welsh9 0.09% Hungarian6 0.06% Northern European4 0.04% Eastern European
Geographical mobility in Shelbyville Same house 1 year ago 11,015 89.8% White (Caucasian)1,371 91.9% Black or African American18 91.6% American Indian / Alaska Native199 70.2% Asian1,180 92.9% Other race2,314 92.3% Two or more races9,915 88.6% White alone, not Hispanic / Latino3,094 97.2% Hispanic or LatinoMoved within same county 596 4.9% White / Caucasian55 3.7% Black or African American59 4.6% Other race151 6.0% Two or more races605 5.4% White alone, not Hispanic / Latino56 1.8% Hispanic or LatinoMoved within same state 568 4.6% White / Caucasian87 5.8% Black or African American47 16.4% Asian29 1.1% Two or more races573 5.1% White alone, not Hispanic / LatinoMoved from different state 73 0.6% White / Caucasian9 0.6% Black or African American52 18.2% Asian74 0.7% White alone, not Hispanic / LatinoMoved from abroad 7 0.1% White52 4.1% Other race8 0.1% White alone, not Hispanic / Latino49 1.5% Hispanic or Latino
Children Nativity (place of birth) in Shelbyville
Children under 6 years - Living with two parents Both parents native 1,034 100.0% NativeBoth parents foreign-born 110 100.0% NativeOne native, one foreign-born parent 64 100.0% NativeChildren under 6 years - Living with one parent Native parent 180 100.0% NativeForeign-born parent 18 100.0% NativeChildren 6 to 17 years - Living with two parents Both parents native 1,168 100.0% NativeBoth parents foreign-born 245 100.0% NativeOne native, one foreign-born parent 102 59.7% Native69 40.3% Foreign-bornChildren 6 to 17 years - Living with one parent Native parent 653 100.0% NativeForeign-born parent 293 50.1% Native292 49.9% Foreign-born
Grandparents responsible for own grandchildren in Shelbyville
Grandparents (30 to 59 years) White / Caucasian 14 23.9% Responsible for grandchildren43 76.1% Not responsible for grandchildrenWhite alone, not Hispanic / Latino 14 23.7% Responsible for grandchildren44 76.3% Not responsible for grandchildren
Grandparents (60 years and over) White / Caucasian 57 100.0% Not responsible for grandchildrenWhite alone, not Hispanic / Latino 58 100.0% Not responsible for grandchildren