Races in Shoreline, Washington (WA) Detailed Stats
Data:
Races - White alone (%)
Races - White alone (% change since 2000)
Races - Black alone (%)
Races - Black alone (% change since 2000)
Races - American Indian alone (%)
Races - American Indian alone (% change since 2000)
Races - Asian alone (%)
Races - Asian alone (% change since 2000)
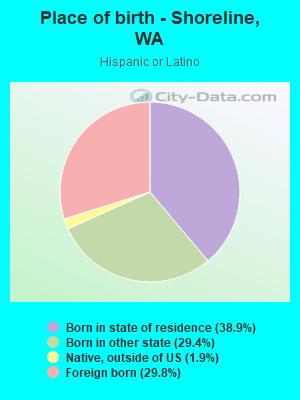
Races - Hispanic (%)
Races - Hispanic (% change since 2000)
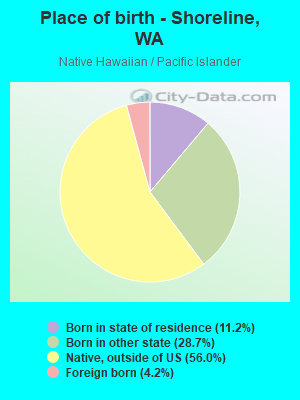
Races - Native Hawaiian and Other Pacific Islander alone (%)
Races - Native Hawaiian and Other Pacific Islander alone (% change since 2000)
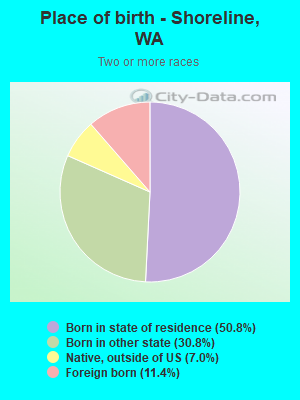
Races - Two or more races(%)
Races - Two or more races(% change since 2000)
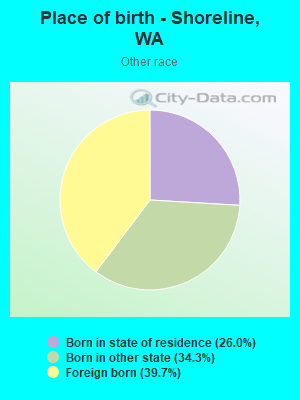
Races - Other race alone (%)
Races - Other race alone (% change since 2000)
Racial diversity
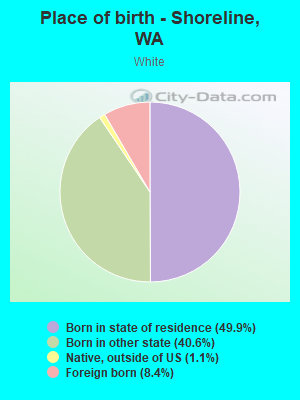
Place of birth - Born in state of residence (%)
Place of birth - Born in state of residence (%) - White
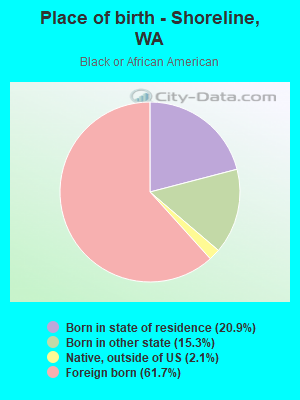
Place of birth - Born in state of residence (%) - Black or African American
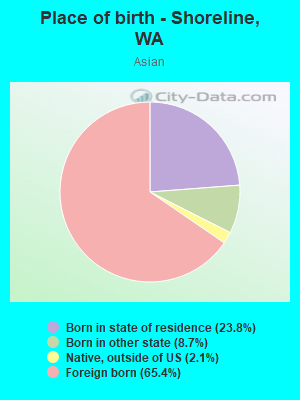
Place of birth - Born in state of residence (%) - Asian
Place of birth - Born in state of residence (%) - Hispanic or Latino
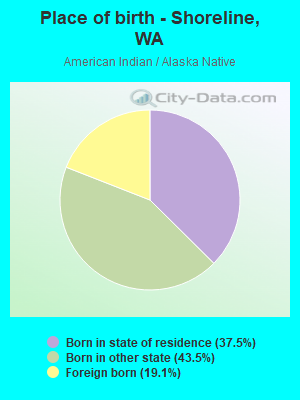
Place of birth - Born in state of residence (%) - American Indian and Alaska Native
Place of birth - Born in state of residence (%) - Multirace
Place of birth - Born in state of residence (%) - Other Race
Place of birth - Born in other state (%)
Place of birth - Born in other state (%) - White
Place of birth - Born in other state (%) - Black or African American
Place of birth - Born in other state (%) - Asian
Place of birth - Born in other state (%) - Hispanic or Latino
Place of birth - Born in other state (%) - American Indian and Alaska Native
Place of birth - Born in other state (%) - Multirace
Place of birth - Born in other state (%) - Other Race
Place of birth - Native, outside of US (%)
Place of birth - Native, outside of US (%) - White
Place of birth - Native, outside of US (%) - Black or African American
Place of birth - Native, outside of US (%) - Asian
Place of birth - Native, outside of US (%) - Hispanic or Latino
Place of birth - Native, outside of US (%) - American Indian and Alaska Native
Place of birth - Native, outside of US (%) - Multirace
Place of birth - Native, outside of US (%) - Other Race
Place of birth - Foreign born (%)
Place of birth - Foreign born (%) - White
Place of birth - Foreign born (%) - Black or African American
Place of birth - Foreign born (%) - Asian
Place of birth - Foreign born (%) - Hispanic or Latino
Place of birth - Foreign born (%) - American Indian and Alaska Native
Place of birth - Foreign born (%) - Multirace
Place of birth - Foreign born (%) - Other Race
Residents speaking English at home (%)
Residents speaking English at home - Born in the United States (%)
Residents speaking English at home - Native, born elsewhere (%)
Residents speaking English at home - Foreign born (%)
Residents speaking Spanish at home (%)
Residents speaking Spanish at home - Born in the United States (%)
Residents speaking Spanish at home - Native, born elsewhere (%)
Residents speaking Spanish at home - Foreign born (%)
Residents speaking other language at home (%)
Residents speaking other language at home - Born in the United States (%)
Residents speaking other language at home - Native, born elsewhere (%)
Residents speaking other language at home - Foreign born (%)
Marital status - Never married (%)
Marital status - Now married (%)
Marital status - Separated (%)
Marital status - Widowed (%)
Marital status - Divorced (%)
Ancestries Reported - Arab (%)
Ancestries Reported - Czech (%)
Ancestries Reported - Danish (%)
Ancestries Reported - Dutch (%)
Ancestries Reported - English (%)
Ancestries Reported - French (%)
Ancestries Reported - French Canadian (%)
Ancestries Reported - German (%)
Ancestries Reported - Greek (%)
Ancestries Reported - Hungarian (%)
Ancestries Reported - Irish (%)
Ancestries Reported - Italian (%)
Ancestries Reported - Lithuanian (%)
Ancestries Reported - Norwegian (%)
Ancestries Reported - Polish (%)
Ancestries Reported - Portuguese (%)
Ancestries Reported - Russian (%)
Ancestries Reported - Scotch-Irish (%)
Ancestries Reported - Scottish (%)
Ancestries Reported - Slovak (%)
Ancestries Reported - Subsaharan African (%)
Ancestries Reported - Swedish (%)
Ancestries Reported - Swiss (%)
Ancestries Reported - Ukrainian (%)
Ancestries Reported - United States (%)
Ancestries Reported - Welsh (%)
Ancestries Reported - West Indian (%)
Ancestries Reported - Other (%)
Geographical mobility - Same house 1 year ago (%)
Geographical mobility - Same house 1 year ago (%) - White
Geographical mobility - Same house 1 year ago (%) - Black or African American
Geographical mobility - Same house 1 year ago (%) - Asian
Geographical mobility - Same house 1 year ago (%) - Hispanic or Latino
Geographical mobility - Same house 1 year ago (%) - American Indian and Alaska Native
Geographical mobility - Same house 1 year ago (%) - Multirace
Geographical mobility - Same house 1 year ago (%) - Other Race
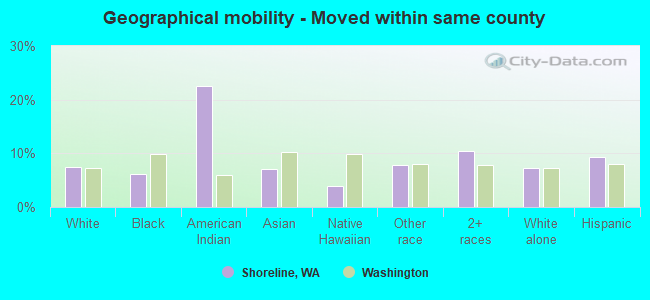
Geographical mobility - Moved within same county (%)
Geographical mobility - Moved within same county (%) - White
Geographical mobility - Moved within same county (%) - Black or African American
Geographical mobility - Moved within same county (%) - Asian
Geographical mobility - Moved within same county (%) - Hispanic or Latino
Geographical mobility - Moved within same county (%) - American Indian and Alaska Native
Geographical mobility - Moved within same county (%) - Multirace
Geographical mobility - Moved within same county (%) - Other Race
Geographical mobility - Moved from different county within same state (%)
Geographical mobility - Moved from different county within same state (%) - White
Geographical mobility - Moved from different county within same state (%) - Black or African American
Geographical mobility - Moved from different county within same state (%) - Asian
Geographical mobility - Moved from different county within same state (%) - Hispanic or Latino
Geographical mobility - Moved from different county within same state (%) - American Indian and Alaska Native
Geographical mobility - Moved from different county within same state (%) - Multirace
Geographical mobility - Moved from different county within same state (%) - Other Race
Geographical mobility - Moved from different state (%)
Geographical mobility - Moved from different state (%) - White
Geographical mobility - Moved from different state (%) - Black or African American
Geographical mobility - Moved from different state (%) - Asian
Geographical mobility - Moved from different state (%) - Hispanic or Latino
Geographical mobility - Moved from different state (%) - American Indian and Alaska Native
Geographical mobility - Moved from different state (%) - Multirace
Geographical mobility - Moved from different state (%) - Other Race
Geographical mobility - Moved from abroad (%)
Geographical mobility - Moved from abroad (%) - White
Geographical mobility - Moved from abroad (%) - Black or African American
Geographical mobility - Moved from abroad (%) - Asian
Geographical mobility - Moved from abroad (%) - Hispanic or Latino
Geographical mobility - Moved from abroad (%) - American Indian and Alaska Native
Geographical mobility - Moved from abroad (%) - Multirace
Geographical mobility - Moved from abroad (%) - Other Race
Place of birth for the foreign-born population - Ireland (%)
Place of birth for the foreign-born population - Denmark (%)
Place of birth for the foreign-born population - Norway (%)
Place of birth for the foreign-born population - Sweden (%)
Place of birth for the foreign-born population - United Kingdom (%)
Place of birth for the foreign-born population - England (%)
Place of birth for the foreign-born population - Scotland (%)
Place of birth for the foreign-born population - Other Northern Europe (%)
Place of birth for the foreign-born population - Austria (%)
Place of birth for the foreign-born population - Belgium (%)
Place of birth for the foreign-born population - France (%)
Place of birth for the foreign-born population - Germany (%)
Place of birth for the foreign-born population - Netherlands (%)
Place of birth for the foreign-born population - Switzerland (%)
Place of birth for the foreign-born population - Other Western Europe (%)
Place of birth for the foreign-born population - Greece (%)
Place of birth for the foreign-born population - Italy (%)
Place of birth for the foreign-born population - Portugal (%)
Place of birth for the foreign-born population - Spain (%)
Place of birth for the foreign-born population - Other Southern Europe (%)
Place of birth for the foreign-born population - Albania (%)
Place of birth for the foreign-born population - Belarus (%)
Place of birth for the foreign-born population - Bosnia and Herzegovina (%)
Place of birth for the foreign-born population - Bulgaria (%)
Place of birth for the foreign-born population - Croatia (%)
Place of birth for the foreign-born population - Czechoslovakia (%)
Place of birth for the foreign-born population - Hungary (%)
Place of birth for the foreign-born population - Latvia (%)
Place of birth for the foreign-born population - Lithuania (%)
Place of birth for the foreign-born population - North Macedonia (Macedonia) (%)
Place of birth for the foreign-born population - Moldova (%)
Place of birth for the foreign-born population - Poland (%)
Place of birth for the foreign-born population - Romania (%)
Place of birth for the foreign-born population - Russia (%)
Place of birth for the foreign-born population - Serbia (%)
Place of birth for the foreign-born population - Ukraine (%)
Place of birth for the foreign-born population - Other Eastern Europe (%)
Place of birth for the foreign-born population - China (%)
Place of birth for the foreign-born population - Hong Kong (%)
Place of birth for the foreign-born population - Taiwan (%)
Place of birth for the foreign-born population - Japan (%)
Place of birth for the foreign-born population - Korea (%)
Place of birth for the foreign-born population - Other Eastern Asia (%)
Place of birth for the foreign-born population - Afghanistan (%)
Place of birth for the foreign-born population - Bangladesh (%)
Place of birth for the foreign-born population - India (%)
Place of birth for the foreign-born population - Iran (%)
Place of birth for the foreign-born population - Kazakhstan (%)
Place of birth for the foreign-born population - Nepal (%)
Place of birth for the foreign-born population - Pakistan (%)
Place of birth for the foreign-born population - Sri Lanka (%)
Place of birth for the foreign-born population - Uzbekistan (%)
Place of birth for the foreign-born population - Other South Central Asia (%)
Place of birth for the foreign-born population - Burma (%)
Place of birth for the foreign-born population - Cambodia (%)
Place of birth for the foreign-born population - Indonesia (%)
Place of birth for the foreign-born population - Laos (%)
Place of birth for the foreign-born population - Malaysia (%)
Place of birth for the foreign-born population - Philippines (%)
Place of birth for the foreign-born population - Singapore (%)
Place of birth for the foreign-born population - Thailand (%)
Place of birth for the foreign-born population - Vietnam (%)
Place of birth for the foreign-born population - Other South Eastern Asia (%)
Place of birth for the foreign-born population - Armenia (%)
Place of birth for the foreign-born population - Iraq (%)
Place of birth for the foreign-born population - Israel (%)
Place of birth for the foreign-born population - Jordan (%)
Place of birth for the foreign-born population - Kuwait (%)
Place of birth for the foreign-born population - Lebanon (%)
Place of birth for the foreign-born population - Saudi Arabia (%)
Place of birth for the foreign-born population - Syria (%)
Place of birth for the foreign-born population - Turkey (%)
Place of birth for the foreign-born population - Yemen (%)
Place of birth for the foreign-born population - Other Western Asia (%)
Place of birth for the foreign-born population - Eritrea (%)
Place of birth for the foreign-born population - Ethiopia (%)
Place of birth for the foreign-born population - Kenya (%)
Place of birth for the foreign-born population - Somalia (%)
Place of birth for the foreign-born population - Uganda (%)
Place of birth for the foreign-born population - Zimbabwe (%)
Place of birth for the foreign-born population - Other Eastern Africa (%)
Place of birth for the foreign-born population - Cameroon (%)
Place of birth for the foreign-born population - Congo (%)
Place of birth for the foreign-born population - Democratic Republic of Congo (Zaire) (%)
Place of birth for the foreign-born population - Other Middle Africa (%)
Place of birth for the foreign-born population - Egypt (%)
Place of birth for the foreign-born population - Morocco (%)
Place of birth for the foreign-born population - Sudan (%)
Place of birth for the foreign-born population - Other Northern Africa (%)
Place of birth for the foreign-born population - South Africa (%)
Place of birth for the foreign-born population - Other Southern Africa (%)
Place of birth for the foreign-born population - Cabo Verde (%)
Place of birth for the foreign-born population - Ghana (%)
Place of birth for the foreign-born population - Liberia (%)
Place of birth for the foreign-born population - Nigeria (%)
Place of birth for the foreign-born population - Senegal (%)
Place of birth for the foreign-born population - Sierra Leone (%)
Place of birth for the foreign-born population - Other Western Africa (%)
Place of birth for the foreign-born population - Australia (%)
Place of birth for the foreign-born population - New Zealand (%)
Place of birth for the foreign-born population - Fiji (%)
Place of birth for the foreign-born population - Micronesia (%)
Place of birth for the foreign-born population - Bahamas (%)
Place of birth for the foreign-born population - Barbados (%)
Place of birth for the foreign-born population - Cuba (%)
Place of birth for the foreign-born population - Dominica (%)
Place of birth for the foreign-born population - Dominican Republic (%)
Place of birth for the foreign-born population - Grenada (%)
Place of birth for the foreign-born population - Haiti (%)
Place of birth for the foreign-born population - Jamaica (%)
Place of birth for the foreign-born population - St. Vincent and the Grenadines (%)
Place of birth for the foreign-born population - Trinidad and Tobago (%)
Place of birth for the foreign-born population - West Indies (%)
Place of birth for the foreign-born population - Other Caribbean (%)
Place of birth for the foreign-born population - Belize (%)
Place of birth for the foreign-born population - Costa Rica (%)
Place of birth for the foreign-born population - El Salvador (%)
Place of birth for the foreign-born population - Guatemala (%)
Place of birth for the foreign-born population - Honduras (%)
Place of birth for the foreign-born population - Mexico (%)
Place of birth for the foreign-born population - Nicaragua (%)
Place of birth for the foreign-born population - Panama (%)
Place of birth for the foreign-born population - Other Central America (%)
Place of birth for the foreign-born population - Argentina (%)
Place of birth for the foreign-born population - Bolivia (%)
Place of birth for the foreign-born population - Brazil (%)
Place of birth for the foreign-born population - Chile (%)
Place of birth for the foreign-born population - Colombia (%)
Place of birth for the foreign-born population - Ecuador (%)
Place of birth for the foreign-born population - Guyana (%)
Place of birth for the foreign-born population - Peru (%)
Place of birth for the foreign-born population - Uruguay (%)
Place of birth for the foreign-born population - Venezuela (%)
Place of birth for the foreign-born population - Other South America (%)
Place of birth for the foreign-born population - Canada (%)
Place of birth for the foreign-born population - Other Northern America (%)
Place of birth for the foreign-born population - Other (%)
Latest news about races in Shoreline, WA collected exclusively by city-data.com from local newspapers, TV, and radio stations
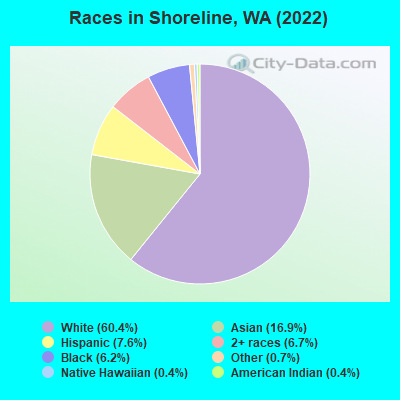
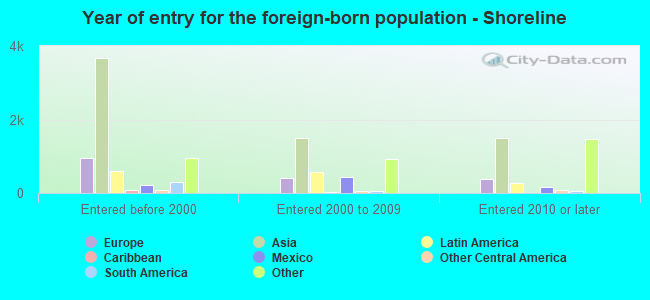
According to 2022 data, the most numerous races in Shoreline, WA are White alone (35,613 residents), Hispanic (4,472 residents), and Asian alone (9,963 residents). 72.0% of Shoreline residents speak English at home. 23.1% of Shoreline, WA residents are foreign-born (11.0% born in Asia, 4.2% born in Africa, 3.3% born in Europe, 2.5% born in Latin America), which is 35.0% greater than the foreign-born rate of 15.0% across the entire state of Washington.
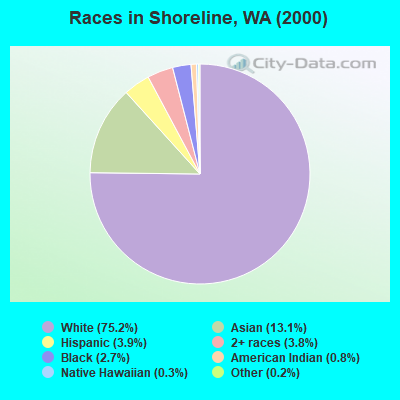
Race distribution in Shoreline
2000 2022
39,878 75.2% White alone 6,960 13.1% Asian alone 2,054 3.9% Hispanic 2,003 3.8% Two or more races 1,435 2.7% Black alone 427 0.8% American Indian alone 166 0.3% Native Hawaiian and Other 102 0.2% Other race alone
35,613 60.4% White alone 9,963 16.9% Asian alone 4,472 7.6% Hispanic 3,927 6.7% Two or more races 3,685 6.2% Black alone 408 0.7% Other race alone 235 0.4% American Indian alone 254 0.4% Native Hawaiian and Other
2000 2022
4,652,490 78.9% White alone 441,509 7.5% Hispanic 319,401 5.4% Asian alone 184,631 3.1% Black alone 175,926 3.0% Two or more races 85,396 1.4% American Indian alone 22,779 0.4% Native Hawaiian and Other 11,989 0.2% Other race alone
4,941,456 63.5% White alone 1,093,313 14.0% Hispanic 755,832 9.7% Asian alone 523,448 6.7% Two or more races 299,537 3.8% Black alone 69,024 0.9% American Indian alone 52,231 0.7% Native Hawaiian and Other 50,945 0.7% Other race alone
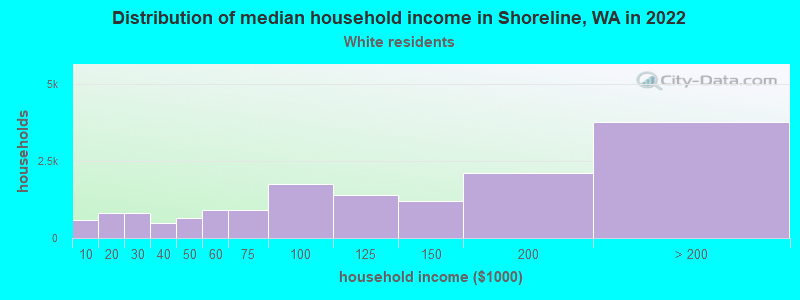
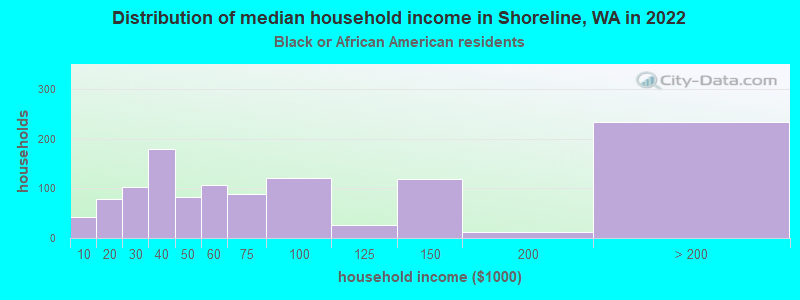
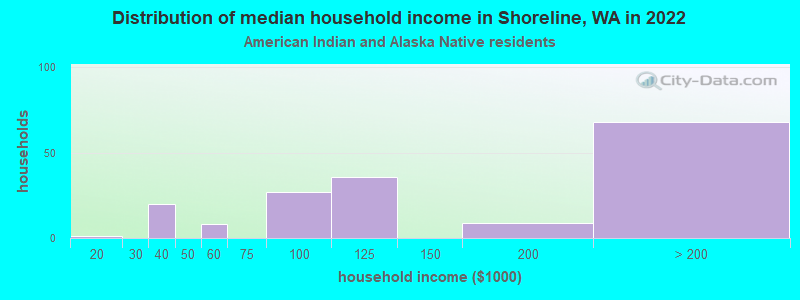
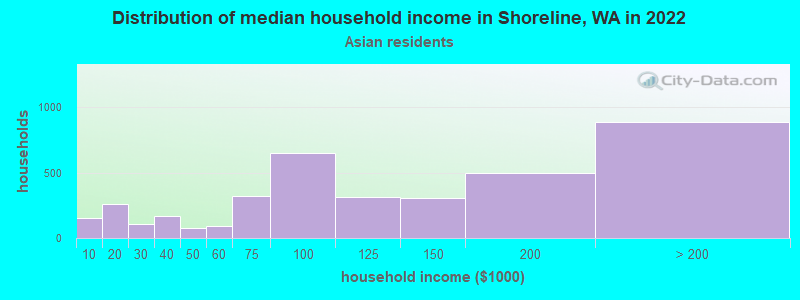
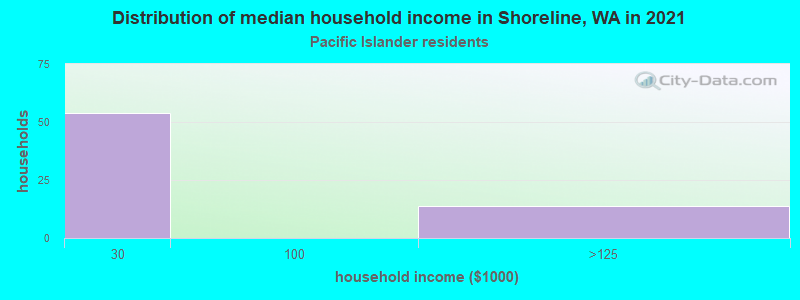
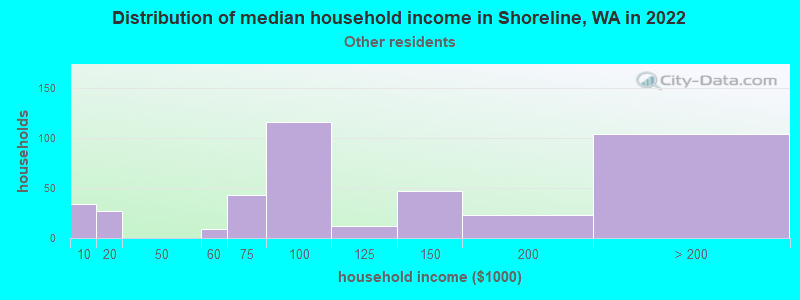
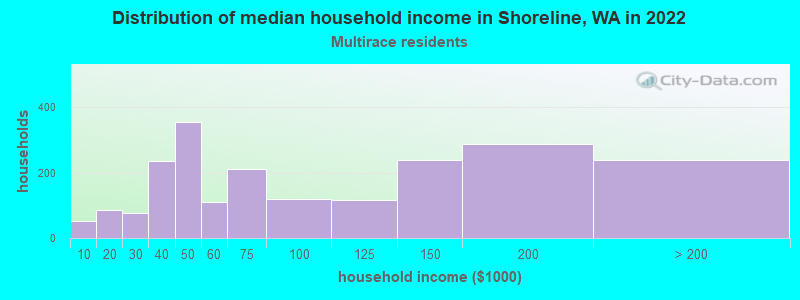
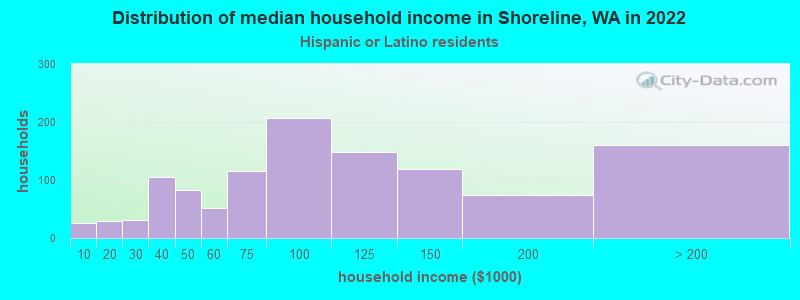
Income and house value in Shoreline Median household income in 2022 $113,245 White non-Hispanic householders$60,364 Black householders$105,725 Asian householders$106,687 Some other race householders$72,660 Two or more races householders$96,325 Hispanic or Latino race householdersMedian 2022 house value $829,293 White Non-Hispanic householders$828,088 Black or African American householders$781,078 American Indian or Alaska Native householders $826,882 Asian householders$630,407 Native Hawaiian and other Pacific Islander householders$750,542 Some other race householders$766,212 Two or more races householders$785,498 Hispanic or Latino householders
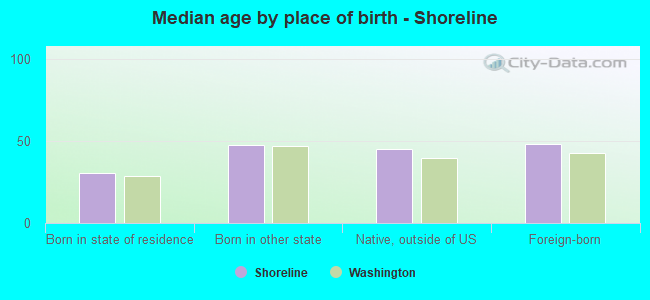
Median age by race in Shoreline
45.8 Median age for White residents44.8 46.3 32.7 Median age for Black or African American residents31.1 39.0 44.5 Median age for American Indian / Alaska Native residents64.5 43.7 42.6 Median age for Asian residents41.7 43.9 31.2 Median age for Native Hawaiian / Pacific Islander residents9.8 -651,945,320.1 32.2 Median age for Other race residents36.4 28.4 30.5 Median age for Two or more races residents33.0 27.3 45.8 Median age for White alone residents45.5 46.3 31.3 Median age for Hispanic or Latino residents32.5 27.8
Owner/renter occupied households by race in Shoreline
House owners and renters - White residents 10,825 69.8% Owner occupied4,680 30.2% Renter occupiedHouse owners and renters - Black or African American residents 410 35.0% Owner occupied760 65.0% Renter occupiedHouse owners and renters - American Indian / Alaska Native residents 67 54.3% Owner occupied56 45.7% Renter occupiedHouse owners and renters - Asian residents 2,870 74.4% Owner occupied989 25.6% Renter occupiedHouse owners and renters - Native Hawaiian / Pacific Islander residents 21 26.3% Owner occupied59 73.7% Renter occupiedHouse owners and renters - Other race residents 75 18.8% Owner occupied322 81.2% Renter occupiedHouse owners and renters - Two or more races residents 1,081 50.9% Owner occupied1,042 49.1% Renter occupiedHouse owners and renters - White alone residents 10,817 70.1% Owner occupied4,624 29.9% Renter occupiedHouse owners and renters - Hispanic or Latino residents 345 29.9% Owner occupied807 70.1% Renter occupied
Language usage in Shoreline
English speakers - Total 72.0% of residents of Shoreline speak English at home.
4.8% of residents speak Spanish at home 1,963 73.1% Speak English very well723 26.9% Speak English less than very well22.8% of residents speak other language at home 8,060 63.1% Speak English very well4,722 36.9% Speak English less than very well
English speakers - Born in the United States 92.7% of residents of Shoreline speak English at home.
3.5% of residents speak Spanish at home 597 90.3% Speak English very well64 9.7% Speak English less than very well3.6% of residents speak other language at home 616 91.8% Speak English very well55 8.2% Speak English less than very well
English speakers - Native, born elsewhere 58.3% of residents of Shoreline speak English at home.
4.8% of residents speak Spanish at home 41 80.4% Speak English very well10 19.6% Speak English less than very well38.1% of residents speak other language at home 308 75.5% Speak English very well100 24.5% Speak English less than very well
English speakers - Foreign-born 16.9% of residents of Shoreline speak English at home.
9.4% of residents speak Spanish at home 680 53.3% Speak English very well596 46.7% Speak English less than very well73.8% of residents speak other language at home 5,716 57.4% Speak English very well4,244 42.6% Speak English less than very well
White (Caucasian) - Speak only English Native:
96.9% (30,319)Foreign-born:
31.4% (951)
White (Caucasian) - Speak another language Native:
3.1% (977)Foreign-born:
68.6% (2,079)
Black or African American - Speak only English Native:
82.0% (989)Foreign-born:
11.8% (254)
Black or African American - Speak another language Native:
17.9% (216)Foreign-born:
87.5% (1,889)
American Indian / Alaska Native - Speak only English Native:
82.8% (267)Foreign-born:
1.1% (1)
American Indian / Alaska Native - Speak another language Native:
16.3% (52)Foreign-born:
100.0% (77)
Asian - Speak only English Native:
54.7% (1,815)Foreign-born:
12.9% (846)
Asian - Speak another language Native:
45.5% (1,508)Foreign-born:
87.1% (5,720)
Native Hawaiian / Pacific Islander - Speak only English Native:
23.2% (42)Foreign-born:
100.0% (11)
Other race - Speak only English Native:
56.9% (650)Foreign-born:
5.8% (45)
Other race - Speak another language Native:
43.8% (500)Foreign-born:
94.1% (728)
Two or more races - Speak only English Native:
81.0% (3,733)Foreign-born:
24.6% (169)
Two or more races - Speak another language Native:
19.5% (897)Foreign-born:
75.1% (515)
White alone - Speak only English Native:
97.0% (29,924)Foreign-born:
30.1% (956)
White alone - Speak another language Native:
2.8% (874)Foreign-born:
70.2% (2,228)
Hispanic or Latino - Speak only English Native:
59.3% (1,733)Foreign-born:
7.4% (97)
Hispanic or Latino - Speak another language Native:
40.4% (1,179)Foreign-born:
92.4% (1,218)
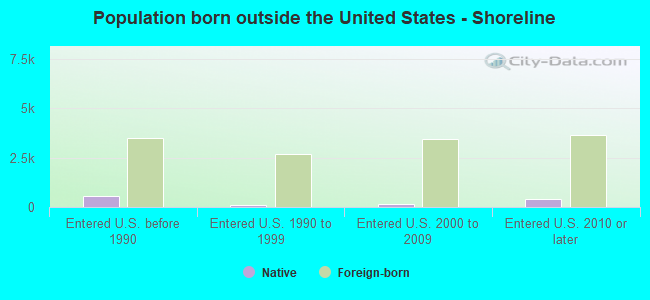
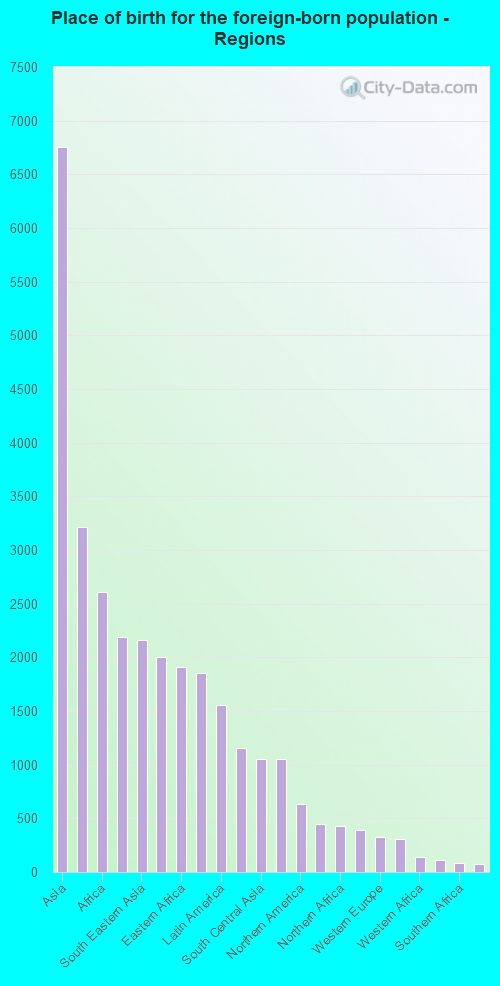
Foreign-born residents in Shoreline 13,614 residents are foreign born (11.0% Asia , 4.2% Africa , 3.3% Europe , 2.5% Latin America ).
This city:
23.1%Washington:
14.9%
Marital status for residents in Shoreline Marital status - White (Caucasian) population 15 years and over
Males 28.1% Never married58.4% Now married0.9% Separated2.8% Widowed9.9% DivorcedFemales 24.7% Never married51.2% Now married1.4% Separated9.1% Widowed13.6% DivorcedWomen who gave birth in the past 12 months Now married:
94.9% (330)Unmarried:
5.1% (18)
Women who did not give birth in the past 12 months Now married:
51.3% (3,816)Unmarried:
48.7% (3,628)
Marital status - Black or African American population 15 years and over
Males 40.0% Never married53.4% Now married2.4% Separated2.8% Widowed1.3% DivorcedFemales 25.7% Never married49.2% Now married0.0% Separated8.5% Widowed16.6% DivorcedWomen who gave birth in the past 12 months Now married:
100.0% (43)Unmarried:
0.0% (0)
Women who did not give birth in the past 12 months Now married:
51.4% (331)Unmarried:
48.6% (313)
Marital status - American Indian / Alaska Native population 15 years and over
Males 16.3% Never married51.3% Now married0.0% Separated7.5% Widowed25.0% DivorcedFemales 53.8% Never married21.5% Now married8.4% Separated8.8% Widowed7.6% DivorcedWomen who gave birth in the past 12 months Now married:
100.0% (23)Unmarried:
0.0% (0)
Women who did not give birth in the past 12 months Now married:
10.6% (19)Unmarried:
89.4% (162)
Marital status - Asian population 15 years and over
Males 33.9% Never married57.8% Now married0.3% Separated1.4% Widowed6.6% DivorcedFemales 27.8% Never married54.8% Now married2.3% Separated6.9% Widowed8.3% DivorcedWomen who gave birth in the past 12 months Now married:
100.0% (183)Unmarried:
0.0% (0)
Women who did not give birth in the past 12 months Now married:
44.6% (1,205)Unmarried:
55.4% (1,499)
Marital status - Native Hawaiian / Pacific Islander population 15 years and over
Males 16.7% Never married47.4% Now married0.0% Separated24.4% Widowed11.5% DivorcedFemales 0.0% Never married100.0% Now married0.0% Separated0.0% Widowed0.0% DivorcedWomen who did not give birth in the past 12 months Now married:
100.0% (61)Unmarried:
0.0% (0)
Marital status - Other race population 15 years and over
Males 41.6% Never married43.8% Now married6.6% Separated0.0% Widowed8.0% DivorcedFemales 44.4% Never married28.5% Now married3.4% Separated2.7% Widowed20.9% DivorcedWomen who gave birth in the past 12 months Now married:
100.0% (4)Unmarried:
0.0% (0)
Women who did not give birth in the past 12 months Now married:
26.7% (139)Unmarried:
73.3% (383)
Marital status - Two or more races population 15 years and over
Males 48.7% Never married39.8% Now married2.1% Separated0.0% Widowed9.4% DivorcedFemales 44.2% Never married41.7% Now married1.3% Separated3.4% Widowed9.4% DivorcedWomen who gave birth in the past 12 months Now married:
0.0% (0)Unmarried:
100.0% (27)
Women who did not give birth in the past 12 months Now married:
44.1% (572)Unmarried:
55.9% (724)
Marital status - White alone, not Hispanic / Latino population 15 years and over
Males 27.3% Never married59.2% Now married0.9% Separated2.9% Widowed9.8% DivorcedFemales 24.5% Never married51.3% Now married1.5% Separated9.4% Widowed13.4% DivorcedWomen who gave birth in the past 12 months Now married:
94.9% (339)Unmarried:
5.1% (18)
Women who did not give birth in the past 12 months Now married:
51.6% (3,784)Unmarried:
48.4% (3,546)
Marital status - Hispanic or Latino population 15 years and over
Males 46.5% Never married42.9% Now married2.4% Separated0.4% Widowed7.8% DivorcedFemales 37.9% Never married38.8% Now married3.7% Separated3.8% Widowed15.8% DivorcedWomen who gave birth in the past 12 months Now married:
100.0% (20)Unmarried:
0.0% (0)
Women who did not give birth in the past 12 months Now married:
40.0% (495)Unmarried:
60.0% (742)
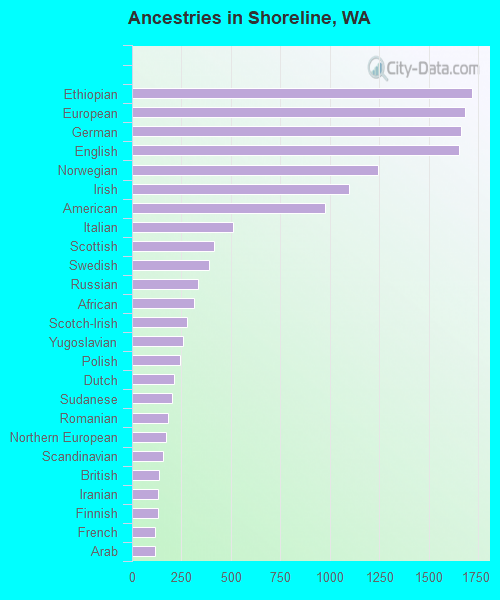
Ancestries in Shoreline
1,719 6.0% Ethiopian1,682 5.9% European1,662 5.8% German1,655 5.8% English1,246 4.3% Norwegian1,097 3.8% Irish974 3.4% American513 1.8% Italian414 1.4% Scottish388 1.4% Swedish334 1.2% Russian313 1.1% African276 1.0% Scotch-Irish256 0.9% Yugoslavian243 0.8% Polish212 0.7% Dutch203 0.7% Sudanese182 0.6% Romanian174 0.6% Northern European156 0.5% Scandinavian138 0.5% British132 0.5% Iranian130 0.5% Finnish118 0.4% French118 0.4% Arab97 0.3% Kenyan86 0.3% Welsh79 0.3% Greek79 0.3% Eastern European78 0.3% Nigerian77 0.3% Egyptian74 0.3% Palestinian66 0.2% Swiss57 0.2% Latvian51 0.2% Danish48 0.2% Ugandan47 0.2% French Canadian42 0.1% Albanian35 0.1% Ghanaian30 0.1% Ukrainian27 0.09% Canadian26 0.09% Hungarian26 0.09% Brazilian22 0.08% Australian17 0.06% Jamaican16 0.06% Portuguese16 0.06% New Zealander14 0.05% Lebanese12 0.04% Somali11 0.04% Macedonian10 0.03% Slovak9 0.03% South African8 0.03% Basque5 0.02% Slavic3 0.01% Lithuanian
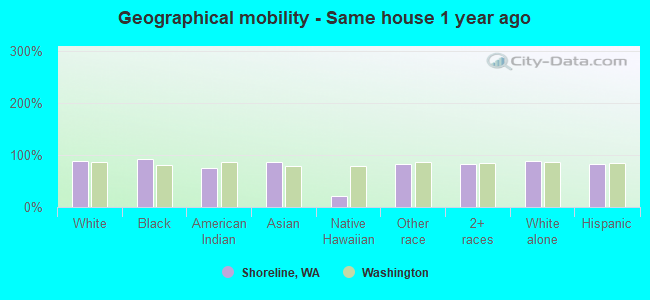
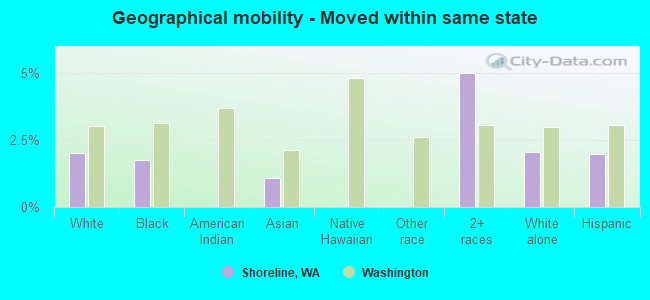
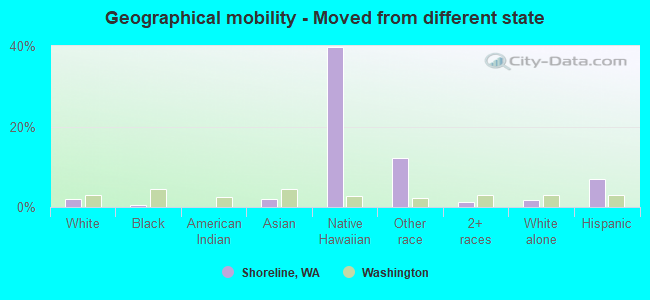
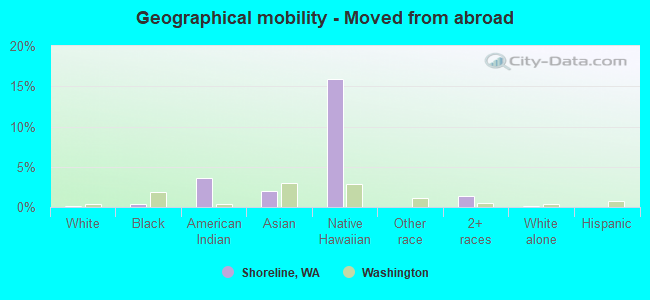
Geographical mobility in Shoreline Same house 1 year ago 31,723 88.9% White (Caucasian)3,347 92.2% Black or African American302 75.8% American Indian / Alaska Native8,699 87.1% Asian51 20.3% Native Hawaiian / Pacific Islander1,658 83.4% Other race4,896 82.8% Two or more races31,622 89.4% White alone, not Hispanic / Latino3,646 82.5% Hispanic or LatinoMoved within same county 2,657 7.4% White / Caucasian222 6.1% Black or African American90 22.5% American Indian / Alaska Native702 7.0% Asian10 3.9% Native Hawaiian / Pacific Islander155 7.8% Other race620 10.5% Two or more races2,549 7.2% White alone, not Hispanic / Latino413 9.4% Hispanic or LatinoMoved within same state 712 2.0% White / Caucasian63 1.7% Black or African American109 1.1% Asian295 5.0% Two or more races724 2.0% White alone, not Hispanic / Latino87 2.0% Hispanic or LatinoMoved from different state 721 2.0% White / Caucasian16 0.4% Black or African American208 2.1% Asian99 39.8% Native Hawaiian / Pacific Islander240 12.1% Other race78 1.3% Two or more races609 1.7% White alone, not Hispanic / Latino302 6.8% Hispanic or LatinoMoved from abroad 25 0.1% White13 0.4% Black or African American14 3.5% American Indian / Alaska Native196 2.0% Asian40 16.0% Native Hawaiian / Pacific Islander82 1.4% Two or more races28 0.1% White alone, not Hispanic / Latino
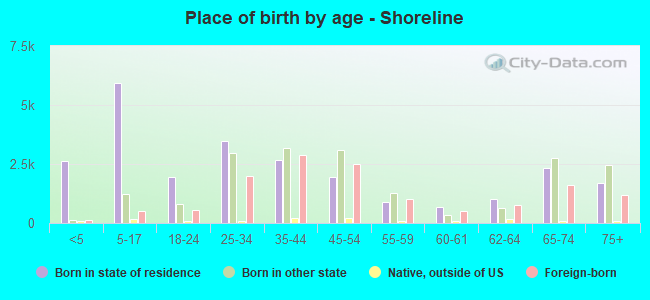
Children Nativity (place of birth) in Shoreline
Children under 6 years - Living with two parents Both parents native 1,927 100.0% NativeBoth parents foreign-born 559 85.6% Native94 14.4% Foreign-bornOne native, one foreign-born parent 328 100.0% NativeChildren under 6 years - Living with one parent Native parent 234 100.0% NativeForeign-born parent 354 100.0% NativeChildren 6 to 17 years - Living with two parents Both parents native 2,670 100.0% Native0 0.0% Foreign-bornBoth parents foreign-born 1,135 73.5% Native410 26.5% Foreign-bornOne native, one foreign-born parent 1,124 100.0% NativeChildren 6 to 17 years - Living with one parent Native parent 1,046 100.0% NativeForeign-born parent 633 53.4% Native553 46.6% Foreign-born
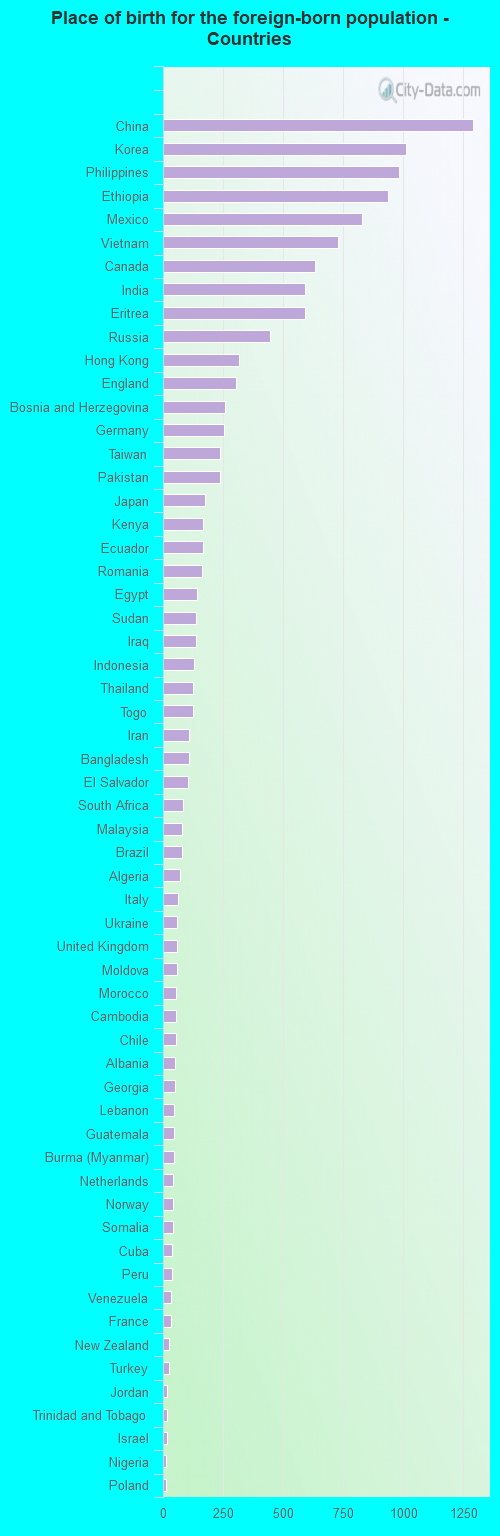
Place of birth for residents in Shoreline 6,759 Asia3,217 Eastern Asia2,611 Africa2,190 Americas2,159 South Eastern Asia2,003 Europe1,906 Eastern Africa1,850 China1,558 Latin America1,151 Eastern Europe1,057 South Central Asia1,055 Central America632 Northern America443 Northern Europe427 Northern Africa387 South America330 Western Europe306 Western Asia140 Western Africa114 Caribbean84 Southern Africa73 Southern Europe48 Oceania26 Australia and New Zealand Subregion1,292 China1,010 Korea980 Philippines935 Ethiopia830 Mexico729 Vietnam632 Canada592 India591 Eritrea445 Russia318 Hong Kong305 England260 Bosnia and Herzegovina253 Germany239 Taiwan236 Pakistan174 Japan166 Kenya165 Ecuador163 Romania143 Egypt137 Sudan136 Iraq130 Indonesia126 Thailand124 Togo110 Iran107 Bangladesh106 El Salvador84 South Africa81 Malaysia80 Brazil71 Algeria63 Italy60 Ukraine58 United Kingdom58 Moldova55 Morocco55 Cambodia54 Chile51 Albania50 Georgia47 Lebanon46 Guatemala45 Burma (Myanmar)42 Netherlands41 Norway41 Somalia37 Cuba36 Peru35 Venezuela33 France26 New Zealand25 Turkey18 Jordan17 Trinidad and Tobago16 Israel14 Nigeria14 Poland11 Saudi Arabia10 Nepal10 Laos10 Panama9 Greece9 Colombia8 Czechoslovakia7 Scotland7 Ireland6 Latvia6 North Macedonia (Macedonia)5 Argentina4 Dominican Republic1 Ghana
Grandparents responsible for own grandchildren in Shoreline
Grandparents (30 to 59 years) White / Caucasian 3 4.7% Responsible for grandchildren53 95.3% Not responsible for grandchildrenAmerican Indian / Alaska Native 15 100.0% Not responsible for grandchildrenAsian 12 100.0% Not responsible for grandchildrenOther race 5 100.0% Not responsible for grandchildrenTwo or more races 25 100.0% Not responsible for grandchildrenWhite alone, not Hispanic / Latino 3 4.2% Responsible for grandchildren58 95.8% Not responsible for grandchildrenHispanic or Latino 39 100.0% Not responsible for grandchildrenGrandparents (60 years and over) White / Caucasian 68 18.6% Responsible for grandchildren299 81.4% Not responsible for grandchildrenAsian 86 31.5% Responsible for grandchildren187 68.5% Not responsible for grandchildrenOther race 47 100.0% Not responsible for grandchildrenWhite alone, not Hispanic / Latino 68 18.7% Responsible for grandchildren296 81.3% Not responsible for grandchildrenHispanic or Latino 67 100.0% Not responsible for grandchildren