Races in Shoreview, Minnesota (MN) Detailed Stats
Data:
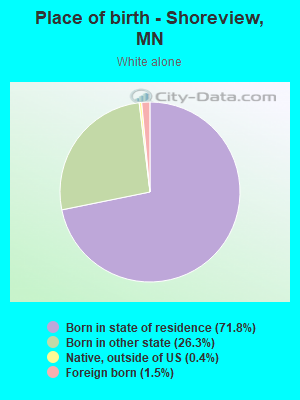
Races - White alone (%)
Races - White alone (% change since 2000)
Races - Black alone (%)
Races - Black alone (% change since 2000)
Races - American Indian alone (%)
Races - American Indian alone (% change since 2000)
Races - Asian alone (%)
Races - Asian alone (% change since 2000)
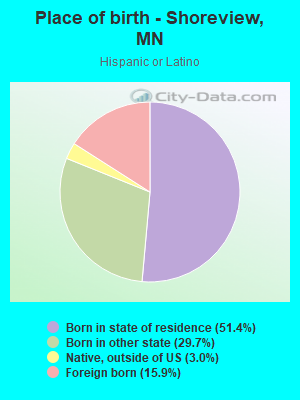
Races - Hispanic (%)
Races - Hispanic (% change since 2000)
Races - Native Hawaiian and Other Pacific Islander alone (%)
Races - Native Hawaiian and Other Pacific Islander alone (% change since 2000)
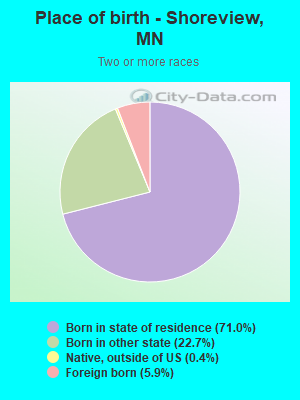
Races - Two or more races(%)
Races - Two or more races(% change since 2000)
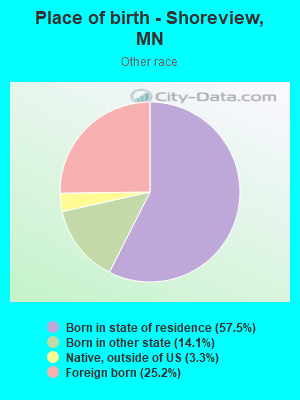
Races - Other race alone (%)
Races - Other race alone (% change since 2000)
Racial diversity
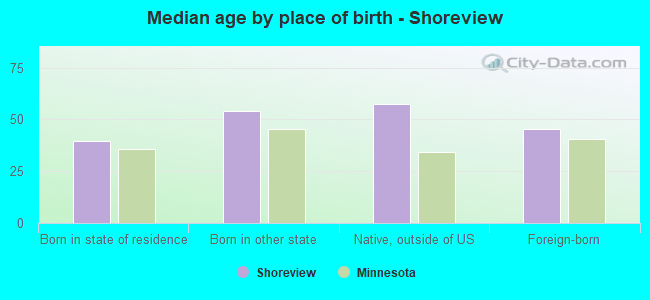
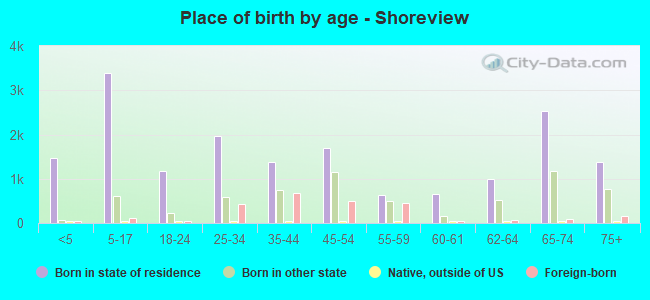
Place of birth - Born in state of residence (%)
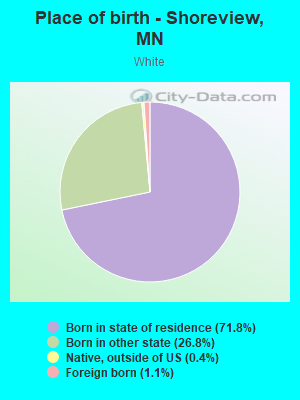
Place of birth - Born in state of residence (%) - White
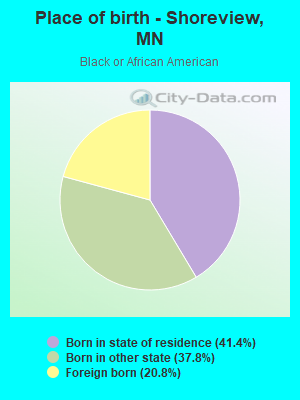
Place of birth - Born in state of residence (%) - Black or African American
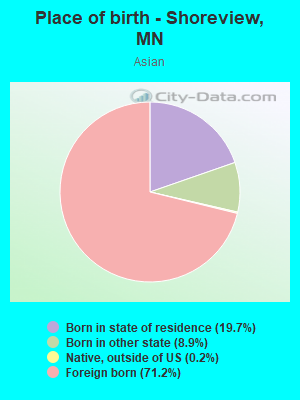
Place of birth - Born in state of residence (%) - Asian
Place of birth - Born in state of residence (%) - Hispanic or Latino
Place of birth - Born in state of residence (%) - American Indian and Alaska Native
Place of birth - Born in state of residence (%) - Multirace
Place of birth - Born in state of residence (%) - Other Race
Place of birth - Born in other state (%)
Place of birth - Born in other state (%) - White
Place of birth - Born in other state (%) - Black or African American
Place of birth - Born in other state (%) - Asian
Place of birth - Born in other state (%) - Hispanic or Latino
Place of birth - Born in other state (%) - American Indian and Alaska Native
Place of birth - Born in other state (%) - Multirace
Place of birth - Born in other state (%) - Other Race
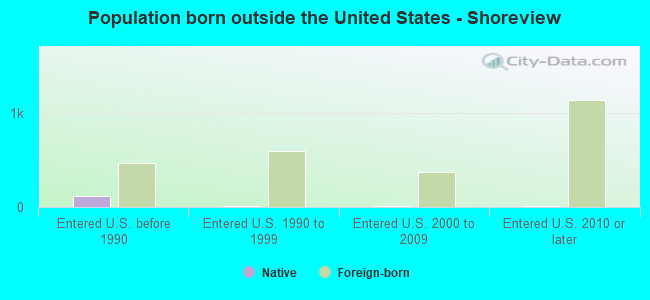
Place of birth - Native, outside of US (%)
Place of birth - Native, outside of US (%) - White
Place of birth - Native, outside of US (%) - Black or African American
Place of birth - Native, outside of US (%) - Asian
Place of birth - Native, outside of US (%) - Hispanic or Latino
Place of birth - Native, outside of US (%) - American Indian and Alaska Native
Place of birth - Native, outside of US (%) - Multirace
Place of birth - Native, outside of US (%) - Other Race
Place of birth - Foreign born (%)
Place of birth - Foreign born (%) - White
Place of birth - Foreign born (%) - Black or African American
Place of birth - Foreign born (%) - Asian
Place of birth - Foreign born (%) - Hispanic or Latino
Place of birth - Foreign born (%) - American Indian and Alaska Native
Place of birth - Foreign born (%) - Multirace
Place of birth - Foreign born (%) - Other Race
Residents speaking English at home (%)
Residents speaking English at home - Born in the United States (%)
Residents speaking English at home - Native, born elsewhere (%)
Residents speaking English at home - Foreign born (%)
Residents speaking Spanish at home (%)
Residents speaking Spanish at home - Born in the United States (%)
Residents speaking Spanish at home - Native, born elsewhere (%)
Residents speaking Spanish at home - Foreign born (%)
Residents speaking other language at home (%)
Residents speaking other language at home - Born in the United States (%)
Residents speaking other language at home - Native, born elsewhere (%)
Residents speaking other language at home - Foreign born (%)
Marital status - Never married (%)
Marital status - Now married (%)
Marital status - Separated (%)
Marital status - Widowed (%)
Marital status - Divorced (%)
Ancestries Reported - Arab (%)
Ancestries Reported - Czech (%)
Ancestries Reported - Danish (%)
Ancestries Reported - Dutch (%)
Ancestries Reported - English (%)
Ancestries Reported - French (%)
Ancestries Reported - French Canadian (%)
Ancestries Reported - German (%)
Ancestries Reported - Greek (%)
Ancestries Reported - Hungarian (%)
Ancestries Reported - Irish (%)
Ancestries Reported - Italian (%)
Ancestries Reported - Lithuanian (%)
Ancestries Reported - Norwegian (%)
Ancestries Reported - Polish (%)
Ancestries Reported - Portuguese (%)
Ancestries Reported - Russian (%)
Ancestries Reported - Scotch-Irish (%)
Ancestries Reported - Scottish (%)
Ancestries Reported - Slovak (%)
Ancestries Reported - Subsaharan African (%)
Ancestries Reported - Swedish (%)
Ancestries Reported - Swiss (%)
Ancestries Reported - Ukrainian (%)
Ancestries Reported - United States (%)
Ancestries Reported - Welsh (%)
Ancestries Reported - West Indian (%)
Ancestries Reported - Other (%)
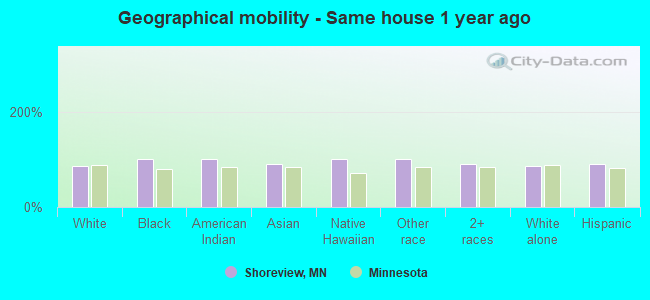
Geographical mobility - Same house 1 year ago (%)
Geographical mobility - Same house 1 year ago (%) - White
Geographical mobility - Same house 1 year ago (%) - Black or African American
Geographical mobility - Same house 1 year ago (%) - Asian
Geographical mobility - Same house 1 year ago (%) - Hispanic or Latino
Geographical mobility - Same house 1 year ago (%) - American Indian and Alaska Native
Geographical mobility - Same house 1 year ago (%) - Multirace
Geographical mobility - Same house 1 year ago (%) - Other Race
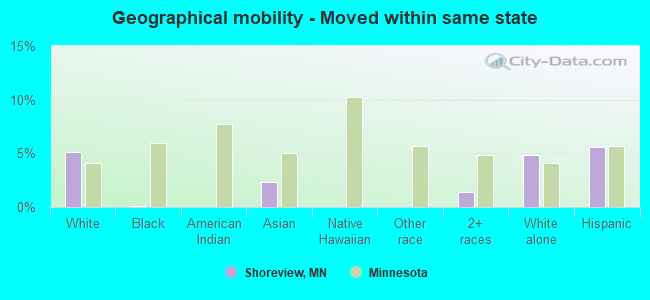
Geographical mobility - Moved within same county (%)
Geographical mobility - Moved within same county (%) - White
Geographical mobility - Moved within same county (%) - Black or African American
Geographical mobility - Moved within same county (%) - Asian
Geographical mobility - Moved within same county (%) - Hispanic or Latino
Geographical mobility - Moved within same county (%) - American Indian and Alaska Native
Geographical mobility - Moved within same county (%) - Multirace
Geographical mobility - Moved within same county (%) - Other Race
Geographical mobility - Moved from different county within same state (%)
Geographical mobility - Moved from different county within same state (%) - White
Geographical mobility - Moved from different county within same state (%) - Black or African American
Geographical mobility - Moved from different county within same state (%) - Asian
Geographical mobility - Moved from different county within same state (%) - Hispanic or Latino
Geographical mobility - Moved from different county within same state (%) - American Indian and Alaska Native
Geographical mobility - Moved from different county within same state (%) - Multirace
Geographical mobility - Moved from different county within same state (%) - Other Race
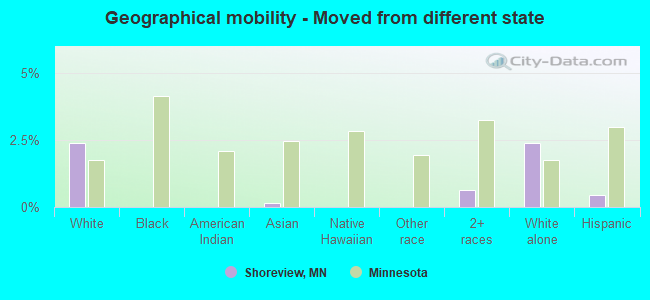
Geographical mobility - Moved from different state (%)
Geographical mobility - Moved from different state (%) - White
Geographical mobility - Moved from different state (%) - Black or African American
Geographical mobility - Moved from different state (%) - Asian
Geographical mobility - Moved from different state (%) - Hispanic or Latino
Geographical mobility - Moved from different state (%) - American Indian and Alaska Native
Geographical mobility - Moved from different state (%) - Multirace
Geographical mobility - Moved from different state (%) - Other Race
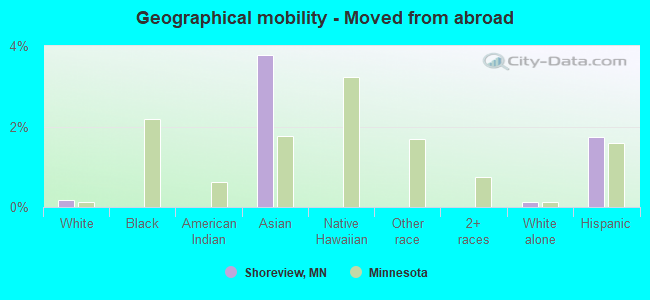
Geographical mobility - Moved from abroad (%)
Geographical mobility - Moved from abroad (%) - White
Geographical mobility - Moved from abroad (%) - Black or African American
Geographical mobility - Moved from abroad (%) - Asian
Geographical mobility - Moved from abroad (%) - Hispanic or Latino
Geographical mobility - Moved from abroad (%) - American Indian and Alaska Native
Geographical mobility - Moved from abroad (%) - Multirace
Geographical mobility - Moved from abroad (%) - Other Race
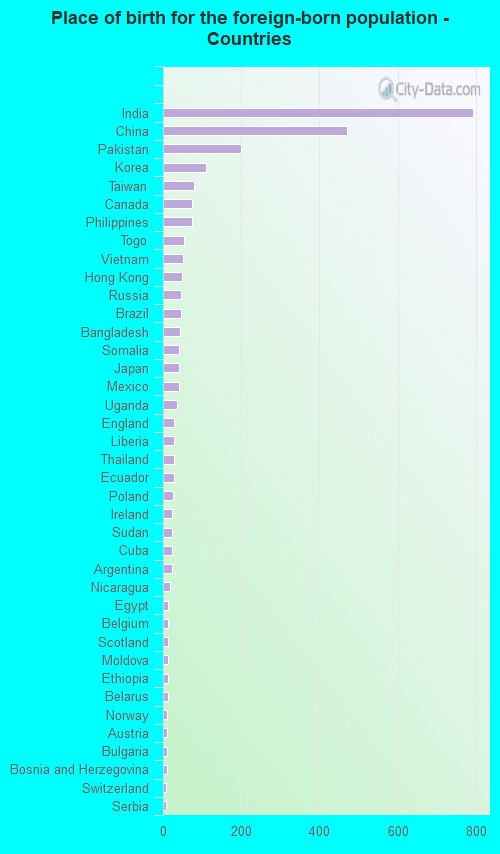
Place of birth for the foreign-born population - Ireland (%)
Place of birth for the foreign-born population - Denmark (%)
Place of birth for the foreign-born population - Norway (%)
Place of birth for the foreign-born population - Sweden (%)
Place of birth for the foreign-born population - United Kingdom (%)
Place of birth for the foreign-born population - England (%)
Place of birth for the foreign-born population - Scotland (%)
Place of birth for the foreign-born population - Other Northern Europe (%)
Place of birth for the foreign-born population - Austria (%)
Place of birth for the foreign-born population - Belgium (%)
Place of birth for the foreign-born population - France (%)
Place of birth for the foreign-born population - Germany (%)
Place of birth for the foreign-born population - Netherlands (%)
Place of birth for the foreign-born population - Switzerland (%)
Place of birth for the foreign-born population - Other Western Europe (%)
Place of birth for the foreign-born population - Greece (%)
Place of birth for the foreign-born population - Italy (%)
Place of birth for the foreign-born population - Portugal (%)
Place of birth for the foreign-born population - Spain (%)
Place of birth for the foreign-born population - Other Southern Europe (%)
Place of birth for the foreign-born population - Albania (%)
Place of birth for the foreign-born population - Belarus (%)
Place of birth for the foreign-born population - Bosnia and Herzegovina (%)
Place of birth for the foreign-born population - Bulgaria (%)
Place of birth for the foreign-born population - Croatia (%)
Place of birth for the foreign-born population - Czechoslovakia (%)
Place of birth for the foreign-born population - Hungary (%)
Place of birth for the foreign-born population - Latvia (%)
Place of birth for the foreign-born population - Lithuania (%)
Place of birth for the foreign-born population - North Macedonia (Macedonia) (%)
Place of birth for the foreign-born population - Moldova (%)
Place of birth for the foreign-born population - Poland (%)
Place of birth for the foreign-born population - Romania (%)
Place of birth for the foreign-born population - Russia (%)
Place of birth for the foreign-born population - Serbia (%)
Place of birth for the foreign-born population - Ukraine (%)
Place of birth for the foreign-born population - Other Eastern Europe (%)
Place of birth for the foreign-born population - China (%)
Place of birth for the foreign-born population - Hong Kong (%)
Place of birth for the foreign-born population - Taiwan (%)
Place of birth for the foreign-born population - Japan (%)
Place of birth for the foreign-born population - Korea (%)
Place of birth for the foreign-born population - Other Eastern Asia (%)
Place of birth for the foreign-born population - Afghanistan (%)
Place of birth for the foreign-born population - Bangladesh (%)
Place of birth for the foreign-born population - India (%)
Place of birth for the foreign-born population - Iran (%)
Place of birth for the foreign-born population - Kazakhstan (%)
Place of birth for the foreign-born population - Nepal (%)
Place of birth for the foreign-born population - Pakistan (%)
Place of birth for the foreign-born population - Sri Lanka (%)
Place of birth for the foreign-born population - Uzbekistan (%)
Place of birth for the foreign-born population - Other South Central Asia (%)
Place of birth for the foreign-born population - Burma (%)
Place of birth for the foreign-born population - Cambodia (%)
Place of birth for the foreign-born population - Indonesia (%)
Place of birth for the foreign-born population - Laos (%)
Place of birth for the foreign-born population - Malaysia (%)
Place of birth for the foreign-born population - Philippines (%)
Place of birth for the foreign-born population - Singapore (%)
Place of birth for the foreign-born population - Thailand (%)
Place of birth for the foreign-born population - Vietnam (%)
Place of birth for the foreign-born population - Other South Eastern Asia (%)
Place of birth for the foreign-born population - Armenia (%)
Place of birth for the foreign-born population - Iraq (%)
Place of birth for the foreign-born population - Israel (%)
Place of birth for the foreign-born population - Jordan (%)
Place of birth for the foreign-born population - Kuwait (%)
Place of birth for the foreign-born population - Lebanon (%)
Place of birth for the foreign-born population - Saudi Arabia (%)
Place of birth for the foreign-born population - Syria (%)
Place of birth for the foreign-born population - Turkey (%)
Place of birth for the foreign-born population - Yemen (%)
Place of birth for the foreign-born population - Other Western Asia (%)
Place of birth for the foreign-born population - Eritrea (%)
Place of birth for the foreign-born population - Ethiopia (%)
Place of birth for the foreign-born population - Kenya (%)
Place of birth for the foreign-born population - Somalia (%)
Place of birth for the foreign-born population - Uganda (%)
Place of birth for the foreign-born population - Zimbabwe (%)
Place of birth for the foreign-born population - Other Eastern Africa (%)
Place of birth for the foreign-born population - Cameroon (%)
Place of birth for the foreign-born population - Congo (%)
Place of birth for the foreign-born population - Democratic Republic of Congo (Zaire) (%)
Place of birth for the foreign-born population - Other Middle Africa (%)
Place of birth for the foreign-born population - Egypt (%)
Place of birth for the foreign-born population - Morocco (%)
Place of birth for the foreign-born population - Sudan (%)
Place of birth for the foreign-born population - Other Northern Africa (%)
Place of birth for the foreign-born population - South Africa (%)
Place of birth for the foreign-born population - Other Southern Africa (%)
Place of birth for the foreign-born population - Cabo Verde (%)
Place of birth for the foreign-born population - Ghana (%)
Place of birth for the foreign-born population - Liberia (%)
Place of birth for the foreign-born population - Nigeria (%)
Place of birth for the foreign-born population - Senegal (%)
Place of birth for the foreign-born population - Sierra Leone (%)
Place of birth for the foreign-born population - Other Western Africa (%)
Place of birth for the foreign-born population - Australia (%)
Place of birth for the foreign-born population - New Zealand (%)
Place of birth for the foreign-born population - Fiji (%)
Place of birth for the foreign-born population - Micronesia (%)
Place of birth for the foreign-born population - Bahamas (%)
Place of birth for the foreign-born population - Barbados (%)
Place of birth for the foreign-born population - Cuba (%)
Place of birth for the foreign-born population - Dominica (%)
Place of birth for the foreign-born population - Dominican Republic (%)
Place of birth for the foreign-born population - Grenada (%)
Place of birth for the foreign-born population - Haiti (%)
Place of birth for the foreign-born population - Jamaica (%)
Place of birth for the foreign-born population - St. Vincent and the Grenadines (%)
Place of birth for the foreign-born population - Trinidad and Tobago (%)
Place of birth for the foreign-born population - West Indies (%)
Place of birth for the foreign-born population - Other Caribbean (%)
Place of birth for the foreign-born population - Belize (%)
Place of birth for the foreign-born population - Costa Rica (%)
Place of birth for the foreign-born population - El Salvador (%)
Place of birth for the foreign-born population - Guatemala (%)
Place of birth for the foreign-born population - Honduras (%)
Place of birth for the foreign-born population - Mexico (%)
Place of birth for the foreign-born population - Nicaragua (%)
Place of birth for the foreign-born population - Panama (%)
Place of birth for the foreign-born population - Other Central America (%)
Place of birth for the foreign-born population - Argentina (%)
Place of birth for the foreign-born population - Bolivia (%)
Place of birth for the foreign-born population - Brazil (%)
Place of birth for the foreign-born population - Chile (%)
Place of birth for the foreign-born population - Colombia (%)
Place of birth for the foreign-born population - Ecuador (%)
Place of birth for the foreign-born population - Guyana (%)
Place of birth for the foreign-born population - Peru (%)
Place of birth for the foreign-born population - Uruguay (%)
Place of birth for the foreign-born population - Venezuela (%)
Place of birth for the foreign-born population - Other South America (%)
Place of birth for the foreign-born population - Canada (%)
Place of birth for the foreign-born population - Other Northern America (%)
Place of birth for the foreign-born population - Other (%)
Latest news about races in Shoreview, MN collected exclusively by city-data.com from local newspapers, TV, and radio stations
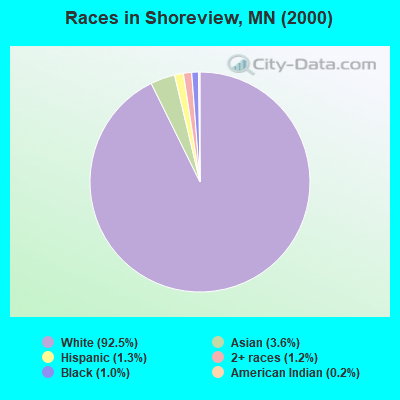
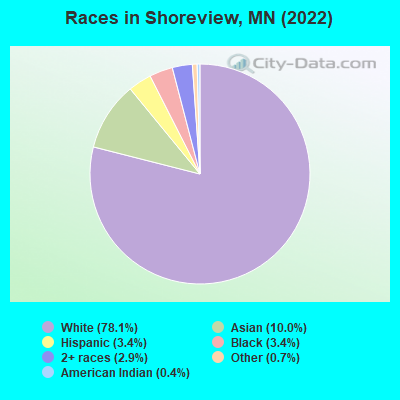
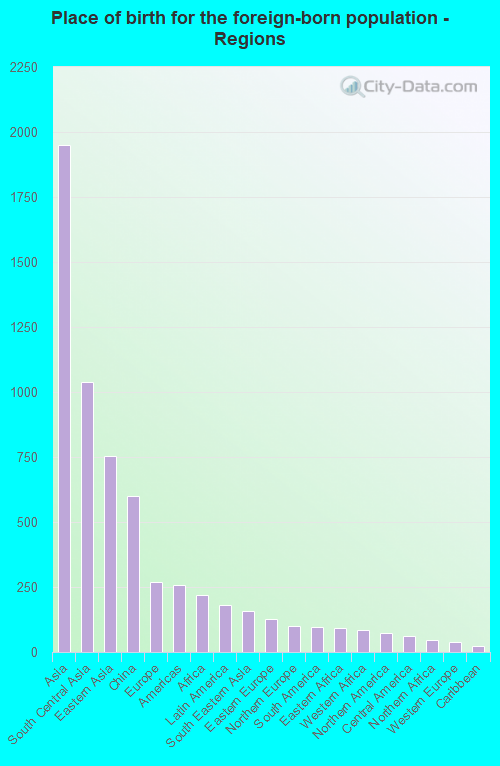
According to 2022 data, the most numerous races in Shoreview, MN are White alone (20,558 residents), Black alone (897 residents), and Hispanic (904 residents). 88.3% of Shoreview residents speak English at home. 10.2% of Shoreview, MN residents are foreign-born (7.0% born in Asia), which is 21.9% greater than the foreign-born rate of 8.0% across the entire state of Minnesota.
Race distribution in Shoreview
2000 2022
4,337,143 88.2% White alone 168,813 3.4% Black alone 143,382 2.9% Hispanic 141,083 2.9% Asian alone 70,304 1.4% Two or more races 52,009 1.1% American Indian alone 5,031 0.1% Other race alone 1,714 0.03% Native Hawaiian and Other
4,356,347 76.2% White alone 395,179 6.9% Black alone 333,830 5.8% Hispanic 294,800 5.2% Asian alone 259,649 4.5% Two or more races 42,125 0.7% American Indian alone 32,976 0.6% Other race alone 2,278 0.04% Native Hawaiian and Other
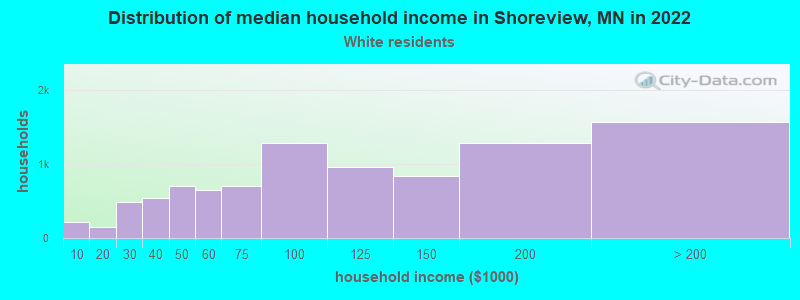
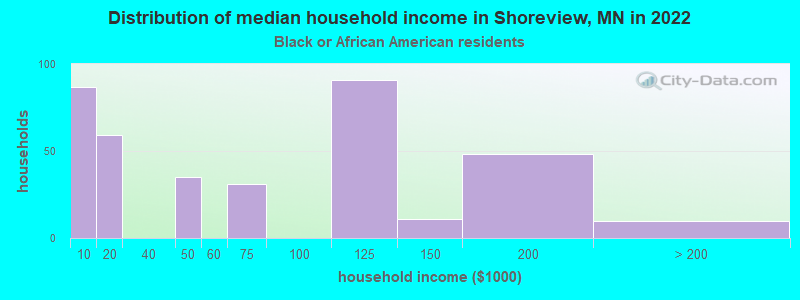
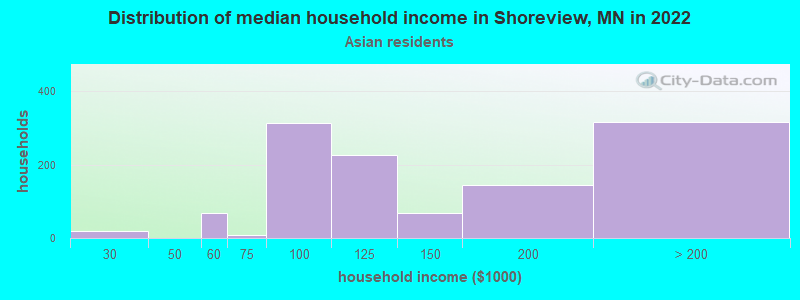
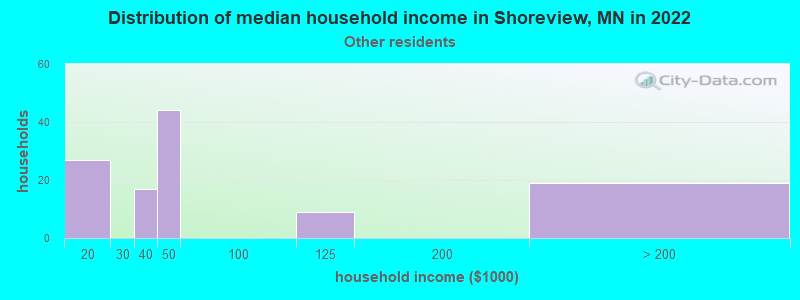
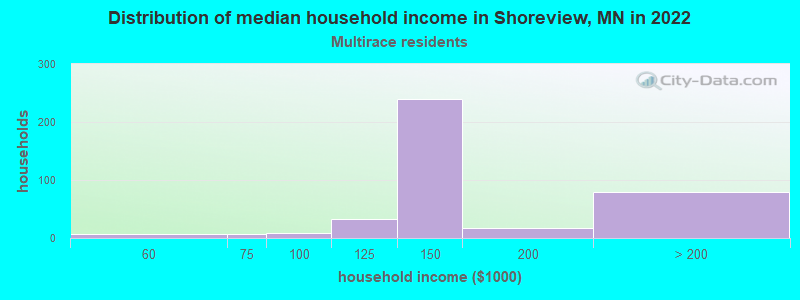
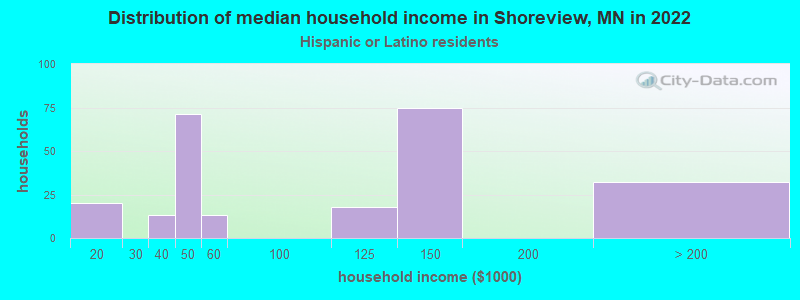
Income and house value in Shoreview Median household income in 2022 $100,569 White non-Hispanic householders$118,827 Asian householders$31,354 Some other race householders$138,046 Two or more races householders$105,349 Hispanic or Latino race householdersMedian 2022 house value $389,392 White Non-Hispanic householders$300,331 Black or African American householders$436,396 American Indian or Alaska Native householders $403,741 Asian householders$244,916 Some other race householders$470,041 Two or more races householders$246,400 Hispanic or Latino householders
Median age by race in Shoreview
49.8 Median age for White residents47.6 52.7 33.3 Median age for Black or African American residents47.3 29.1 26.7 Median age for American Indian / Alaska Native residents-1,081,272,083.7 22.1 38.4 Median age for Asian residents35.9 42.7 -744,336,568.8 Median age for Native Hawaiian / Pacific Islander residents-856,799,036.4 -534,959,349.1 23.2 Median age for Other race residents28.6 6.1 16.1 Median age for Two or more races residents16.3 15.9 49.3 Median age for White alone residents47.4 52.0 13.8 Median age for Hispanic or Latino residents13.7 12.0
Owner/renter occupied households by race in Shoreview
House owners and renters - White residents 8,055 85.2% Owner occupied1,403 14.8% Renter occupiedHouse owners and renters - Black or African American residents 200 55.7% Owner occupied159 44.3% Renter occupiedHouse owners and renters - American Indian / Alaska Native residents 24 100.0% Renter occupiedHouse owners and renters - Asian residents 871 76.6% Owner occupied265 23.4% Renter occupiedHouse owners and renters - Native Hawaiian / Pacific Islander residents 25 100.0% Owner occupiedHouse owners and renters - Other race residents 151 100.0% Owner occupiedHouse owners and renters - Two or more races residents 398 100.0% Owner occupiedHouse owners and renters - White alone residents 8,107 84.9% Owner occupied1,439 15.1% Renter occupiedHouse owners and renters - Hispanic or Latino residents 240 100.0% Owner occupied
Language usage in Shoreview
English speakers - Total 88.3% of residents of Shoreview speak English at home.
1.4% of residents speak Spanish at home 252 73.0% Speak English very well93 27.0% Speak English less than very well10.2% of residents speak other language at home 1,822 72.5% Speak English very well691 27.5% Speak English less than very well
English speakers - Born in the United States 95.6% of residents of Shoreview speak English at home.
1.6% of residents speak Spanish at home 66 62.9% Speak English very well39 37.1% Speak English less than very well2.9% of residents speak other language at home 163 89.6% Speak English very well19 10.4% Speak English less than very well
English speakers - Native, born elsewhere 70.0% of residents of Shoreview speak English at home.
12.7% of residents speak Spanish at home 6 31.6% Speak English very well13 68.4% Speak English less than very well9.3% of residents speak other language at home 14 100.0% Speak English less than very well
English speakers - Foreign-born 14.7% of residents of Shoreview speak English at home.
4.4% of residents speak Spanish at home 70 63.1% Speak English very well41 36.9% Speak English less than very well77.7% of residents speak other language at home 1,385 70.9% Speak English very well569 29.1% Speak English less than very well
White (Caucasian) - Speak only English Native:
99.9% (19,080)Foreign-born:
72.4% (153)
White (Caucasian) - Speak another language Native:
0.9% (175)Foreign-born:
42.2% (89)
Black or African American - Speak only English Native:
96.3% (549)Foreign-born:
26.2% (48)
Black or African American - Speak another language Native:
4.4% (25)Foreign-born:
71.1% (129)
Asian - Speak only English Native:
40.4% (242)Foreign-born:
6.5% (119)
Asian - Speak another language Native:
60.8% (364)Foreign-born:
93.2% (1,706)
Other race - Speak only English Native:
39.2% (109)Foreign-born:
11.6% (17)
Other race - Speak another language Native:
60.5% (168)Foreign-born:
88.4% (131)
Two or more races - Speak only English Native:
93.3% (1,024)Foreign-born:
30.5% (22)
Two or more races - Speak another language Native:
6.4% (70)Foreign-born:
25.9% (19)
White alone - Speak only English Native:
99.0% (19,144)Foreign-born:
56.9% (171)
White alone - Speak another language Native:
1.2% (226)Foreign-born:
44.7% (135)
Hispanic or Latino - Speak only English Native:
72.0% (403)Foreign-born:
18.1% (25)
Hispanic or Latino - Speak another language Native:
26.6% (149)Foreign-born:
82.2% (115)
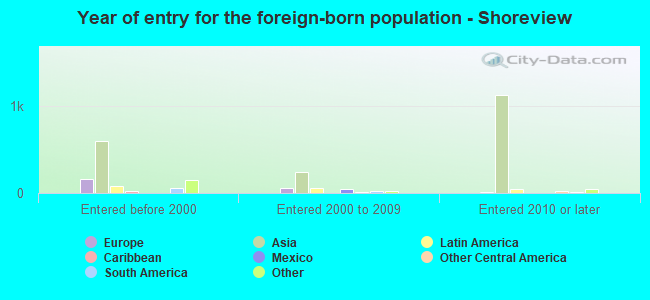
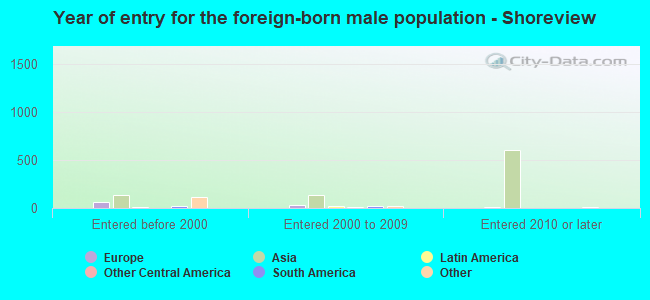
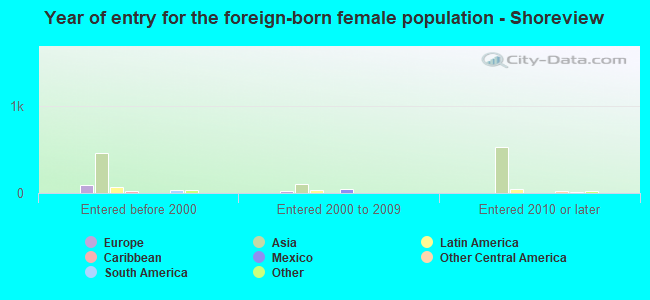
Foreign-born residents in Shoreview 2,695 residents are foreign born (7.0% Asia ).
This city:
10.2%Minnesota:
8.5%
Marital status for residents in Shoreview Marital status - White (Caucasian) population 15 years and over
Males 27.1% Never married60.5% Now married0.7% Separated4.5% Widowed7.2% DivorcedFemales 21.8% Never married57.2% Now married0.2% Separated8.4% Widowed12.4% DivorcedWomen who gave birth in the past 12 months Now married:
97.1% (217)Unmarried:
2.9% (6)
Women who did not give birth in the past 12 months Now married:
51.0% (1,753)Unmarried:
49.0% (1,686)
Marital status - Black or African American population 15 years and over
Males 50.4% Never married31.5% Now married0.0% Separated3.2% Widowed14.9% DivorcedFemales 41.6% Never married40.6% Now married0.0% Separated0.0% Widowed17.8% DivorcedWomen who gave birth in the past 12 months Now married:
24.6% (14)Unmarried:
75.4% (42)
Women who did not give birth in the past 12 months Now married:
53.5% (53)Unmarried:
46.5% (46)
Marital status - American Indian / Alaska Native population 15 years and over
Males 100.0% Never married0.0% Now married0.0% Separated0.0% Widowed0.0% DivorcedFemales 100.0% Never married0.0% Now married0.0% Separated0.0% Widowed0.0% DivorcedWomen who gave birth in the past 12 months Now married:
0.0% (0)Unmarried:
100.0% (33)
Women who did not give birth in the past 12 months Now married:
0.0% (0)Unmarried:
100.0% (56)
Marital status - Asian population 15 years and over
Males 24.2% Never married69.4% Now married0.0% Separated6.3% Widowed0.0% DivorcedFemales 34.3% Never married57.7% Now married0.0% Separated2.8% Widowed5.2% DivorcedWomen who gave birth in the past 12 months Now married:
100.0% (85)Unmarried:
0.0% (0)
Women who did not give birth in the past 12 months Now married:
66.6% (389)Unmarried:
33.4% (195)
Marital status - Other race population 15 years and over
Males 23.9% Never married76.1% Now married0.0% Separated0.0% Widowed0.0% DivorcedFemales 0.0% Never married71.9% Now married0.0% Separated0.0% Widowed28.1% DivorcedWomen who gave birth in the past 12 months Now married:
100.0% (68)Unmarried:
0.0% (0)
Women who did not give birth in the past 12 months Now married:
51.8% (49)Unmarried:
48.2% (46)
Marital status - Two or more races population 15 years and over
Males 39.0% Never married61.0% Now married0.0% Separated0.0% Widowed0.0% DivorcedFemales 52.5% Never married29.7% Now married0.0% Separated0.0% Widowed17.8% DivorcedWomen who did not give birth in the past 12 months Now married:
11.7% (32)Unmarried:
88.3% (237)
Marital status - White alone, not Hispanic / Latino population 15 years and over
Males 27.2% Never married60.4% Now married0.7% Separated4.5% Widowed7.2% DivorcedFemales 21.9% Never married57.0% Now married0.2% Separated8.4% Widowed12.5% DivorcedWomen who gave birth in the past 12 months Now married:
96.8% (203)Unmarried:
3.2% (7)
Women who did not give birth in the past 12 months Now married:
50.8% (1,798)Unmarried:
49.2% (1,739)
Marital status - Hispanic or Latino population 15 years and over
Males 24.6% Never married75.4% Now married0.0% Separated0.0% Widowed0.0% DivorcedFemales 17.6% Never married49.4% Now married0.0% Separated0.0% Widowed33.0% DivorcedWomen who gave birth in the past 12 months Now married:
100.0% (63)Unmarried:
0.0% (0)
Women who did not give birth in the past 12 months Now married:
26.2% (46)Unmarried:
73.8% (130)
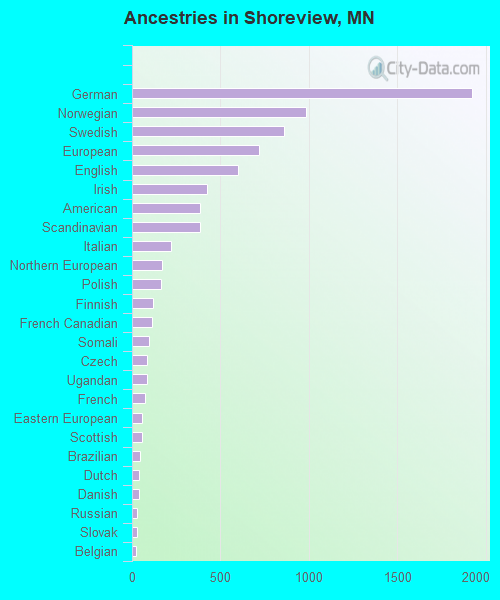
Ancestries in Shoreview
1,921 16.8% German985 8.6% Norwegian859 7.5% Swedish719 6.3% European601 5.3% English424 3.7% Irish387 3.4% American384 3.4% Scandinavian218 1.9% Italian169 1.5% Northern European165 1.4% Polish119 1.0% Finnish113 1.0% French Canadian95 0.8% Somali87 0.8% Czech83 0.7% Ugandan74 0.6% French55 0.5% Eastern European55 0.5% Scottish45 0.4% Brazilian41 0.4% Dutch40 0.4% Danish28 0.2% Russian27 0.2% Slovak25 0.2% Belgian25 0.2% African24 0.2% Ukrainian23 0.2% Hungarian18 0.2% Greek18 0.2% Austrian14 0.1% Egyptian11 0.10% Ethiopian11 0.10% Lithuanian11 0.10% Bulgarian11 0.10% Swiss10 0.09% Croatian8 0.07% Welsh7 0.06% Czechoslovakian6 0.05% Serbian2 0.02% Moroccan
Geographical mobility in Shoreview Same house 1 year ago 17,132 85.5% White (Caucasian)853 99.7% Black or African American146 100.0% American Indian / Alaska Native2,311 89.9% Asian16 100.0% Native Hawaiian / Pacific Islander541 100.0% Other race1,152 91.4% Two or more races17,548 85.8% White alone, not Hispanic / Latino740 89.9% Hispanic or LatinoMoved within same county 1,343 6.7% White / Caucasian23 2.7% Black or African American125 4.9% Asian66 5.2% Two or more races1,390 6.8% White alone, not Hispanic / Latino8 0.9% Hispanic or LatinoMoved within same state 1,017 5.1% White / Caucasian1 0.1% Black or African American59 2.3% Asian18 1.4% Two or more races992 4.8% White alone, not Hispanic / Latino46 5.5% Hispanic or LatinoMoved from different state 477 2.4% White / Caucasian4 0.2% Asian8 0.6% Two or more races490 2.4% White alone, not Hispanic / Latino4 0.4% Hispanic or LatinoMoved from abroad 37 0.2% White97 3.8% Asian27 0.1% White alone, not Hispanic / Latino14 1.7% Hispanic or Latino
Children Nativity (place of birth) in Shoreview
Children under 6 years - Living with two parents Both parents native 999 99.8% Native2 0.2% Foreign-bornBoth parents foreign-born 259 96.9% Native8 3.1% Foreign-bornOne native, one foreign-born parent 251 100.0% NativeChildren under 6 years - Living with one parent Native parent 153 100.0% NativeForeign-born parent 13 100.0% NativeChildren 6 to 17 years - Living with two parents Both parents native 2,354 100.0% NativeBoth parents foreign-born 238 67.6% Native114 32.4% Foreign-bornOne native, one foreign-born parent 373 97.6% Native9 2.4% Foreign-bornChildren 6 to 17 years - Living with one parent Native parent 705 100.0% NativeForeign-born parent 104 48.4% Native111 51.6% Foreign-born
Grandparents responsible for own grandchildren in Shoreview
Grandparents (30 to 59 years) White / Caucasian 14 100.0% Not responsible for grandchildrenWhite alone, not Hispanic / Latino 12 100.0% Not responsible for grandchildrenGrandparents (60 years and over) White / Caucasian 18 25.0% Responsible for grandchildren55 75.0% Not responsible for grandchildrenWhite alone, not Hispanic / Latino 23 28.0% Responsible for grandchildren58 72.0% Not responsible for grandchildren