Races in Short Hills, New Jersey (NJ) Detailed Stats
Data:
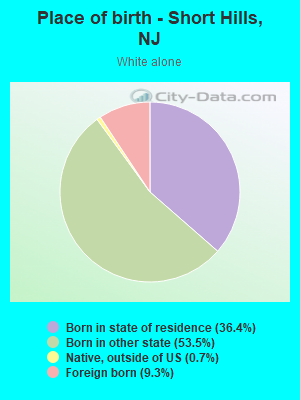
Races - White alone (%)
Races - White alone (% change since 2000)
Races - Black alone (%)
Races - Black alone (% change since 2000)
Races - American Indian alone (%)
Races - American Indian alone (% change since 2000)
Races - Asian alone (%)
Races - Asian alone (% change since 2000)
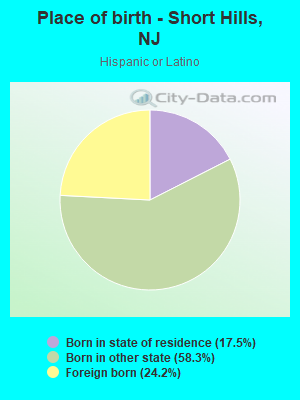
Races - Hispanic (%)
Races - Hispanic (% change since 2000)
Races - Native Hawaiian and Other Pacific Islander alone (%)
Races - Native Hawaiian and Other Pacific Islander alone (% change since 2000)
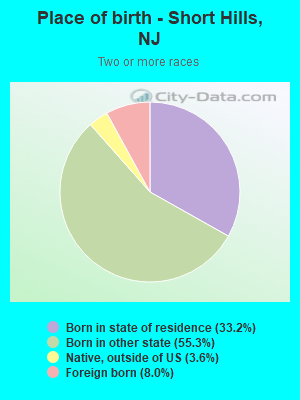
Races - Two or more races(%)
Races - Two or more races(% change since 2000)
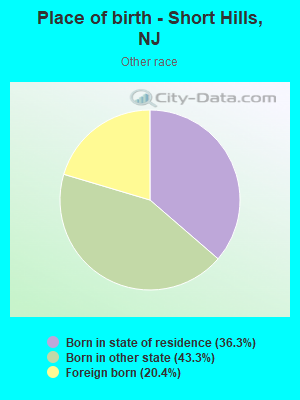
Races - Other race alone (%)
Races - Other race alone (% change since 2000)
Racial diversity
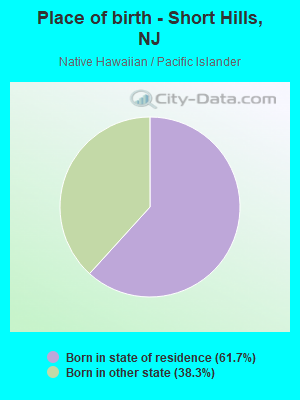
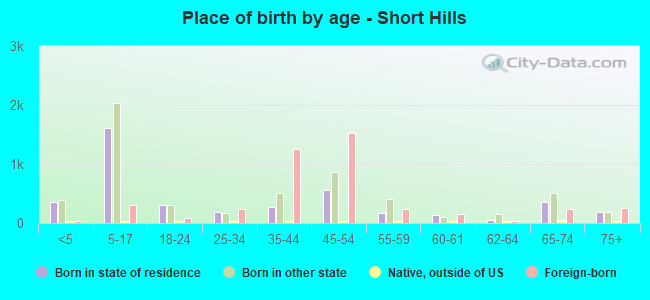
Place of birth - Born in state of residence (%)
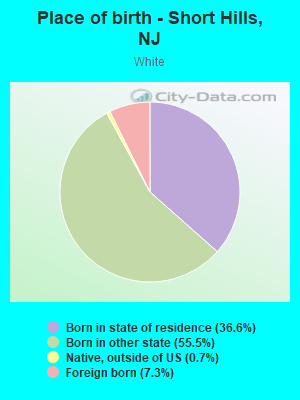
Place of birth - Born in state of residence (%) - White
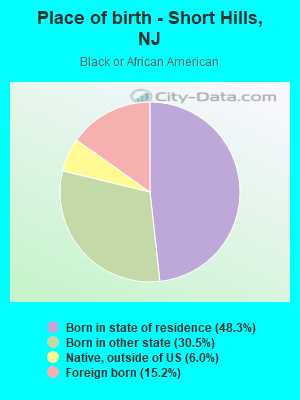
Place of birth - Born in state of residence (%) - Black or African American
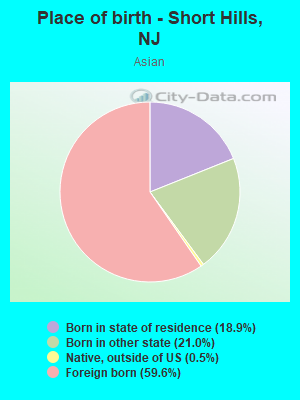
Place of birth - Born in state of residence (%) - Asian
Place of birth - Born in state of residence (%) - Hispanic or Latino
Place of birth - Born in state of residence (%) - American Indian and Alaska Native
Place of birth - Born in state of residence (%) - Multirace
Place of birth - Born in state of residence (%) - Other Race
Place of birth - Born in other state (%)
Place of birth - Born in other state (%) - White
Place of birth - Born in other state (%) - Black or African American
Place of birth - Born in other state (%) - Asian
Place of birth - Born in other state (%) - Hispanic or Latino
Place of birth - Born in other state (%) - American Indian and Alaska Native
Place of birth - Born in other state (%) - Multirace
Place of birth - Born in other state (%) - Other Race
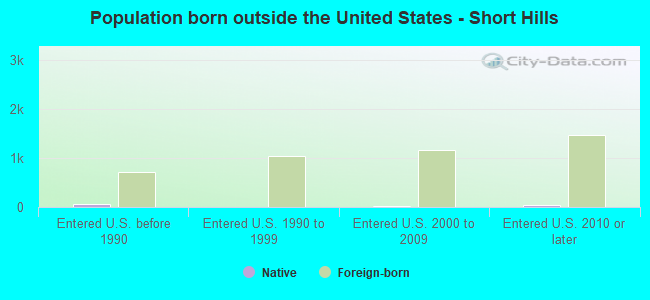
Place of birth - Native, outside of US (%)
Place of birth - Native, outside of US (%) - White
Place of birth - Native, outside of US (%) - Black or African American
Place of birth - Native, outside of US (%) - Asian
Place of birth - Native, outside of US (%) - Hispanic or Latino
Place of birth - Native, outside of US (%) - American Indian and Alaska Native
Place of birth - Native, outside of US (%) - Multirace
Place of birth - Native, outside of US (%) - Other Race
Place of birth - Foreign born (%)
Place of birth - Foreign born (%) - White
Place of birth - Foreign born (%) - Black or African American
Place of birth - Foreign born (%) - Asian
Place of birth - Foreign born (%) - Hispanic or Latino
Place of birth - Foreign born (%) - American Indian and Alaska Native
Place of birth - Foreign born (%) - Multirace
Place of birth - Foreign born (%) - Other Race
Residents speaking English at home (%)
Residents speaking English at home - Born in the United States (%)
Residents speaking English at home - Native, born elsewhere (%)
Residents speaking English at home - Foreign born (%)
Residents speaking Spanish at home (%)
Residents speaking Spanish at home - Born in the United States (%)
Residents speaking Spanish at home - Native, born elsewhere (%)
Residents speaking Spanish at home - Foreign born (%)
Residents speaking other language at home (%)
Residents speaking other language at home - Born in the United States (%)
Residents speaking other language at home - Native, born elsewhere (%)
Residents speaking other language at home - Foreign born (%)
Marital status - Never married (%)
Marital status - Now married (%)
Marital status - Separated (%)
Marital status - Widowed (%)
Marital status - Divorced (%)
Ancestries Reported - Arab (%)
Ancestries Reported - Czech (%)
Ancestries Reported - Danish (%)
Ancestries Reported - Dutch (%)
Ancestries Reported - English (%)
Ancestries Reported - French (%)
Ancestries Reported - French Canadian (%)
Ancestries Reported - German (%)
Ancestries Reported - Greek (%)
Ancestries Reported - Hungarian (%)
Ancestries Reported - Irish (%)
Ancestries Reported - Italian (%)
Ancestries Reported - Lithuanian (%)
Ancestries Reported - Norwegian (%)
Ancestries Reported - Polish (%)
Ancestries Reported - Portuguese (%)
Ancestries Reported - Russian (%)
Ancestries Reported - Scotch-Irish (%)
Ancestries Reported - Scottish (%)
Ancestries Reported - Slovak (%)
Ancestries Reported - Subsaharan African (%)
Ancestries Reported - Swedish (%)
Ancestries Reported - Swiss (%)
Ancestries Reported - Ukrainian (%)
Ancestries Reported - United States (%)
Ancestries Reported - Welsh (%)
Ancestries Reported - West Indian (%)
Ancestries Reported - Other (%)
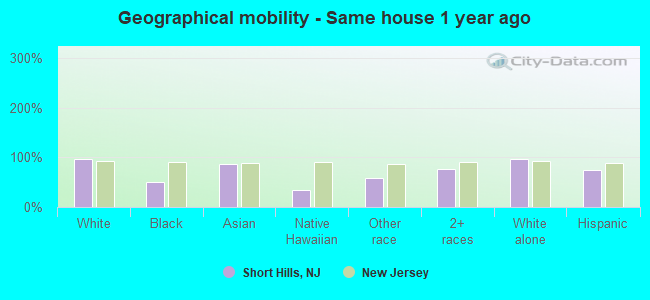
Geographical mobility - Same house 1 year ago (%)
Geographical mobility - Same house 1 year ago (%) - White
Geographical mobility - Same house 1 year ago (%) - Black or African American
Geographical mobility - Same house 1 year ago (%) - Asian
Geographical mobility - Same house 1 year ago (%) - Hispanic or Latino
Geographical mobility - Same house 1 year ago (%) - American Indian and Alaska Native
Geographical mobility - Same house 1 year ago (%) - Multirace
Geographical mobility - Same house 1 year ago (%) - Other Race
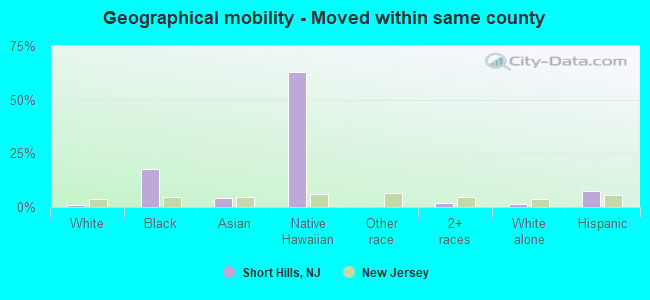
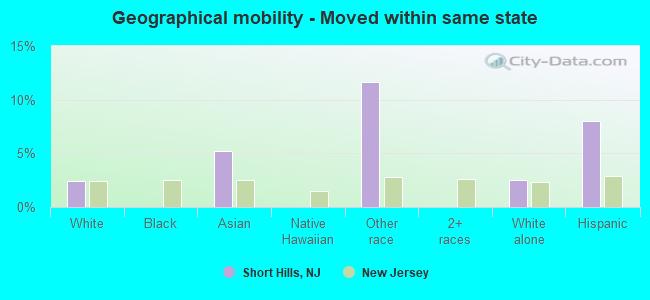
Geographical mobility - Moved within same county (%)
Geographical mobility - Moved within same county (%) - White
Geographical mobility - Moved within same county (%) - Black or African American
Geographical mobility - Moved within same county (%) - Asian
Geographical mobility - Moved within same county (%) - Hispanic or Latino
Geographical mobility - Moved within same county (%) - American Indian and Alaska Native
Geographical mobility - Moved within same county (%) - Multirace
Geographical mobility - Moved within same county (%) - Other Race
Geographical mobility - Moved from different county within same state (%)
Geographical mobility - Moved from different county within same state (%) - White
Geographical mobility - Moved from different county within same state (%) - Black or African American
Geographical mobility - Moved from different county within same state (%) - Asian
Geographical mobility - Moved from different county within same state (%) - Hispanic or Latino
Geographical mobility - Moved from different county within same state (%) - American Indian and Alaska Native
Geographical mobility - Moved from different county within same state (%) - Multirace
Geographical mobility - Moved from different county within same state (%) - Other Race
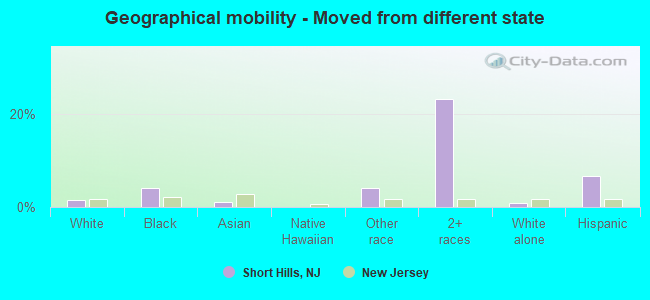
Geographical mobility - Moved from different state (%)
Geographical mobility - Moved from different state (%) - White
Geographical mobility - Moved from different state (%) - Black or African American
Geographical mobility - Moved from different state (%) - Asian
Geographical mobility - Moved from different state (%) - Hispanic or Latino
Geographical mobility - Moved from different state (%) - American Indian and Alaska Native
Geographical mobility - Moved from different state (%) - Multirace
Geographical mobility - Moved from different state (%) - Other Race
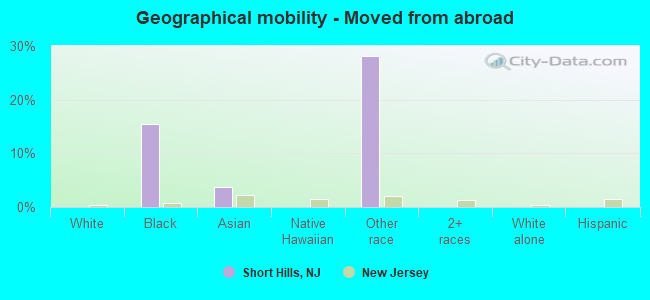
Geographical mobility - Moved from abroad (%)
Geographical mobility - Moved from abroad (%) - White
Geographical mobility - Moved from abroad (%) - Black or African American
Geographical mobility - Moved from abroad (%) - Asian
Geographical mobility - Moved from abroad (%) - Hispanic or Latino
Geographical mobility - Moved from abroad (%) - American Indian and Alaska Native
Geographical mobility - Moved from abroad (%) - Multirace
Geographical mobility - Moved from abroad (%) - Other Race
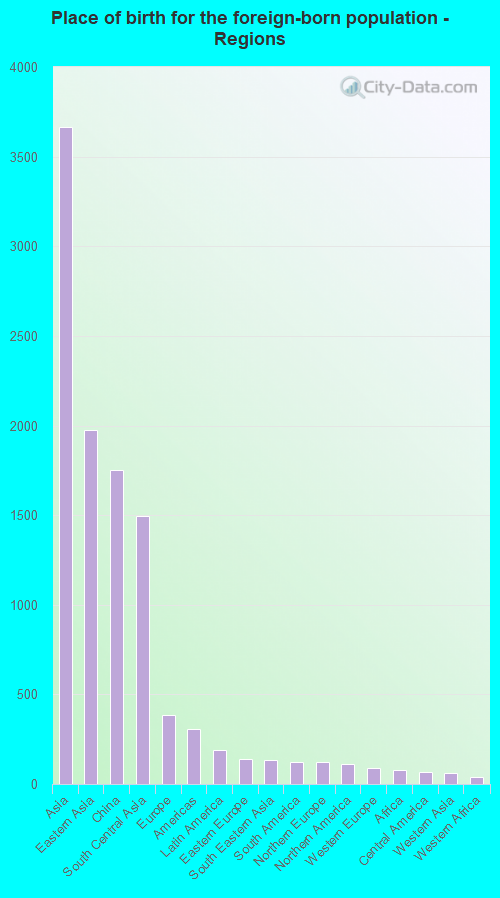
Place of birth for the foreign-born population - Ireland (%)
Place of birth for the foreign-born population - Denmark (%)
Place of birth for the foreign-born population - Norway (%)
Place of birth for the foreign-born population - Sweden (%)
Place of birth for the foreign-born population - United Kingdom (%)
Place of birth for the foreign-born population - England (%)
Place of birth for the foreign-born population - Scotland (%)
Place of birth for the foreign-born population - Other Northern Europe (%)
Place of birth for the foreign-born population - Austria (%)
Place of birth for the foreign-born population - Belgium (%)
Place of birth for the foreign-born population - France (%)
Place of birth for the foreign-born population - Germany (%)
Place of birth for the foreign-born population - Netherlands (%)
Place of birth for the foreign-born population - Switzerland (%)
Place of birth for the foreign-born population - Other Western Europe (%)
Place of birth for the foreign-born population - Greece (%)
Place of birth for the foreign-born population - Italy (%)
Place of birth for the foreign-born population - Portugal (%)
Place of birth for the foreign-born population - Spain (%)
Place of birth for the foreign-born population - Other Southern Europe (%)
Place of birth for the foreign-born population - Albania (%)
Place of birth for the foreign-born population - Belarus (%)
Place of birth for the foreign-born population - Bosnia and Herzegovina (%)
Place of birth for the foreign-born population - Bulgaria (%)
Place of birth for the foreign-born population - Croatia (%)
Place of birth for the foreign-born population - Czechoslovakia (%)
Place of birth for the foreign-born population - Hungary (%)
Place of birth for the foreign-born population - Latvia (%)
Place of birth for the foreign-born population - Lithuania (%)
Place of birth for the foreign-born population - North Macedonia (Macedonia) (%)
Place of birth for the foreign-born population - Moldova (%)
Place of birth for the foreign-born population - Poland (%)
Place of birth for the foreign-born population - Romania (%)
Place of birth for the foreign-born population - Russia (%)
Place of birth for the foreign-born population - Serbia (%)
Place of birth for the foreign-born population - Ukraine (%)
Place of birth for the foreign-born population - Other Eastern Europe (%)
Place of birth for the foreign-born population - China (%)
Place of birth for the foreign-born population - Hong Kong (%)
Place of birth for the foreign-born population - Taiwan (%)
Place of birth for the foreign-born population - Japan (%)
Place of birth for the foreign-born population - Korea (%)
Place of birth for the foreign-born population - Other Eastern Asia (%)
Place of birth for the foreign-born population - Afghanistan (%)
Place of birth for the foreign-born population - Bangladesh (%)
Place of birth for the foreign-born population - India (%)
Place of birth for the foreign-born population - Iran (%)
Place of birth for the foreign-born population - Kazakhstan (%)
Place of birth for the foreign-born population - Nepal (%)
Place of birth for the foreign-born population - Pakistan (%)
Place of birth for the foreign-born population - Sri Lanka (%)
Place of birth for the foreign-born population - Uzbekistan (%)
Place of birth for the foreign-born population - Other South Central Asia (%)
Place of birth for the foreign-born population - Burma (%)
Place of birth for the foreign-born population - Cambodia (%)
Place of birth for the foreign-born population - Indonesia (%)
Place of birth for the foreign-born population - Laos (%)
Place of birth for the foreign-born population - Malaysia (%)
Place of birth for the foreign-born population - Philippines (%)
Place of birth for the foreign-born population - Singapore (%)
Place of birth for the foreign-born population - Thailand (%)
Place of birth for the foreign-born population - Vietnam (%)
Place of birth for the foreign-born population - Other South Eastern Asia (%)
Place of birth for the foreign-born population - Armenia (%)
Place of birth for the foreign-born population - Iraq (%)
Place of birth for the foreign-born population - Israel (%)
Place of birth for the foreign-born population - Jordan (%)
Place of birth for the foreign-born population - Kuwait (%)
Place of birth for the foreign-born population - Lebanon (%)
Place of birth for the foreign-born population - Saudi Arabia (%)
Place of birth for the foreign-born population - Syria (%)
Place of birth for the foreign-born population - Turkey (%)
Place of birth for the foreign-born population - Yemen (%)
Place of birth for the foreign-born population - Other Western Asia (%)
Place of birth for the foreign-born population - Eritrea (%)
Place of birth for the foreign-born population - Ethiopia (%)
Place of birth for the foreign-born population - Kenya (%)
Place of birth for the foreign-born population - Somalia (%)
Place of birth for the foreign-born population - Uganda (%)
Place of birth for the foreign-born population - Zimbabwe (%)
Place of birth for the foreign-born population - Other Eastern Africa (%)
Place of birth for the foreign-born population - Cameroon (%)
Place of birth for the foreign-born population - Congo (%)
Place of birth for the foreign-born population - Democratic Republic of Congo (Zaire) (%)
Place of birth for the foreign-born population - Other Middle Africa (%)
Place of birth for the foreign-born population - Egypt (%)
Place of birth for the foreign-born population - Morocco (%)
Place of birth for the foreign-born population - Sudan (%)
Place of birth for the foreign-born population - Other Northern Africa (%)
Place of birth for the foreign-born population - South Africa (%)
Place of birth for the foreign-born population - Other Southern Africa (%)
Place of birth for the foreign-born population - Cabo Verde (%)
Place of birth for the foreign-born population - Ghana (%)
Place of birth for the foreign-born population - Liberia (%)
Place of birth for the foreign-born population - Nigeria (%)
Place of birth for the foreign-born population - Senegal (%)
Place of birth for the foreign-born population - Sierra Leone (%)
Place of birth for the foreign-born population - Other Western Africa (%)
Place of birth for the foreign-born population - Australia (%)
Place of birth for the foreign-born population - New Zealand (%)
Place of birth for the foreign-born population - Fiji (%)
Place of birth for the foreign-born population - Micronesia (%)
Place of birth for the foreign-born population - Bahamas (%)
Place of birth for the foreign-born population - Barbados (%)
Place of birth for the foreign-born population - Cuba (%)
Place of birth for the foreign-born population - Dominica (%)
Place of birth for the foreign-born population - Dominican Republic (%)
Place of birth for the foreign-born population - Grenada (%)
Place of birth for the foreign-born population - Haiti (%)
Place of birth for the foreign-born population - Jamaica (%)
Place of birth for the foreign-born population - St. Vincent and the Grenadines (%)
Place of birth for the foreign-born population - Trinidad and Tobago (%)
Place of birth for the foreign-born population - West Indies (%)
Place of birth for the foreign-born population - Other Caribbean (%)
Place of birth for the foreign-born population - Belize (%)
Place of birth for the foreign-born population - Costa Rica (%)
Place of birth for the foreign-born population - El Salvador (%)
Place of birth for the foreign-born population - Guatemala (%)
Place of birth for the foreign-born population - Honduras (%)
Place of birth for the foreign-born population - Mexico (%)
Place of birth for the foreign-born population - Nicaragua (%)
Place of birth for the foreign-born population - Panama (%)
Place of birth for the foreign-born population - Other Central America (%)
Place of birth for the foreign-born population - Argentina (%)
Place of birth for the foreign-born population - Bolivia (%)
Place of birth for the foreign-born population - Brazil (%)
Place of birth for the foreign-born population - Chile (%)
Place of birth for the foreign-born population - Colombia (%)
Place of birth for the foreign-born population - Ecuador (%)
Place of birth for the foreign-born population - Guyana (%)
Place of birth for the foreign-born population - Peru (%)
Place of birth for the foreign-born population - Uruguay (%)
Place of birth for the foreign-born population - Venezuela (%)
Place of birth for the foreign-born population - Other South America (%)
Place of birth for the foreign-born population - Canada (%)
Place of birth for the foreign-born population - Other Northern America (%)
Place of birth for the foreign-born population - Other (%)
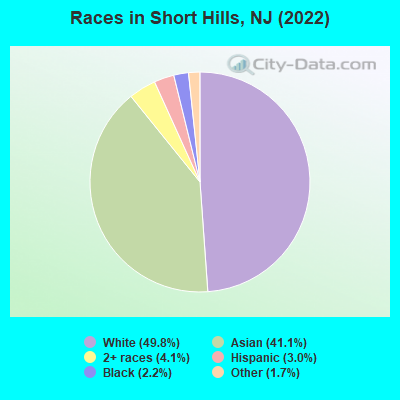
According to 2022 data, the most numerous races in Short Hills, NJ are White alone (7,164 residents), Hispanic (433 residents), and Black alone (312 residents). 66.8% of Short Hills residents speak English at home.
Race distribution in Short Hills 7,164 49.8% White alone 5,906 41.1% Asian alone 590 4.1% Two or more races 433 3.0% Hispanic 312 2.2% Black alone 240 1.7% Other race alone
2000 2022
5,557,209 66.0% White alone 1,117,191 13.3% Hispanic 1,096,171 13.0% Black alone 477,012 5.7% Asian alone 133,689 1.6% Two or more races 19,565 0.2% Other race alone 11,338 0.1% American Indian alone 2,175 0.03% Native Hawaiian and Other
4,766,476 51.5% White alone 2,028,470 21.9% Hispanic 1,111,632 12.0% Black alone 923,546 10.0% Asian alone 332,237 3.6% Two or more races 89,847 1.0% Other race alone 8,557 0.09% American Indian alone 934 0.01% Native Hawaiian and Other
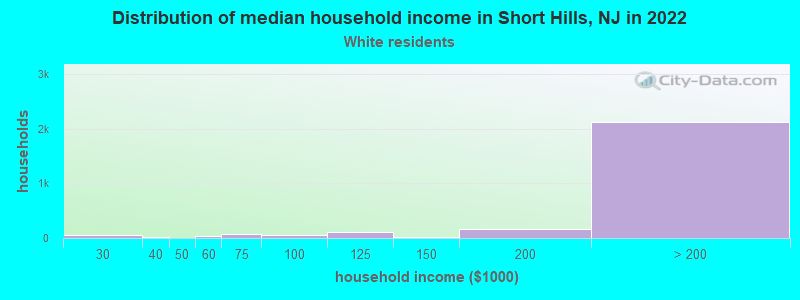
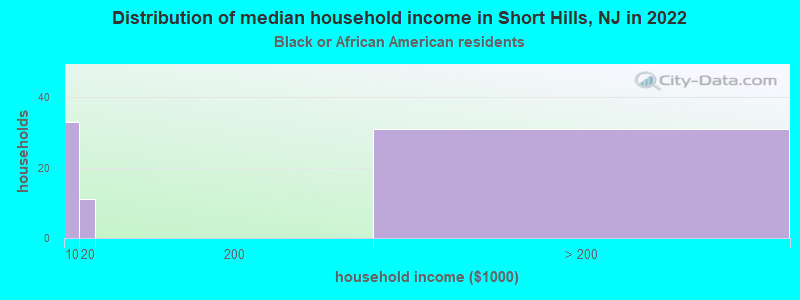
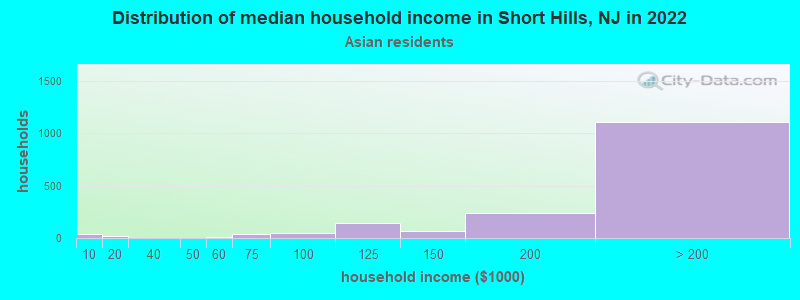
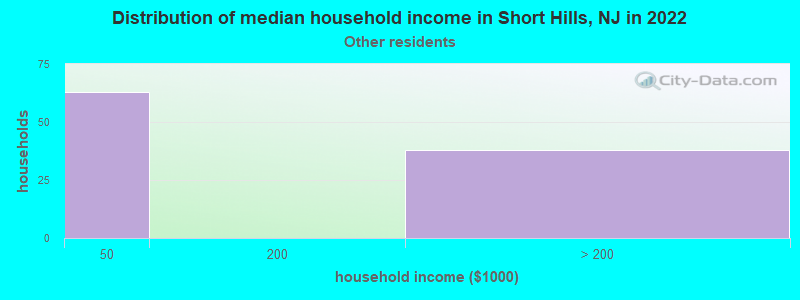
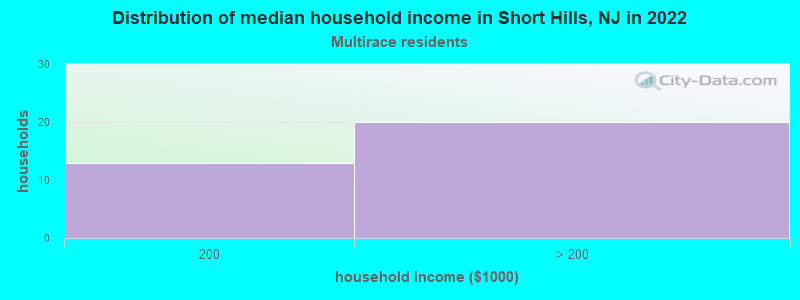
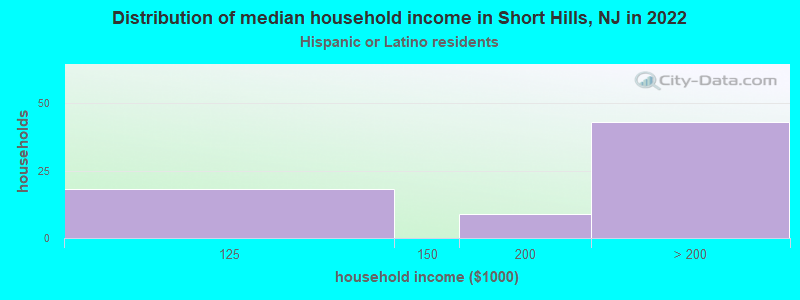
Income and house value in Short Hills Median household income in 2022 over $200,000 White non-Hispanic householdersover $200,000 Asian householdersover $200,000 Hispanic or Latino race householders
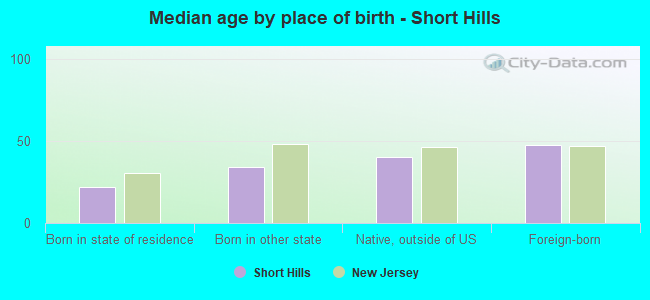
Median age by race in Short Hills
47.8 Median age for White residents48.3 47.6 24.4 Median age for Black or African American residents14.1 28.7 -771,653,542.5 Median age for American Indian / Alaska Native residents-723,484,847.8 -684,973,302.1 39.8 Median age for Asian residents39.2 40.9 6.5 Median age for Native Hawaiian / Pacific Islander residents7.0 -713,070,378.3 32.3 Median age for Other race residents32.4 25.1 13.5 Median age for Two or more races residents18.9 10.4 47.1 Median age for White alone residents47.0 47.0 14.9 Median age for Hispanic or Latino residents12.7 14.9
Owner/renter occupied households by race in Short Hills
House owners and renters - White residents 2,391 91.7% Owner occupied217 8.3% Renter occupiedHouse owners and renters - Black or African American residents 15 20.7% Owner occupied56 79.3% Renter occupiedHouse owners and renters - Asian residents 1,597 84.7% Owner occupied289 15.3% Renter occupiedHouse owners and renters - Native Hawaiian / Pacific Islander residents 21 100.0% Owner occupiedHouse owners and renters - Other race residents 67 52.4% Owner occupied61 47.6% Renter occupiedHouse owners and renters - Two or more races residents 28 100.0% Owner occupiedHouse owners and renters - White alone residents 2,455 89.8% Owner occupied279 10.2% Renter occupiedHouse owners and renters - Hispanic or Latino residents 72 100.0% Owner occupied
Language usage in Short Hills
English speakers - Total 66.8% of residents of Short Hills speak English at home.
1.7% of residents speak Spanish at home 212 93.4% Speak English very well15 6.6% Speak English less than very well31.3% of residents speak other language at home 3,385 79.3% Speak English very well885 20.7% Speak English less than very well
English speakers - Born in the United States 86.9% of residents of Short Hills speak English at home.
1.8% of residents speak Spanish at home 93 100.0% Speak English very well12.0% of residents speak other language at home 553 87.1% Speak English very well82 12.9% Speak English less than very well
English speakers - Native, born elsewhere 91.0% of residents of Short Hills speak English at home.
20.1% of residents speak other language at home 29 100.0% Speak English less than very well
English speakers - Foreign-born 22.3% of residents of Short Hills speak English at home.
2.0% of residents speak Spanish at home 71 82.6% Speak English very well15 17.4% Speak English less than very well75.0% of residents speak other language at home 2,552 77.6% Speak English very well735 22.4% Speak English less than very well
White (Caucasian) - Speak only English Native:
100.0% (5,979)Foreign-born:
67.9% (335)
White (Caucasian) - Speak another language Native:
1.8% (109)Foreign-born:
49.5% (244)
Asian - Speak only English Native:
52.3% (1,107)Foreign-born:
14.7% (514)
Asian - Speak another language Native:
45.3% (960)Foreign-born:
84.8% (2,965)
Other race - Speak only English Native:
87.5% (202)Foreign-born:
99.0% (51)
Other race - Speak another language Native:
14.3% (33)Foreign-born:
32.0% (17)
Two or more races - Speak another language Native:
4.5% (26)Foreign-born:
86.5% (49)
White alone - Speak only English Native:
98.0% (6,145)Foreign-born:
53.5% (356)
White alone - Speak another language Native:
2.4% (153)Foreign-born:
49.3% (328)
Hispanic or Latino - Speak only English Native:
90.4% (283)Foreign-born:
19.9% (19)
Hispanic or Latino - Speak another language Native:
15.6% (49)Foreign-born:
83.8% (79)
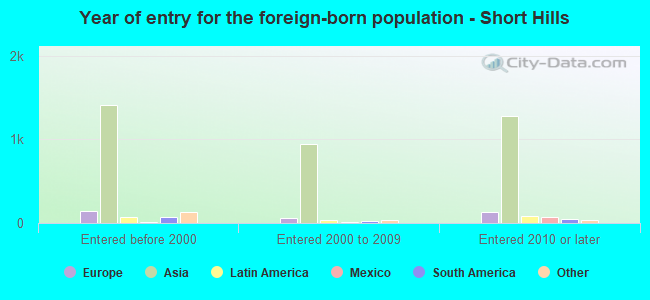
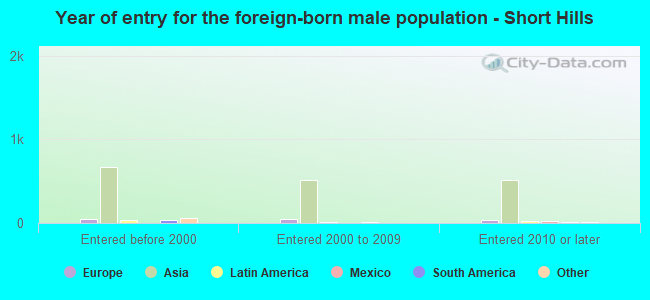
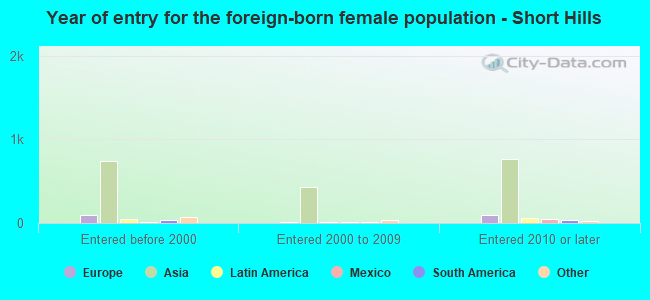
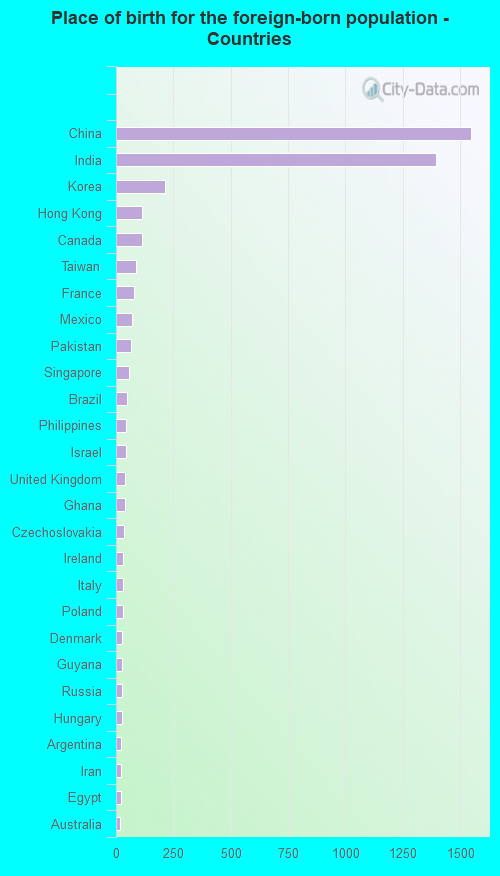
Foreign-born residents in Short Hills
Marital status for residents in Short Hills Marital status - White (Caucasian) population 15 years and over
Males 21.7% Never married72.2% Now married0.4% Separated0.5% Widowed5.2% DivorcedFemales 22.1% Never married70.9% Now married0.2% Separated4.9% Widowed1.8% DivorcedWomen who gave birth in the past 12 months Now married:
100.0% (52)Unmarried:
0.0% (0)
Women who did not give birth in the past 12 months Now married:
53.5% (659)Unmarried:
46.5% (573)
Marital status - Black or African American population 15 years and over
Males 0.0% Never married46.0% Now married54.0% Separated0.0% Widowed0.0% DivorcedFemales 56.0% Never married30.0% Now married0.0% Separated0.0% Widowed14.0% DivorcedWomen who gave birth in the past 12 months Now married:
100.0% (15)Unmarried:
0.0% (0)
Women who did not give birth in the past 12 months Now married:
0.0% (0)Unmarried:
100.0% (65)
Marital status - Asian population 15 years and over
Males 12.8% Never married85.1% Now married0.0% Separated0.0% Widowed2.1% DivorcedFemales 14.1% Never married77.6% Now married0.0% Separated4.8% Widowed3.5% DivorcedWomen who gave birth in the past 12 months Now married:
100.0% (77)Unmarried:
0.0% (0)
Women who did not give birth in the past 12 months Now married:
76.1% (1,158)Unmarried:
23.9% (364)
Marital status - Other race population 15 years and over
Males 0.0% Never married50.5% Now married49.5% Separated0.0% Widowed0.0% DivorcedFemales 40.4% Never married59.6% Now married0.0% Separated0.0% Widowed0.0% DivorcedWomen who did not give birth in the past 12 months Now married:
59.6% (44)Unmarried:
40.4% (30)
Marital status - Two or more races population 15 years and over
Males 87.5% Never married12.5% Now married0.0% Separated0.0% Widowed0.0% DivorcedFemales 42.0% Never married58.0% Now married0.0% Separated0.0% Widowed0.0% DivorcedWomen who did not give birth in the past 12 months Now married:
49.3% (49)Unmarried:
50.7% (51)
Marital status - White alone, not Hispanic / Latino population 15 years and over
Males 21.8% Never married72.1% Now married0.4% Separated0.5% Widowed5.2% DivorcedFemales 22.2% Never married70.8% Now married0.2% Separated5.0% Widowed1.8% DivorcedWomen who gave birth in the past 12 months Now married:
100.0% (60)Unmarried:
0.0% (0)
Women who did not give birth in the past 12 months Now married:
53.3% (742)Unmarried:
46.7% (651)
Marital status - Hispanic or Latino population 15 years and over
Males 32.1% Never married67.9% Now married0.0% Separated0.0% Widowed0.0% DivorcedFemales 25.2% Never married64.9% Now married0.0% Separated0.0% Widowed9.9% DivorcedWomen who did not give birth in the past 12 months Now married:
58.2% (65)Unmarried:
41.8% (47)
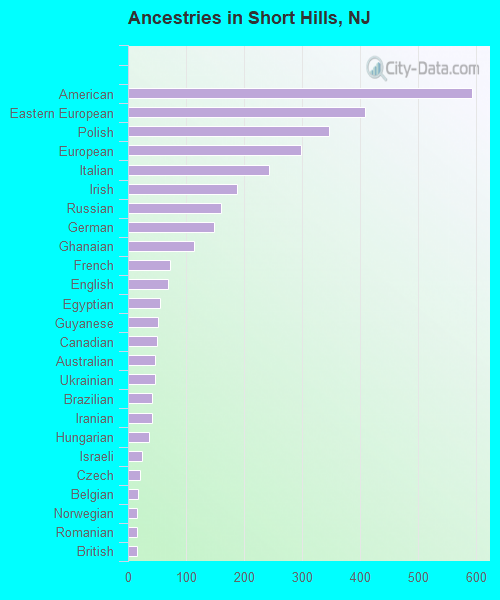
Ancestries in Short Hills
593 6.7% American409 4.6% Eastern European346 3.9% Polish298 3.4% European244 2.8% Italian188 2.1% Irish160 1.8% Russian148 1.7% German113 1.3% Ghanaian73 0.8% French69 0.8% English56 0.6% Egyptian51 0.6% Guyanese50 0.6% Canadian46 0.5% Australian46 0.5% Ukrainian42 0.5% Brazilian41 0.5% Iranian36 0.4% Hungarian25 0.3% Israeli21 0.2% Czech17 0.2% Belgian16 0.2% Norwegian16 0.2% Romanian15 0.2% British11 0.1% Jamaican9 0.1% Scotch-Irish8 0.09% Croatian5 0.06% Danish
Children Nativity (place of birth) in Short Hills
Children under 6 years - Living with two parents Both parents native 280 100.0% NativeBoth parents foreign-born 442 92.2% Native37 7.8% Foreign-bornOne native, one foreign-born parent 145 100.0% NativeChildren under 6 years - Living with one parent Foreign-born parent 27 100.0% NativeChildren 6 to 17 years - Living with two parents Both parents native 1,069 100.0% NativeBoth parents foreign-born 1,722 87.0% Native257 13.0% Foreign-bornOne native, one foreign-born parent 500 100.0% NativeChildren 6 to 17 years - Living with one parent Native parent 291 100.0% NativeForeign-born parent 92 56.3% Native72 43.7% Foreign-born