Races in Shreveport, Louisiana (LA) Detailed Stats
Data:
Races - White alone (%)
Races - White alone (% change since 2000)
Races - Black alone (%)
Races - Black alone (% change since 2000)
Races - American Indian alone (%)
Races - American Indian alone (% change since 2000)
Races - Asian alone (%)
Races - Asian alone (% change since 2000)
Races - Hispanic (%)
Races - Hispanic (% change since 2000)
Races - Native Hawaiian and Other Pacific Islander alone (%)
Races - Native Hawaiian and Other Pacific Islander alone (% change since 2000)
Races - Two or more races(%)
Races - Two or more races(% change since 2000)
Races - Other race alone (%)
Races - Other race alone (% change since 2000)
Racial diversity
Place of birth - Born in state of residence (%)
Place of birth - Born in state of residence (%) - White
Place of birth - Born in state of residence (%) - Black or African American
Place of birth - Born in state of residence (%) - Asian
Place of birth - Born in state of residence (%) - Hispanic or Latino
Place of birth - Born in state of residence (%) - American Indian and Alaska Native
Place of birth - Born in state of residence (%) - Multirace
Place of birth - Born in state of residence (%) - Other Race
Place of birth - Born in other state (%)
Place of birth - Born in other state (%) - White
Place of birth - Born in other state (%) - Black or African American
Place of birth - Born in other state (%) - Asian
Place of birth - Born in other state (%) - Hispanic or Latino
Place of birth - Born in other state (%) - American Indian and Alaska Native
Place of birth - Born in other state (%) - Multirace
Place of birth - Born in other state (%) - Other Race
Place of birth - Native, outside of US (%)
Place of birth - Native, outside of US (%) - White
Place of birth - Native, outside of US (%) - Black or African American
Place of birth - Native, outside of US (%) - Asian
Place of birth - Native, outside of US (%) - Hispanic or Latino
Place of birth - Native, outside of US (%) - American Indian and Alaska Native
Place of birth - Native, outside of US (%) - Multirace
Place of birth - Native, outside of US (%) - Other Race
Place of birth - Foreign born (%)
Place of birth - Foreign born (%) - White
Place of birth - Foreign born (%) - Black or African American
Place of birth - Foreign born (%) - Asian
Place of birth - Foreign born (%) - Hispanic or Latino
Place of birth - Foreign born (%) - American Indian and Alaska Native
Place of birth - Foreign born (%) - Multirace
Place of birth - Foreign born (%) - Other Race
Residents speaking English at home (%)
Residents speaking English at home - Born in the United States (%)
Residents speaking English at home - Native, born elsewhere (%)
Residents speaking English at home - Foreign born (%)
Residents speaking Spanish at home (%)
Residents speaking Spanish at home - Born in the United States (%)
Residents speaking Spanish at home - Native, born elsewhere (%)
Residents speaking Spanish at home - Foreign born (%)
Residents speaking other language at home (%)
Residents speaking other language at home - Born in the United States (%)
Residents speaking other language at home - Native, born elsewhere (%)
Residents speaking other language at home - Foreign born (%)
Marital status - Never married (%)
Marital status - Now married (%)
Marital status - Separated (%)
Marital status - Widowed (%)
Marital status - Divorced (%)
Ancestries Reported - Arab (%)
Ancestries Reported - Czech (%)
Ancestries Reported - Danish (%)
Ancestries Reported - Dutch (%)
Ancestries Reported - English (%)
Ancestries Reported - French (%)
Ancestries Reported - French Canadian (%)
Ancestries Reported - German (%)
Ancestries Reported - Greek (%)
Ancestries Reported - Hungarian (%)
Ancestries Reported - Irish (%)
Ancestries Reported - Italian (%)
Ancestries Reported - Lithuanian (%)
Ancestries Reported - Norwegian (%)
Ancestries Reported - Polish (%)
Ancestries Reported - Portuguese (%)
Ancestries Reported - Russian (%)
Ancestries Reported - Scotch-Irish (%)
Ancestries Reported - Scottish (%)
Ancestries Reported - Slovak (%)
Ancestries Reported - Subsaharan African (%)
Ancestries Reported - Swedish (%)
Ancestries Reported - Swiss (%)
Ancestries Reported - Ukrainian (%)
Ancestries Reported - United States (%)
Ancestries Reported - Welsh (%)
Ancestries Reported - West Indian (%)
Ancestries Reported - Other (%)
Geographical mobility - Same house 1 year ago (%)
Geographical mobility - Same house 1 year ago (%) - White
Geographical mobility - Same house 1 year ago (%) - Black or African American
Geographical mobility - Same house 1 year ago (%) - Asian
Geographical mobility - Same house 1 year ago (%) - Hispanic or Latino
Geographical mobility - Same house 1 year ago (%) - American Indian and Alaska Native
Geographical mobility - Same house 1 year ago (%) - Multirace
Geographical mobility - Same house 1 year ago (%) - Other Race
Geographical mobility - Moved within same county (%)
Geographical mobility - Moved within same county (%) - White
Geographical mobility - Moved within same county (%) - Black or African American
Geographical mobility - Moved within same county (%) - Asian
Geographical mobility - Moved within same county (%) - Hispanic or Latino
Geographical mobility - Moved within same county (%) - American Indian and Alaska Native
Geographical mobility - Moved within same county (%) - Multirace
Geographical mobility - Moved within same county (%) - Other Race
Geographical mobility - Moved from different county within same state (%)
Geographical mobility - Moved from different county within same state (%) - White
Geographical mobility - Moved from different county within same state (%) - Black or African American
Geographical mobility - Moved from different county within same state (%) - Asian
Geographical mobility - Moved from different county within same state (%) - Hispanic or Latino
Geographical mobility - Moved from different county within same state (%) - American Indian and Alaska Native
Geographical mobility - Moved from different county within same state (%) - Multirace
Geographical mobility - Moved from different county within same state (%) - Other Race
Geographical mobility - Moved from different state (%)
Geographical mobility - Moved from different state (%) - White
Geographical mobility - Moved from different state (%) - Black or African American
Geographical mobility - Moved from different state (%) - Asian
Geographical mobility - Moved from different state (%) - Hispanic or Latino
Geographical mobility - Moved from different state (%) - American Indian and Alaska Native
Geographical mobility - Moved from different state (%) - Multirace
Geographical mobility - Moved from different state (%) - Other Race
Geographical mobility - Moved from abroad (%)
Geographical mobility - Moved from abroad (%) - White
Geographical mobility - Moved from abroad (%) - Black or African American
Geographical mobility - Moved from abroad (%) - Asian
Geographical mobility - Moved from abroad (%) - Hispanic or Latino
Geographical mobility - Moved from abroad (%) - American Indian and Alaska Native
Geographical mobility - Moved from abroad (%) - Multirace
Geographical mobility - Moved from abroad (%) - Other Race
Place of birth for the foreign-born population - Ireland (%)
Place of birth for the foreign-born population - Denmark (%)
Place of birth for the foreign-born population - Norway (%)
Place of birth for the foreign-born population - Sweden (%)
Place of birth for the foreign-born population - United Kingdom (%)
Place of birth for the foreign-born population - England (%)
Place of birth for the foreign-born population - Scotland (%)
Place of birth for the foreign-born population - Other Northern Europe (%)
Place of birth for the foreign-born population - Austria (%)
Place of birth for the foreign-born population - Belgium (%)
Place of birth for the foreign-born population - France (%)
Place of birth for the foreign-born population - Germany (%)
Place of birth for the foreign-born population - Netherlands (%)
Place of birth for the foreign-born population - Switzerland (%)
Place of birth for the foreign-born population - Other Western Europe (%)
Place of birth for the foreign-born population - Greece (%)
Place of birth for the foreign-born population - Italy (%)
Place of birth for the foreign-born population - Portugal (%)
Place of birth for the foreign-born population - Spain (%)
Place of birth for the foreign-born population - Other Southern Europe (%)
Place of birth for the foreign-born population - Albania (%)
Place of birth for the foreign-born population - Belarus (%)
Place of birth for the foreign-born population - Bosnia and Herzegovina (%)
Place of birth for the foreign-born population - Bulgaria (%)
Place of birth for the foreign-born population - Croatia (%)
Place of birth for the foreign-born population - Czechoslovakia (%)
Place of birth for the foreign-born population - Hungary (%)
Place of birth for the foreign-born population - Latvia (%)
Place of birth for the foreign-born population - Lithuania (%)
Place of birth for the foreign-born population - North Macedonia (Macedonia) (%)
Place of birth for the foreign-born population - Moldova (%)
Place of birth for the foreign-born population - Poland (%)
Place of birth for the foreign-born population - Romania (%)
Place of birth for the foreign-born population - Russia (%)
Place of birth for the foreign-born population - Serbia (%)
Place of birth for the foreign-born population - Ukraine (%)
Place of birth for the foreign-born population - Other Eastern Europe (%)
Place of birth for the foreign-born population - China (%)
Place of birth for the foreign-born population - Hong Kong (%)
Place of birth for the foreign-born population - Taiwan (%)
Place of birth for the foreign-born population - Japan (%)
Place of birth for the foreign-born population - Korea (%)
Place of birth for the foreign-born population - Other Eastern Asia (%)
Place of birth for the foreign-born population - Afghanistan (%)
Place of birth for the foreign-born population - Bangladesh (%)
Place of birth for the foreign-born population - India (%)
Place of birth for the foreign-born population - Iran (%)
Place of birth for the foreign-born population - Kazakhstan (%)
Place of birth for the foreign-born population - Nepal (%)
Place of birth for the foreign-born population - Pakistan (%)
Place of birth for the foreign-born population - Sri Lanka (%)
Place of birth for the foreign-born population - Uzbekistan (%)
Place of birth for the foreign-born population - Other South Central Asia (%)
Place of birth for the foreign-born population - Burma (%)
Place of birth for the foreign-born population - Cambodia (%)
Place of birth for the foreign-born population - Indonesia (%)
Place of birth for the foreign-born population - Laos (%)
Place of birth for the foreign-born population - Malaysia (%)
Place of birth for the foreign-born population - Philippines (%)
Place of birth for the foreign-born population - Singapore (%)
Place of birth for the foreign-born population - Thailand (%)
Place of birth for the foreign-born population - Vietnam (%)
Place of birth for the foreign-born population - Other South Eastern Asia (%)
Place of birth for the foreign-born population - Armenia (%)
Place of birth for the foreign-born population - Iraq (%)
Place of birth for the foreign-born population - Israel (%)
Place of birth for the foreign-born population - Jordan (%)
Place of birth for the foreign-born population - Kuwait (%)
Place of birth for the foreign-born population - Lebanon (%)
Place of birth for the foreign-born population - Saudi Arabia (%)
Place of birth for the foreign-born population - Syria (%)
Place of birth for the foreign-born population - Turkey (%)
Place of birth for the foreign-born population - Yemen (%)
Place of birth for the foreign-born population - Other Western Asia (%)
Place of birth for the foreign-born population - Eritrea (%)
Place of birth for the foreign-born population - Ethiopia (%)
Place of birth for the foreign-born population - Kenya (%)
Place of birth for the foreign-born population - Somalia (%)
Place of birth for the foreign-born population - Uganda (%)
Place of birth for the foreign-born population - Zimbabwe (%)
Place of birth for the foreign-born population - Other Eastern Africa (%)
Place of birth for the foreign-born population - Cameroon (%)
Place of birth for the foreign-born population - Congo (%)
Place of birth for the foreign-born population - Democratic Republic of Congo (Zaire) (%)
Place of birth for the foreign-born population - Other Middle Africa (%)
Place of birth for the foreign-born population - Egypt (%)
Place of birth for the foreign-born population - Morocco (%)
Place of birth for the foreign-born population - Sudan (%)
Place of birth for the foreign-born population - Other Northern Africa (%)
Place of birth for the foreign-born population - South Africa (%)
Place of birth for the foreign-born population - Other Southern Africa (%)
Place of birth for the foreign-born population - Cabo Verde (%)
Place of birth for the foreign-born population - Ghana (%)
Place of birth for the foreign-born population - Liberia (%)
Place of birth for the foreign-born population - Nigeria (%)
Place of birth for the foreign-born population - Senegal (%)
Place of birth for the foreign-born population - Sierra Leone (%)
Place of birth for the foreign-born population - Other Western Africa (%)
Place of birth for the foreign-born population - Australia (%)
Place of birth for the foreign-born population - New Zealand (%)
Place of birth for the foreign-born population - Fiji (%)
Place of birth for the foreign-born population - Micronesia (%)
Place of birth for the foreign-born population - Bahamas (%)
Place of birth for the foreign-born population - Barbados (%)
Place of birth for the foreign-born population - Cuba (%)
Place of birth for the foreign-born population - Dominica (%)
Place of birth for the foreign-born population - Dominican Republic (%)
Place of birth for the foreign-born population - Grenada (%)
Place of birth for the foreign-born population - Haiti (%)
Place of birth for the foreign-born population - Jamaica (%)
Place of birth for the foreign-born population - St. Vincent and the Grenadines (%)
Place of birth for the foreign-born population - Trinidad and Tobago (%)
Place of birth for the foreign-born population - West Indies (%)
Place of birth for the foreign-born population - Other Caribbean (%)
Place of birth for the foreign-born population - Belize (%)
Place of birth for the foreign-born population - Costa Rica (%)
Place of birth for the foreign-born population - El Salvador (%)
Place of birth for the foreign-born population - Guatemala (%)
Place of birth for the foreign-born population - Honduras (%)
Place of birth for the foreign-born population - Mexico (%)
Place of birth for the foreign-born population - Nicaragua (%)
Place of birth for the foreign-born population - Panama (%)
Place of birth for the foreign-born population - Other Central America (%)
Place of birth for the foreign-born population - Argentina (%)
Place of birth for the foreign-born population - Bolivia (%)
Place of birth for the foreign-born population - Brazil (%)
Place of birth for the foreign-born population - Chile (%)
Place of birth for the foreign-born population - Colombia (%)
Place of birth for the foreign-born population - Ecuador (%)
Place of birth for the foreign-born population - Guyana (%)
Place of birth for the foreign-born population - Peru (%)
Place of birth for the foreign-born population - Uruguay (%)
Place of birth for the foreign-born population - Venezuela (%)
Place of birth for the foreign-born population - Other South America (%)
Place of birth for the foreign-born population - Canada (%)
Place of birth for the foreign-born population - Other Northern America (%)
Place of birth for the foreign-born population - Other (%)
Latest news about races in Shreveport, LA collected exclusively by city-data.com from local newspapers, TV, and radio stations
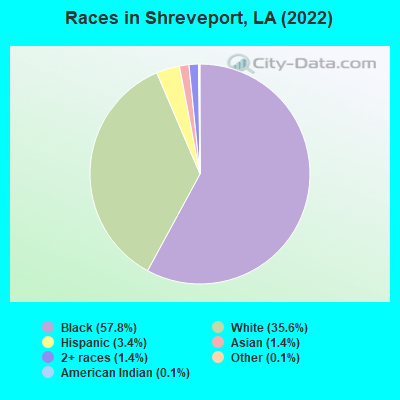
According to 2022 data, the most numerous races in Shreveport, LA are White alone (63,874 residents), Black alone (103,866 residents), and Hispanic (6,110 residents). 96.5% of Shreveport residents speak English at home. 2.5% of Shreveport, LA residents are foreign-born (1.1% born in Asia, 0.7% born in Latin America, 0.4% born in Europe), which is 57.6% less than the foreign-born rate of 4.0% across the entire state of Louisiana.
Race distribution in Shreveport
2000 2022
101,218 50.6% Black alone 91,857 45.9% White alone 3,106 1.6% Hispanic 1,625 0.8% Two or more races 1,577 0.8% Asian alone 568 0.3% American Indian alone 136 0.07% Other race alone 58 0.03% Native Hawaiian and Other
103,866 57.8% Black alone 63,874 35.6% White alone 6,110 3.4% Hispanic 2,517 1.4% Two or more races 2,561 1.4% Asian alone 236 0.1% American Indian alone 252 0.1% Other race alone 135 0.08% Native Hawaiian and Other
2000 2022
2,794,391 62.5% White alone 1,443,390 32.3% Black alone 107,738 2.4% Hispanic 54,256 1.2% Asian alone 39,260 0.9% Two or more races 24,129 0.5% American Indian alone 4,736 0.1% Other race alone 1,076 0.02% Native Hawaiian and Other
2,603,221 56.7% White alone 1,420,055 30.9% Black alone 262,213 5.7% Hispanic 183,270 4.0% Two or more races 81,169 1.8% Asian alone 19,991 0.4% American Indian alone 18,043 0.4% Other race alone 2,279 0.05% Native Hawaiian and Other
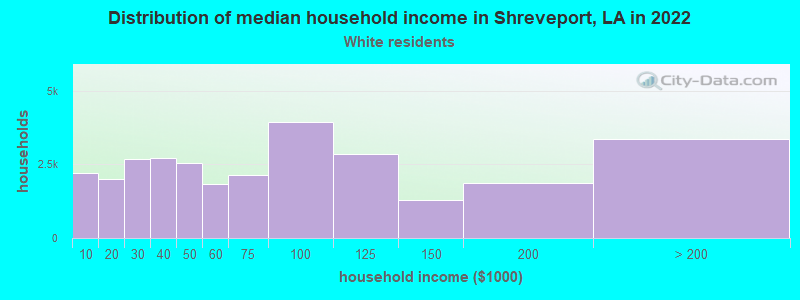
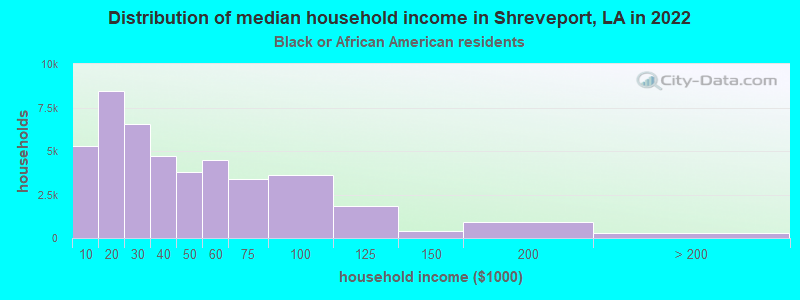
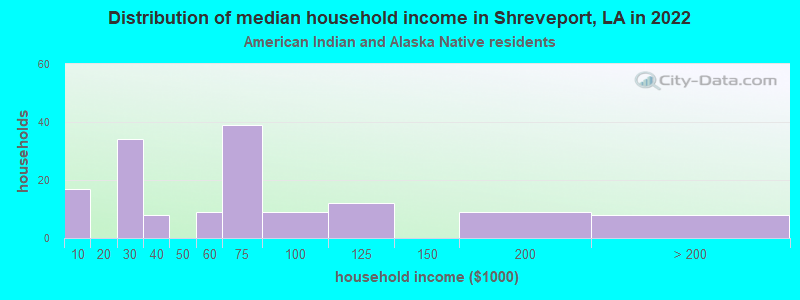
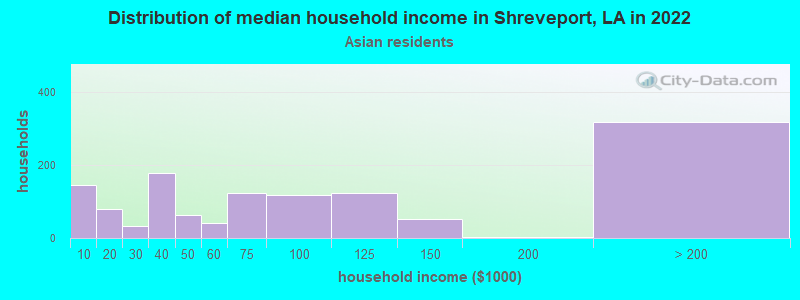
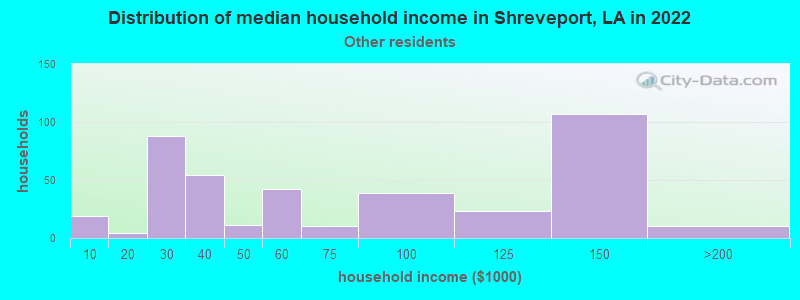
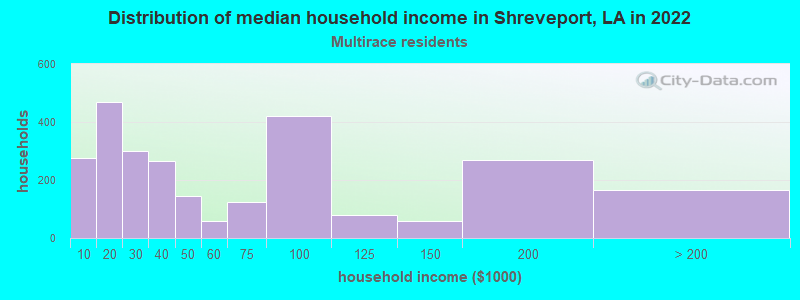
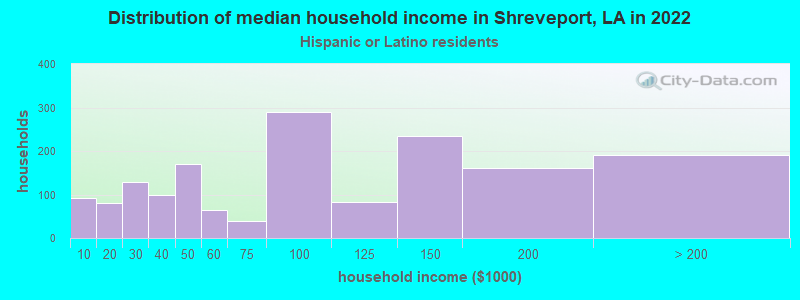
Income and house value in Shreveport Median household income in 2022 $62,205 White non-Hispanic householders$33,887 Black householders$178,644 American Indian and Alaska Native householders$99,827 Asian householders$29,452 Some other race householders$38,750 Two or more races householders$49,681 Hispanic or Latino race householdersMedian 2022 house value $211,218 White Non-Hispanic householders$102,883 Black or African American householders$160,251 American Indian or Alaska Native householders $200,076 Asian householders$161,436 Some other race householders$156,932 Two or more races householders$204,818 Hispanic or Latino householders
Median age by race in Shreveport
47.5 Median age for White residents45.2 49.2 35.0 Median age for Black or African American residents33.6 35.7 42.1 Median age for American Indian / Alaska Native residents42.2 41.4 36.2 Median age for Asian residents33.2 46.0 -666,666,666.0 Median age for Native Hawaiian / Pacific Islander residents-666,666,666.0 -666,666,666.0 46.6 Median age for Other race residents52.5 46.3 23.9 Median age for Two or more races residents29.7 23.4 47.6 Median age for White alone residents45.2 49.3 30.8 Median age for Hispanic or Latino residents29.9 31.6
Owner/renter occupied households by race in Shreveport
House owners and renters - White residents 21,227 71.8% Owner occupied8,319 28.2% Renter occupiedHouse owners and renters - Black or African American residents 17,049 38.9% Owner occupied26,732 61.1% Renter occupiedHouse owners and renters - American Indian / Alaska Native residents 116 71.5% Owner occupied46 28.5% Renter occupiedHouse owners and renters - Asian residents 693 68.8% Owner occupied315 31.2% Renter occupiedHouse owners and renters - Native Hawaiian / Pacific Islander residents 18 100.0% Renter occupiedHouse owners and renters - Other race residents 246 58.2% Owner occupied176 41.8% Renter occupiedHouse owners and renters - Two or more races residents 1,329 51.9% Owner occupied1,233 48.1% Renter occupiedHouse owners and renters - White alone residents 20,896 72.0% Owner occupied8,127 28.0% Renter occupiedHouse owners and renters - Hispanic or Latino residents 1,155 50.2% Owner occupied1,147 49.8% Renter occupied
Language usage in Shreveport
English speakers - Total 96.5% of residents of Shreveport speak English at home.
1.6% of residents speak Spanish at home 1,454 52.4% Speak English very well1,322 47.6% Speak English less than very well1.8% of residents speak other language at home 2,190 70.7% Speak English very well906 29.3% Speak English less than very well
English speakers - Born in the United States 98.8% of residents of Shreveport speak English at home.
0.5% of residents speak Spanish at home 166 100.0% Speak English very well0.7% of residents speak other language at home 218 86.9% Speak English very well33 13.1% Speak English less than very well
English speakers - Native, born elsewhere 57.6% of residents of Shreveport speak English at home.
42.4% of residents speak Spanish at home 160 26.9% Speak English very well435 73.1% Speak English less than very well
English speakers - Foreign-born 30.2% of residents of Shreveport speak English at home.
23.5% of residents speak Spanish at home 473 42.0% Speak English very well652 58.0% Speak English less than very well46.3% of residents speak other language at home 1,341 60.6% Speak English very well873 39.4% Speak English less than very well
White (Caucasian) - Speak only English Native:
99.0% (61,310)Foreign-born:
41.3% (547)
White (Caucasian) - Speak another language Native:
1.0% (600)Foreign-born:
58.7% (778)
Black or African American - Speak only English Native:
99.0% (94,033)Foreign-born:
61.9% (253)
Black or African American - Speak another language Native:
0.9% (844)Foreign-born:
37.2% (152)
American Indian / Alaska Native - Speak another language Native:
26.2% (108)Foreign-born:
100.0% (32)
Asian - Speak only English Native:
27.8% (86)Foreign-born:
23.6% (508)
Asian - Speak another language Native:
72.2% (223)Foreign-born:
76.4% (1,642)
Other race - Speak only English Native:
35.6% (263)Foreign-born:
14.0% (76)
Other race - Speak another language Native:
65.1% (480)Foreign-born:
85.5% (464)
Two or more races - Speak only English Native:
92.2% (5,628)Foreign-born:
6.3% (30)
Two or more races - Speak another language Native:
7.9% (483)Foreign-born:
84.8% (400)
White alone - Speak only English Native:
99.6% (60,880)Foreign-born:
66.6% (547)
White alone - Speak another language Native:
0.4% (262)Foreign-born:
33.4% (274)
Hispanic or Latino - Speak only English Native:
77.1% (3,507)Foreign-born:
10.5% (150)
Hispanic or Latino - Speak another language Native:
22.9% (1,041)Foreign-born:
89.5% (1,285)
Foreign-born residents in Shreveport 4,581 residents are foreign born (1.1% Asia , 0.7% Latin America , 0.4% Europe ).
This city:
2.5%Louisiana:
4.2%
Marital status for residents in Shreveport Marital status - White (Caucasian) population 15 years and over
Males 34.3% Never married45.7% Now married2.3% Separated4.7% Widowed13.0% DivorcedFemales 24.9% Never married40.6% Now married2.4% Separated13.7% Widowed18.5% DivorcedWomen who gave birth in the past 12 months Now married:
100.0% (107)Unmarried:
0.0% (0)
Women who did not give birth in the past 12 months Now married:
38.8% (5,261)Unmarried:
61.2% (8,293)
Marital status - Black or African American population 15 years and over
Males 55.5% Never married26.7% Now married3.6% Separated2.3% Widowed11.9% DivorcedFemales 48.4% Never married18.6% Now married4.6% Separated7.8% Widowed20.6% DivorcedWomen who gave birth in the past 12 months Now married:
22.7% (313)Unmarried:
77.3% (1,066)
Women who did not give birth in the past 12 months Now married:
18.4% (4,826)Unmarried:
81.6% (21,393)
Marital status - American Indian / Alaska Native population 15 years and over
Males 39.8% Never married48.6% Now married0.0% Separated0.0% Widowed11.6% DivorcedFemales 8.8% Never married29.8% Now married4.1% Separated5.3% Widowed52.0% DivorcedWomen who did not give birth in the past 12 months Now married:
29.6% (24)Unmarried:
70.4% (57)
Marital status - Asian population 15 years and over
Males 28.2% Never married53.0% Now married1.0% Separated0.0% Widowed17.8% DivorcedFemales 34.2% Never married50.7% Now married0.4% Separated10.9% Widowed3.8% DivorcedWomen who gave birth in the past 12 months Now married:
100.0% (86)Unmarried:
0.0% (0)
Women who did not give birth in the past 12 months Now married:
44.9% (308)Unmarried:
55.1% (378)
Marital status - Native Hawaiian / Pacific Islander population 15 years and over
Males 37.0% Never married63.0% Now married0.0% Separated0.0% Widowed0.0% DivorcedFemales 0.0% Never married50.0% Now married50.0% Separated0.0% Widowed0.0% DivorcedWomen who did not give birth in the past 12 months Now married:
100.0% (8)Unmarried:
0.0% (0)
Marital status - Other race population 15 years and over
Males 50.1% Never married28.1% Now married1.3% Separated0.7% Widowed19.8% DivorcedFemales 46.6% Never married50.9% Now married0.0% Separated0.0% Widowed2.5% DivorcedWomen who gave birth in the past 12 months Now married:
100.0% (33)Unmarried:
0.0% (0)
Women who did not give birth in the past 12 months Now married:
35.8% (183)Unmarried:
64.2% (328)
Marital status - Two or more races population 15 years and over
Males 46.9% Never married35.6% Now married0.3% Separated1.0% Widowed16.2% DivorcedFemales 36.0% Never married31.2% Now married3.2% Separated13.8% Widowed15.9% DivorcedWomen who gave birth in the past 12 months Now married:
88.8% (112)Unmarried:
11.2% (14)
Women who did not give birth in the past 12 months Now married:
27.0% (475)Unmarried:
73.0% (1,281)
Marital status - White alone, not Hispanic / Latino population 15 years and over
Males 34.1% Never married45.5% Now married2.3% Separated4.8% Widowed13.3% DivorcedFemales 24.2% Never married40.7% Now married2.4% Separated13.9% Widowed18.8% DivorcedWomen who gave birth in the past 12 months Now married:
100.0% (107)Unmarried:
0.0% (0)
Women who did not give birth in the past 12 months Now married:
39.7% (5,229)Unmarried:
60.3% (7,943)
Marital status - Hispanic or Latino population 15 years and over
Males 47.4% Never married34.9% Now married1.5% Separated2.0% Widowed14.2% DivorcedFemales 36.8% Never married43.3% Now married0.8% Separated6.6% Widowed12.5% DivorcedWomen who gave birth in the past 12 months Now married:
70.0% (71)Unmarried:
30.0% (30)
Women who did not give birth in the past 12 months Now married:
36.2% (493)Unmarried:
63.8% (869)
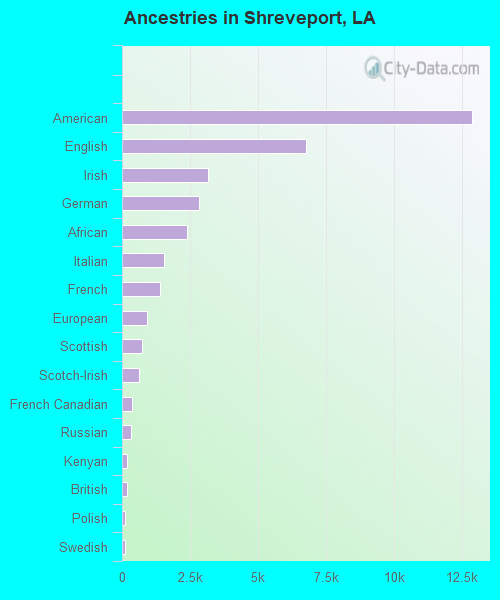
Ancestries in Shreveport
12,855 11.1% American6,766 5.8% English3,179 2.7% Irish2,820 2.4% German2,406 2.1% African1,559 1.3% Italian1,384 1.2% French909 0.8% European740 0.6% Scottish613 0.5% Scotch-Irish362 0.3% French Canadian328 0.3% Russian185 0.2% Kenyan176 0.2% British126 0.1% Polish123 0.1% Swedish106 0.09% Cajun100 0.09% Palestinian98 0.08% Dutch97 0.08% Norwegian95 0.08% Welsh89 0.08% Haitian82 0.07% Jamaican69 0.06% Danish60 0.05% Romanian57 0.05% Northern European56 0.05% Greek51 0.04% Lebanese50 0.04% Portuguese47 0.04% Belgian40 0.03% Turkish36 0.03% Trinidadian and Tobagonian33 0.03% Iranian33 0.03% Nigerian32 0.03% Eastern European31 0.03% Croatian26 0.02% Icelander23 0.02% Ukrainian22 0.02% Swiss17 0.01% Hungarian13 0.01% Slovene13 0.01% Israeli13 0.01% Dutch West Indian10 0.01% Czechoslovakian7 0.01% Scandinavian
Geographical mobility in Shreveport Same house 1 year ago 57,555 88.6% White (Caucasian)85,158 83.3% Black or African American355 79.7% American Indian / Alaska Native2,367 78.0% Asian78 81.1% Native Hawaiian / Pacific Islander1,302 66.6% Other race7,824 90.0% Two or more races56,523 88.8% White alone, not Hispanic / Latino4,353 79.6% Hispanic or LatinoMoved within same county 4,094 6.3% White / Caucasian11,349 11.1% Black or African American49 10.9% American Indian / Alaska Native209 6.9% Asian10 10.4% Native Hawaiian / Pacific Islander471 24.1% Other race442 5.1% Two or more races4,000 6.3% White alone, not Hispanic / Latino758 13.9% Hispanic or LatinoMoved within same state 1,260 1.9% White / Caucasian1,323 1.3% Black or African American35 7.8% American Indian / Alaska Native108 3.6% Asian9 9.2% Native Hawaiian / Pacific Islander116 6.0% Other race269 3.1% Two or more races1,114 1.7% White alone, not Hispanic / Latino153 2.8% Hispanic or LatinoMoved from different state 1,612 2.5% White / Caucasian4,253 4.2% Black or African American3 0.7% American Indian / Alaska Native115 3.8% Asian20 1.0% Other race41 0.5% Two or more races1,612 2.5% White alone, not Hispanic / Latino45 0.8% Hispanic or LatinoMoved from abroad 433 0.7% White167 0.2% Black or African American4 0.9% American Indian / Alaska Native174 5.7% Asian13 0.7% Other race135 1.5% Two or more races433 0.7% White alone, not Hispanic / Latino127 2.3% Hispanic or Latino
Children Nativity (place of birth) in Shreveport
Children under 6 years - Living with two parents Both parents native 4,490 99.9% Native3 0.1% Foreign-bornBoth parents foreign-born 196 66.5% Native99 33.5% Foreign-bornOne native, one foreign-born parent 198 100.0% NativeChildren under 6 years - Living with one parent Native parent 7,511 100.0% NativeForeign-born parent 205 100.0% NativeChildren 6 to 17 years - Living with two parents Both parents native 9,954 99.9% Native10 0.1% Foreign-bornBoth parents foreign-born 310 66.6% Native156 33.4% Foreign-bornOne native, one foreign-born parent 301 94.5% Native18 5.5% Foreign-bornChildren 6 to 17 years - Living with one parent Native parent 17,109 100.0% NativeForeign-born parent 218 50.6% Native213 49.4% Foreign-born
Grandparents responsible for own grandchildren in Shreveport
Grandparents (30 to 59 years) White / Caucasian 72 14.7% Responsible for grandchildren422 85.3% Not responsible for grandchildrenBlack or African American 573 41.5% Responsible for grandchildren808 58.5% Not responsible for grandchildrenAmerican Indian / Alaska Native 8 100.0% Not responsible for grandchildrenAsian 109 100.0% Not responsible for grandchildrenOther race 14 21.6% Responsible for grandchildren49 78.4% Not responsible for grandchildrenTwo or more races 19 66.6% Responsible for grandchildren9 33.4% Not responsible for grandchildrenWhite alone, not Hispanic / Latino 75 15.2% Responsible for grandchildren418 84.8% Not responsible for grandchildrenHispanic or Latino 10 13.6% Responsible for grandchildren63 86.4% Not responsible for grandchildrenGrandparents (60 years and over) White / Caucasian 291 35.3% Responsible for grandchildren535 64.7% Not responsible for grandchildrenBlack or African American 470 52.2% Responsible for grandchildren430 47.8% Not responsible for grandchildrenAmerican Indian / Alaska Native 10 100.0% Not responsible for grandchildrenAsian 2 8.8% Responsible for grandchildren20 91.2% Not responsible for grandchildrenOther race 4 100.0% Not responsible for grandchildrenTwo or more races 14 25.8% Responsible for grandchildren39 74.2% Not responsible for grandchildrenWhite alone, not Hispanic / Latino 291 35.8% Responsible for grandchildren522 64.2% Not responsible for grandchildrenHispanic or Latino 42 100.0% Not responsible for grandchildren