Races in Sikeston, Missouri (MO) Detailed Stats
Data:
Races - White alone (%)
Races - White alone (% change since 2000)
Races - Black alone (%)
Races - Black alone (% change since 2000)
Races - American Indian alone (%)
Races - American Indian alone (% change since 2000)
Races - Asian alone (%)
Races - Asian alone (% change since 2000)
Races - Hispanic (%)
Races - Hispanic (% change since 2000)
Races - Native Hawaiian and Other Pacific Islander alone (%)
Races - Native Hawaiian and Other Pacific Islander alone (% change since 2000)
Races - Two or more races(%)
Races - Two or more races(% change since 2000)
Races - Other race alone (%)
Races - Other race alone (% change since 2000)
Racial diversity
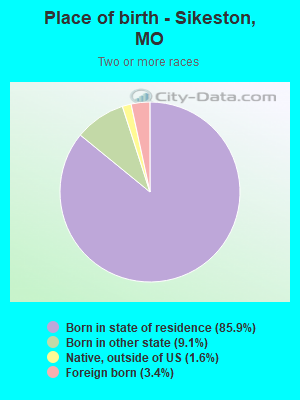
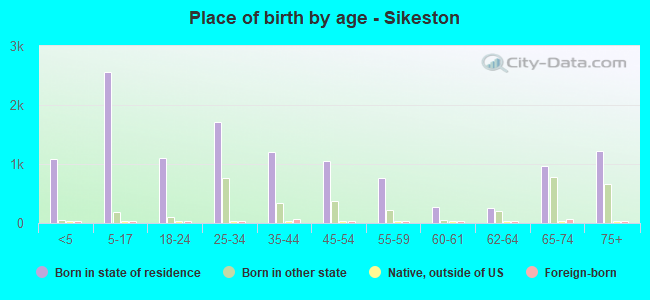
Place of birth - Born in state of residence (%)
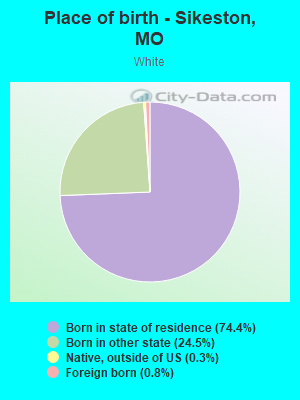
Place of birth - Born in state of residence (%) - White
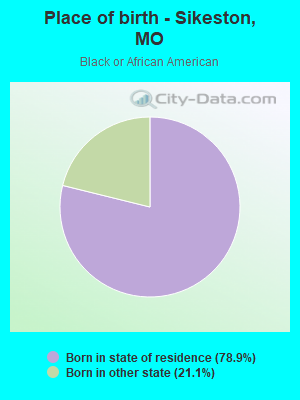
Place of birth - Born in state of residence (%) - Black or African American
Place of birth - Born in state of residence (%) - Asian
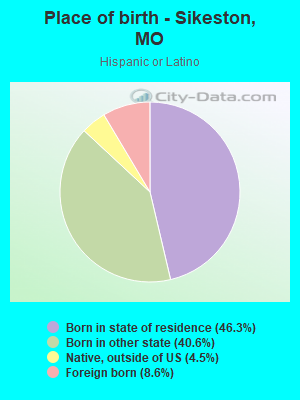
Place of birth - Born in state of residence (%) - Hispanic or Latino
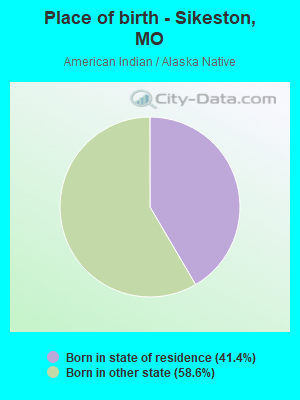
Place of birth - Born in state of residence (%) - American Indian and Alaska Native
Place of birth - Born in state of residence (%) - Multirace
Place of birth - Born in state of residence (%) - Other Race
Place of birth - Born in other state (%)
Place of birth - Born in other state (%) - White
Place of birth - Born in other state (%) - Black or African American
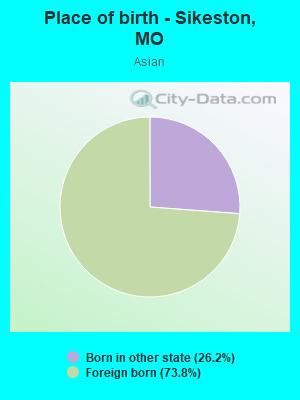
Place of birth - Born in other state (%) - Asian
Place of birth - Born in other state (%) - Hispanic or Latino
Place of birth - Born in other state (%) - American Indian and Alaska Native
Place of birth - Born in other state (%) - Multirace
Place of birth - Born in other state (%) - Other Race
Place of birth - Native, outside of US (%)
Place of birth - Native, outside of US (%) - White
Place of birth - Native, outside of US (%) - Black or African American
Place of birth - Native, outside of US (%) - Asian
Place of birth - Native, outside of US (%) - Hispanic or Latino
Place of birth - Native, outside of US (%) - American Indian and Alaska Native
Place of birth - Native, outside of US (%) - Multirace
Place of birth - Native, outside of US (%) - Other Race
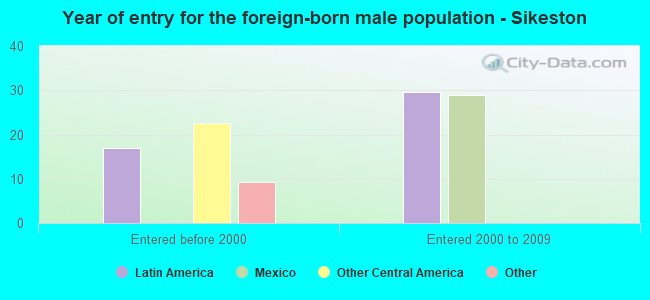
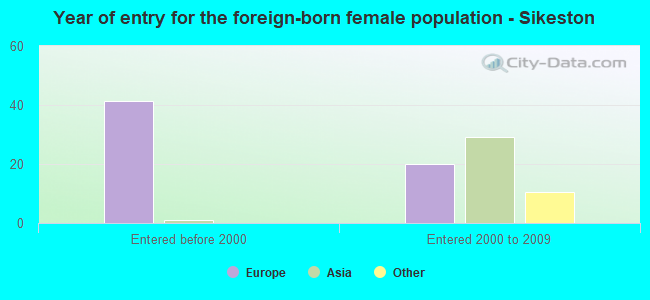
Place of birth - Foreign born (%)
Place of birth - Foreign born (%) - White
Place of birth - Foreign born (%) - Black or African American
Place of birth - Foreign born (%) - Asian
Place of birth - Foreign born (%) - Hispanic or Latino
Place of birth - Foreign born (%) - American Indian and Alaska Native
Place of birth - Foreign born (%) - Multirace
Place of birth - Foreign born (%) - Other Race
Residents speaking English at home (%)
Residents speaking English at home - Born in the United States (%)
Residents speaking English at home - Native, born elsewhere (%)
Residents speaking English at home - Foreign born (%)
Residents speaking Spanish at home (%)
Residents speaking Spanish at home - Born in the United States (%)
Residents speaking Spanish at home - Native, born elsewhere (%)
Residents speaking Spanish at home - Foreign born (%)
Residents speaking other language at home (%)
Residents speaking other language at home - Born in the United States (%)
Residents speaking other language at home - Native, born elsewhere (%)
Residents speaking other language at home - Foreign born (%)
Marital status - Never married (%)
Marital status - Now married (%)
Marital status - Separated (%)
Marital status - Widowed (%)
Marital status - Divorced (%)
Ancestries Reported - Arab (%)
Ancestries Reported - Czech (%)
Ancestries Reported - Danish (%)
Ancestries Reported - Dutch (%)
Ancestries Reported - English (%)
Ancestries Reported - French (%)
Ancestries Reported - French Canadian (%)
Ancestries Reported - German (%)
Ancestries Reported - Greek (%)
Ancestries Reported - Hungarian (%)
Ancestries Reported - Irish (%)
Ancestries Reported - Italian (%)
Ancestries Reported - Lithuanian (%)
Ancestries Reported - Norwegian (%)
Ancestries Reported - Polish (%)
Ancestries Reported - Portuguese (%)
Ancestries Reported - Russian (%)
Ancestries Reported - Scotch-Irish (%)
Ancestries Reported - Scottish (%)
Ancestries Reported - Slovak (%)
Ancestries Reported - Subsaharan African (%)
Ancestries Reported - Swedish (%)
Ancestries Reported - Swiss (%)
Ancestries Reported - Ukrainian (%)
Ancestries Reported - United States (%)
Ancestries Reported - Welsh (%)
Ancestries Reported - West Indian (%)
Ancestries Reported - Other (%)
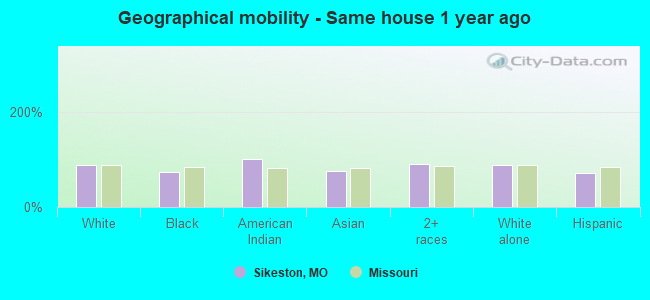
Geographical mobility - Same house 1 year ago (%)
Geographical mobility - Same house 1 year ago (%) - White
Geographical mobility - Same house 1 year ago (%) - Black or African American
Geographical mobility - Same house 1 year ago (%) - Asian
Geographical mobility - Same house 1 year ago (%) - Hispanic or Latino
Geographical mobility - Same house 1 year ago (%) - American Indian and Alaska Native
Geographical mobility - Same house 1 year ago (%) - Multirace
Geographical mobility - Same house 1 year ago (%) - Other Race
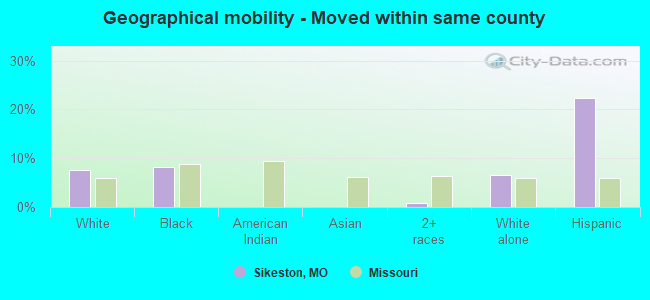
Geographical mobility - Moved within same county (%)
Geographical mobility - Moved within same county (%) - White
Geographical mobility - Moved within same county (%) - Black or African American
Geographical mobility - Moved within same county (%) - Asian
Geographical mobility - Moved within same county (%) - Hispanic or Latino
Geographical mobility - Moved within same county (%) - American Indian and Alaska Native
Geographical mobility - Moved within same county (%) - Multirace
Geographical mobility - Moved within same county (%) - Other Race
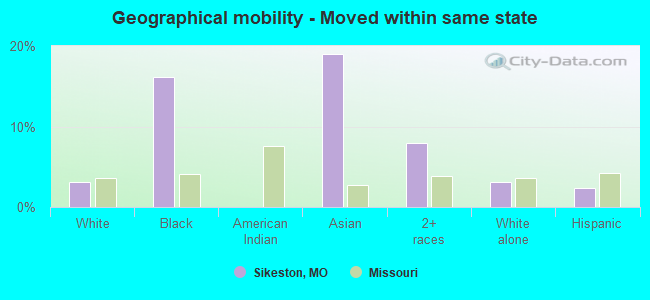
Geographical mobility - Moved from different county within same state (%)
Geographical mobility - Moved from different county within same state (%) - White
Geographical mobility - Moved from different county within same state (%) - Black or African American
Geographical mobility - Moved from different county within same state (%) - Asian
Geographical mobility - Moved from different county within same state (%) - Hispanic or Latino
Geographical mobility - Moved from different county within same state (%) - American Indian and Alaska Native
Geographical mobility - Moved from different county within same state (%) - Multirace
Geographical mobility - Moved from different county within same state (%) - Other Race
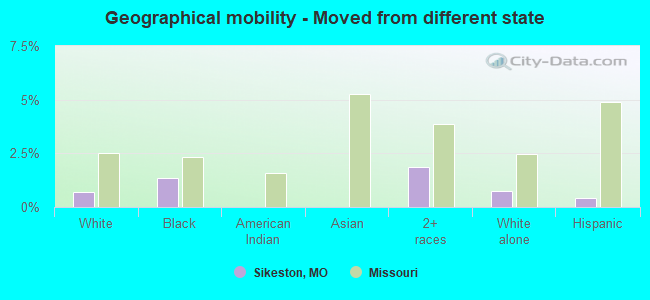
Geographical mobility - Moved from different state (%)
Geographical mobility - Moved from different state (%) - White
Geographical mobility - Moved from different state (%) - Black or African American
Geographical mobility - Moved from different state (%) - Asian
Geographical mobility - Moved from different state (%) - Hispanic or Latino
Geographical mobility - Moved from different state (%) - American Indian and Alaska Native
Geographical mobility - Moved from different state (%) - Multirace
Geographical mobility - Moved from different state (%) - Other Race
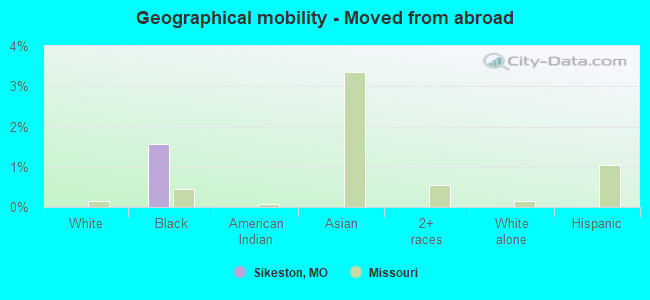
Geographical mobility - Moved from abroad (%)
Geographical mobility - Moved from abroad (%) - White
Geographical mobility - Moved from abroad (%) - Black or African American
Geographical mobility - Moved from abroad (%) - Asian
Geographical mobility - Moved from abroad (%) - Hispanic or Latino
Geographical mobility - Moved from abroad (%) - American Indian and Alaska Native
Geographical mobility - Moved from abroad (%) - Multirace
Geographical mobility - Moved from abroad (%) - Other Race
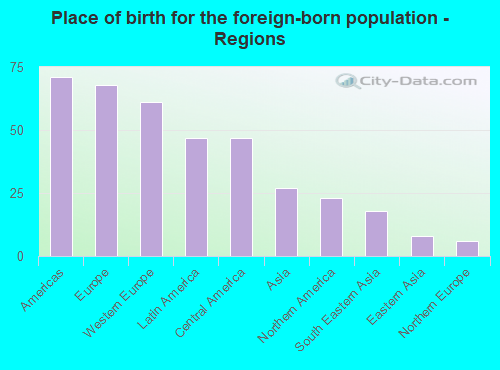
Place of birth for the foreign-born population - Ireland (%)
Place of birth for the foreign-born population - Denmark (%)
Place of birth for the foreign-born population - Norway (%)
Place of birth for the foreign-born population - Sweden (%)
Place of birth for the foreign-born population - United Kingdom (%)
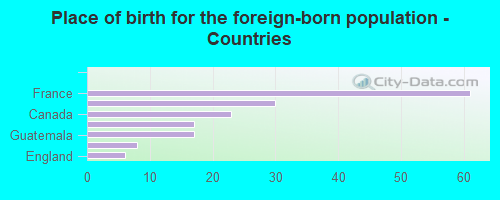
Place of birth for the foreign-born population - England (%)
Place of birth for the foreign-born population - Scotland (%)
Place of birth for the foreign-born population - Other Northern Europe (%)
Place of birth for the foreign-born population - Austria (%)
Place of birth for the foreign-born population - Belgium (%)
Place of birth for the foreign-born population - France (%)
Place of birth for the foreign-born population - Germany (%)
Place of birth for the foreign-born population - Netherlands (%)
Place of birth for the foreign-born population - Switzerland (%)
Place of birth for the foreign-born population - Other Western Europe (%)
Place of birth for the foreign-born population - Greece (%)
Place of birth for the foreign-born population - Italy (%)
Place of birth for the foreign-born population - Portugal (%)
Place of birth for the foreign-born population - Spain (%)
Place of birth for the foreign-born population - Other Southern Europe (%)
Place of birth for the foreign-born population - Albania (%)
Place of birth for the foreign-born population - Belarus (%)
Place of birth for the foreign-born population - Bosnia and Herzegovina (%)
Place of birth for the foreign-born population - Bulgaria (%)
Place of birth for the foreign-born population - Croatia (%)
Place of birth for the foreign-born population - Czechoslovakia (%)
Place of birth for the foreign-born population - Hungary (%)
Place of birth for the foreign-born population - Latvia (%)
Place of birth for the foreign-born population - Lithuania (%)
Place of birth for the foreign-born population - North Macedonia (Macedonia) (%)
Place of birth for the foreign-born population - Moldova (%)
Place of birth for the foreign-born population - Poland (%)
Place of birth for the foreign-born population - Romania (%)
Place of birth for the foreign-born population - Russia (%)
Place of birth for the foreign-born population - Serbia (%)
Place of birth for the foreign-born population - Ukraine (%)
Place of birth for the foreign-born population - Other Eastern Europe (%)
Place of birth for the foreign-born population - China (%)
Place of birth for the foreign-born population - Hong Kong (%)
Place of birth for the foreign-born population - Taiwan (%)
Place of birth for the foreign-born population - Japan (%)
Place of birth for the foreign-born population - Korea (%)
Place of birth for the foreign-born population - Other Eastern Asia (%)
Place of birth for the foreign-born population - Afghanistan (%)
Place of birth for the foreign-born population - Bangladesh (%)
Place of birth for the foreign-born population - India (%)
Place of birth for the foreign-born population - Iran (%)
Place of birth for the foreign-born population - Kazakhstan (%)
Place of birth for the foreign-born population - Nepal (%)
Place of birth for the foreign-born population - Pakistan (%)
Place of birth for the foreign-born population - Sri Lanka (%)
Place of birth for the foreign-born population - Uzbekistan (%)
Place of birth for the foreign-born population - Other South Central Asia (%)
Place of birth for the foreign-born population - Burma (%)
Place of birth for the foreign-born population - Cambodia (%)
Place of birth for the foreign-born population - Indonesia (%)
Place of birth for the foreign-born population - Laos (%)
Place of birth for the foreign-born population - Malaysia (%)
Place of birth for the foreign-born population - Philippines (%)
Place of birth for the foreign-born population - Singapore (%)
Place of birth for the foreign-born population - Thailand (%)
Place of birth for the foreign-born population - Vietnam (%)
Place of birth for the foreign-born population - Other South Eastern Asia (%)
Place of birth for the foreign-born population - Armenia (%)
Place of birth for the foreign-born population - Iraq (%)
Place of birth for the foreign-born population - Israel (%)
Place of birth for the foreign-born population - Jordan (%)
Place of birth for the foreign-born population - Kuwait (%)
Place of birth for the foreign-born population - Lebanon (%)
Place of birth for the foreign-born population - Saudi Arabia (%)
Place of birth for the foreign-born population - Syria (%)
Place of birth for the foreign-born population - Turkey (%)
Place of birth for the foreign-born population - Yemen (%)
Place of birth for the foreign-born population - Other Western Asia (%)
Place of birth for the foreign-born population - Eritrea (%)
Place of birth for the foreign-born population - Ethiopia (%)
Place of birth for the foreign-born population - Kenya (%)
Place of birth for the foreign-born population - Somalia (%)
Place of birth for the foreign-born population - Uganda (%)
Place of birth for the foreign-born population - Zimbabwe (%)
Place of birth for the foreign-born population - Other Eastern Africa (%)
Place of birth for the foreign-born population - Cameroon (%)
Place of birth for the foreign-born population - Congo (%)
Place of birth for the foreign-born population - Democratic Republic of Congo (Zaire) (%)
Place of birth for the foreign-born population - Other Middle Africa (%)
Place of birth for the foreign-born population - Egypt (%)
Place of birth for the foreign-born population - Morocco (%)
Place of birth for the foreign-born population - Sudan (%)
Place of birth for the foreign-born population - Other Northern Africa (%)
Place of birth for the foreign-born population - South Africa (%)
Place of birth for the foreign-born population - Other Southern Africa (%)
Place of birth for the foreign-born population - Cabo Verde (%)
Place of birth for the foreign-born population - Ghana (%)
Place of birth for the foreign-born population - Liberia (%)
Place of birth for the foreign-born population - Nigeria (%)
Place of birth for the foreign-born population - Senegal (%)
Place of birth for the foreign-born population - Sierra Leone (%)
Place of birth for the foreign-born population - Other Western Africa (%)
Place of birth for the foreign-born population - Australia (%)
Place of birth for the foreign-born population - New Zealand (%)
Place of birth for the foreign-born population - Fiji (%)
Place of birth for the foreign-born population - Micronesia (%)
Place of birth for the foreign-born population - Bahamas (%)
Place of birth for the foreign-born population - Barbados (%)
Place of birth for the foreign-born population - Cuba (%)
Place of birth for the foreign-born population - Dominica (%)
Place of birth for the foreign-born population - Dominican Republic (%)
Place of birth for the foreign-born population - Grenada (%)
Place of birth for the foreign-born population - Haiti (%)
Place of birth for the foreign-born population - Jamaica (%)
Place of birth for the foreign-born population - St. Vincent and the Grenadines (%)
Place of birth for the foreign-born population - Trinidad and Tobago (%)
Place of birth for the foreign-born population - West Indies (%)
Place of birth for the foreign-born population - Other Caribbean (%)
Place of birth for the foreign-born population - Belize (%)
Place of birth for the foreign-born population - Costa Rica (%)
Place of birth for the foreign-born population - El Salvador (%)
Place of birth for the foreign-born population - Guatemala (%)
Place of birth for the foreign-born population - Honduras (%)
Place of birth for the foreign-born population - Mexico (%)
Place of birth for the foreign-born population - Nicaragua (%)
Place of birth for the foreign-born population - Panama (%)
Place of birth for the foreign-born population - Other Central America (%)
Place of birth for the foreign-born population - Argentina (%)
Place of birth for the foreign-born population - Bolivia (%)
Place of birth for the foreign-born population - Brazil (%)
Place of birth for the foreign-born population - Chile (%)
Place of birth for the foreign-born population - Colombia (%)
Place of birth for the foreign-born population - Ecuador (%)
Place of birth for the foreign-born population - Guyana (%)
Place of birth for the foreign-born population - Peru (%)
Place of birth for the foreign-born population - Uruguay (%)
Place of birth for the foreign-born population - Venezuela (%)
Place of birth for the foreign-born population - Other South America (%)
Place of birth for the foreign-born population - Canada (%)
Place of birth for the foreign-born population - Other Northern America (%)
Place of birth for the foreign-born population - Other (%)
Latest news about races in Sikeston, MO collected exclusively by city-data.com from local newspapers, TV, and radio stations
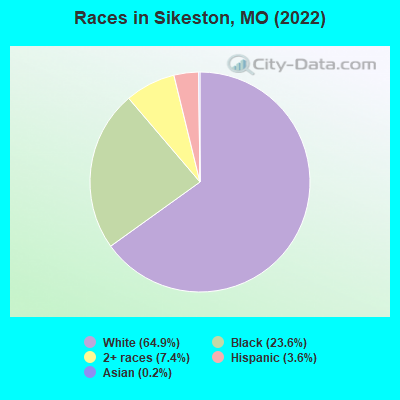
According to 2022 data, the most numerous races in Sikeston, MO are White alone (10,514 residents), Black alone (3,829 residents), and Two or more races (1,196 residents). 96.8% of Sikeston residents speak English at home. 1.0% of Sikeston, MO residents are foreign-born , which is 288.2% less than the foreign-born rate of 4.0% across the entire state of Missouri.
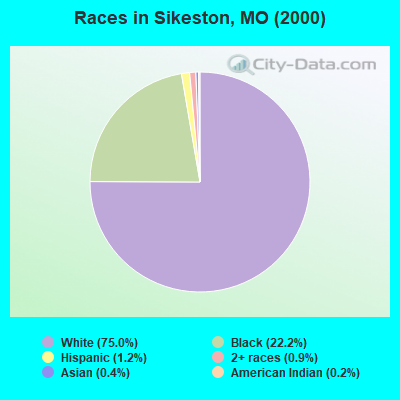
Race distribution in Sikeston
2000 2022
4,686,474 83.8% White alone 625,667 11.2% Black alone 118,592 2.1% Hispanic 71,905 1.3% Two or more races 61,041 1.1% Asian alone 23,302 0.4% American Indian alone 5,291 0.09% Other race alone 2,939 0.05% Native Hawaiian and Other
4,733,411 76.6% White alone 656,739 10.6% Black alone 316,300 5.1% Two or more races 291,763 4.7% Hispanic 132,436 2.1% Asian alone 27,467 0.4% Other race alone 12,313 0.2% American Indian alone 7,528 0.1% Native Hawaiian and Other
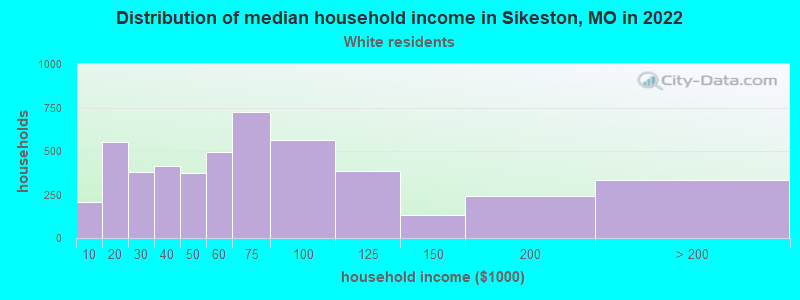
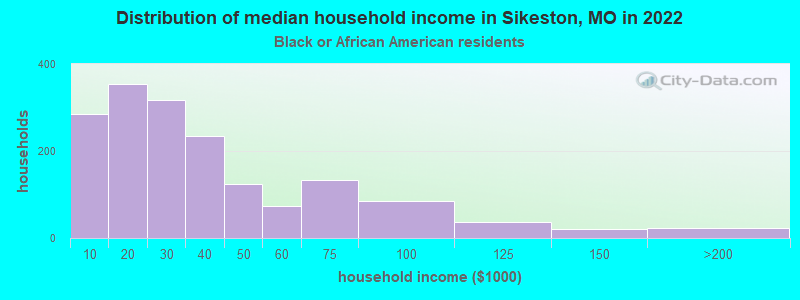
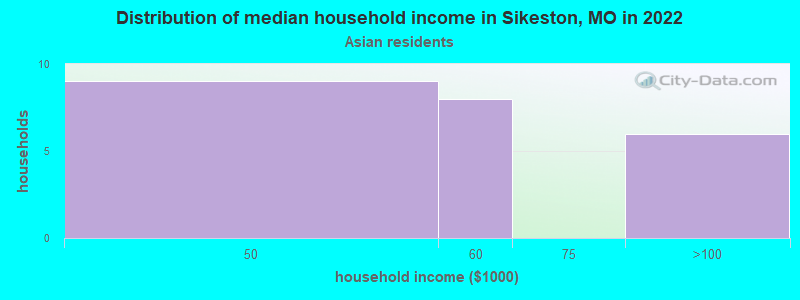
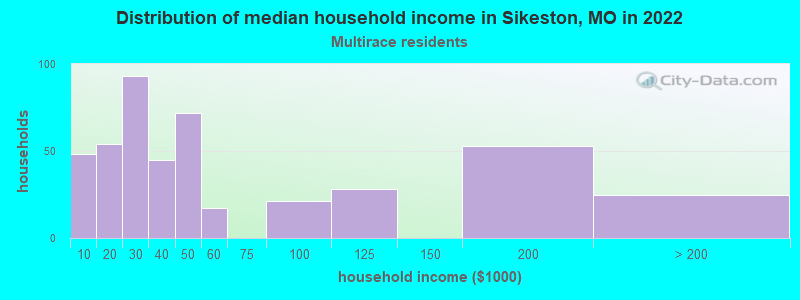
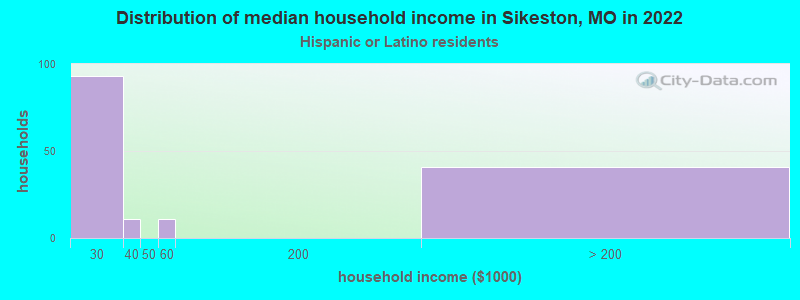
Income and house value in Sikeston Median household income in 2022 $59,894 White non-Hispanic householders$26,812 Black householders$51,725 Asian householders$32,610 Two or more races householdersMedian 2022 house value $177,248 White Non-Hispanic householders$74,748 Black or African American householders$347,783 American Indian or Alaska Native householders $251,773 Asian householders$128,684 Two or more races householders
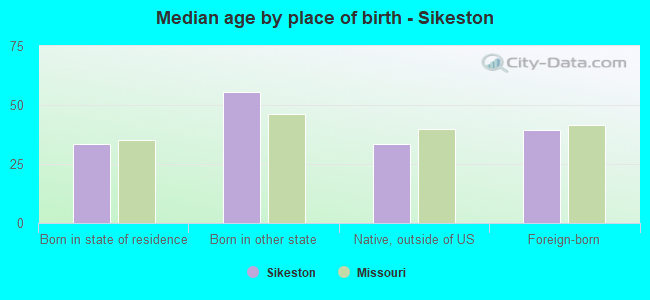
Median age by race in Sikeston
43.7 Median age for White residents41.0 46.6 29.7 Median age for Black or African American residents25.4 34.2 -605,424,321.4 Median age for American Indian / Alaska Native residents-652,291,104.5 -576,856,648.8 43.2 Median age for Asian residents-676,616,914.7 43.0 -693,430,656.2 Median age for Native Hawaiian / Pacific Islander residents-683,513,838.1 -752,136,751.4 -693,236,714.3 Median age for Other race residents-694,252,872.9 -684,343,433.7 25.2 Median age for Two or more races residents38.2 18.6 45.5 Median age for White alone residents43.3 47.0 16.0 Median age for Hispanic or Latino residents16.3 32.9
Owner/renter occupied households by race in Sikeston
House owners and renters - White residents 3,422 71.7% Owner occupied1,352 28.3% Renter occupiedHouse owners and renters - Black or African American residents 562 32.9% Owner occupied1,146 67.1% Renter occupiedHouse owners and renters - Asian residents 26 100.0% Renter occupiedHouse owners and renters - Two or more races residents 174 36.4% Owner occupied305 63.6% Renter occupiedHouse owners and renters - White alone residents 3,376 72.6% Owner occupied1,271 27.4% Renter occupiedHouse owners and renters - Hispanic or Latino residents 67 41.1% Owner occupied96 58.9% Renter occupied
Language usage in Sikeston
English speakers - Total 96.8% of residents of Sikeston speak English at home.
1.9% of residents speak Spanish at home 258 89.3% Speak English very well31 10.7% Speak English less than very well1.2% of residents speak other language at home 182 99.5% Speak English very well1 0.5% Speak English less than very well
English speakers - Born in the United States 91.5% of residents of Sikeston speak English at home.
6.4% of residents speak Spanish at home 233 100.0% Speak English very well2.4% of residents speak other language at home 87 100.0% Speak English very well
All residents speak only English at home
English speakers - Foreign-born 16.8% of residents of Sikeston speak English at home.
28.7% of residents speak Spanish at home 17 35.4% Speak English very well31 64.6% Speak English less than very well53.3% of residents speak other language at home 88 98.9% Speak English very well1 1.1% Speak English less than very well
White (Caucasian) - Speak only English Native:
97.5% (9,770)Foreign-born:
28.3% (24)
White (Caucasian) - Speak another language Native:
2.5% (246)Foreign-born:
71.6% (61)
White alone - Speak only English Native:
98.1% (9,571)Foreign-born:
28.8% (24)
White alone - Speak another language Native:
1.9% (188)Foreign-born:
71.7% (61)
Hispanic or Latino - Speak another language Native:
21.9% (102)Foreign-born:
99.4% (50)
Foreign-born residents in Sikeston 167 residents are foreign born
This city:
1.0%Missouri:
4.2%
Marital status for residents in Sikeston Marital status - White (Caucasian) population 15 years and over
Males 27.3% Never married56.5% Now married2.2% Separated5.1% Widowed8.8% DivorcedFemales 20.9% Never married54.2% Now married0.5% Separated15.0% Widowed9.4% DivorcedWomen who gave birth in the past 12 months Now married:
69.3% (111)Unmarried:
30.7% (49)
Women who did not give birth in the past 12 months Now married:
52.9% (1,014)Unmarried:
47.1% (904)
Marital status - Black or African American population 15 years and over
Males 62.4% Never married22.6% Now married0.0% Separated2.1% Widowed12.9% DivorcedFemales 54.5% Never married14.5% Now married3.8% Separated10.8% Widowed16.4% DivorcedWomen who gave birth in the past 12 months Now married:
11.2% (16)Unmarried:
88.8% (127)
Women who did not give birth in the past 12 months Now married:
14.1% (142)Unmarried:
85.9% (860)
Marital status - American Indian / Alaska Native population 15 years and over
Males 0.0% Never married0.0% Now married0.0% Separated0.0% Widowed100.0% DivorcedFemales 0.0% Never married100.0% Now married0.0% Separated0.0% Widowed0.0% DivorcedWomen who gave birth in the past 12 months Now married:
100.0% (3)Unmarried:
0.0% (0)
Marital status - Two or more races population 15 years and over
Males 29.0% Never married40.8% Now married0.0% Separated11.2% Widowed18.9% DivorcedFemales 33.8% Never married37.4% Now married11.9% Separated1.0% Widowed15.9% DivorcedWomen who did not give birth in the past 12 months Now married:
44.4% (164)Unmarried:
55.6% (206)
Marital status - White alone, not Hispanic / Latino population 15 years and over
Males 26.0% Never married57.3% Now married2.3% Separated5.3% Widowed9.1% DivorcedFemales 21.0% Never married53.6% Now married0.5% Separated15.2% Widowed9.6% DivorcedWomen who gave birth in the past 12 months Now married:
69.3% (112)Unmarried:
30.7% (49)
Women who did not give birth in the past 12 months Now married:
51.0% (952)Unmarried:
49.0% (913)
Marital status - Hispanic or Latino population 15 years and over
Males 64.0% Never married36.0% Now married0.0% Separated0.0% Widowed0.0% DivorcedFemales 12.6% Never married87.4% Now married0.0% Separated0.0% Widowed0.0% DivorcedWomen who did not give birth in the past 12 months Now married:
100.0% (81)Unmarried:
0.0% (0)
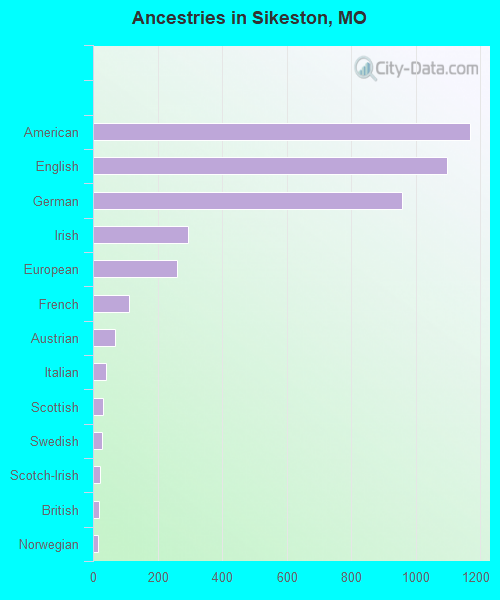
Ancestries in Sikeston
1,168 14.1% American1,095 13.2% English958 11.5% German295 3.5% Irish260 3.1% European112 1.3% French67 0.8% Austrian39 0.5% Italian30 0.4% Scottish27 0.3% Swedish21 0.3% Scotch-Irish18 0.2% British14 0.2% Norwegian10 0.1% Polish9 0.1% Dutch3 0.04% Hungarian2 0.02% Swiss
Children Nativity (place of birth) in Sikeston
Children under 6 years - Living with two parents Both parents native 693 100.0% NativeBoth parents foreign-born 12 100.0% NativeChildren under 6 years - Living with one parent Native parent 693 100.0% Native
Children 6 to 17 years - Living with two parents Both parents native 1,159 100.0% NativeBoth parents foreign-born 24 100.0% NativeOne native, one foreign-born parent 171 100.0% NativeChildren 6 to 17 years - Living with one parent Native parent 905 100.0% Native
Grandparents responsible for own grandchildren in Sikeston
Grandparents (30 to 59 years) White / Caucasian 36 53.3% Responsible for grandchildren31 46.7% Not responsible for grandchildrenBlack or African American 6 100.0% Responsible for grandchildrenWhite alone, not Hispanic / Latino 36 53.2% Responsible for grandchildren32 46.8% Not responsible for grandchildrenGrandparents (60 years and over) White / Caucasian 17 44.2% Responsible for grandchildren21 55.8% Not responsible for grandchildrenBlack or African American 33 55.1% Responsible for grandchildren27 44.9% Not responsible for grandchildrenWhite alone, not Hispanic / Latino 17 43.8% Responsible for grandchildren22 56.2% Not responsible for grandchildren