Races in Silverdale, Washington (WA) Detailed Stats
Data:
Races - White alone (%)
Races - White alone (% change since 2000)
Races - Black alone (%)
Races - Black alone (% change since 2000)
Races - American Indian alone (%)
Races - American Indian alone (% change since 2000)
Races - Asian alone (%)
Races - Asian alone (% change since 2000)
Races - Hispanic (%)
Races - Hispanic (% change since 2000)
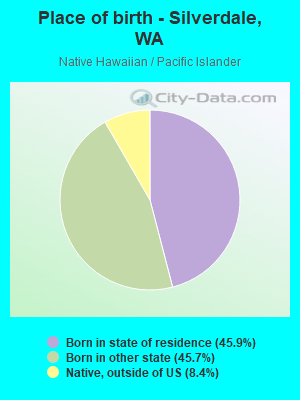
Races - Native Hawaiian and Other Pacific Islander alone (%)
Races - Native Hawaiian and Other Pacific Islander alone (% change since 2000)
Races - Two or more races(%)
Races - Two or more races(% change since 2000)
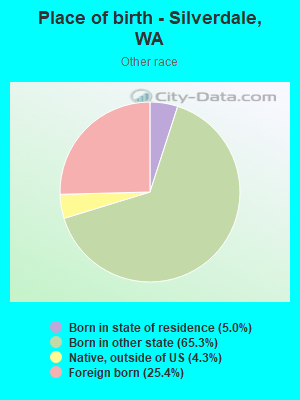
Races - Other race alone (%)
Races - Other race alone (% change since 2000)
Racial diversity
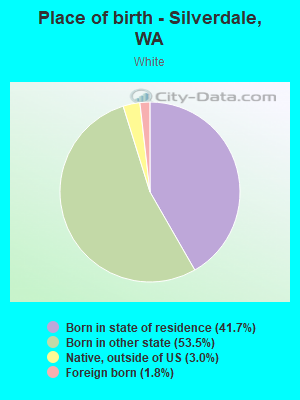
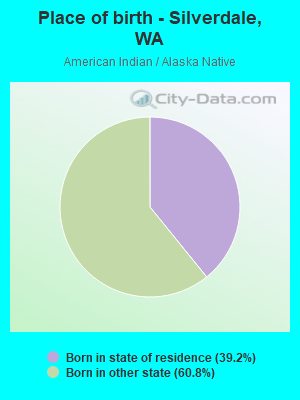
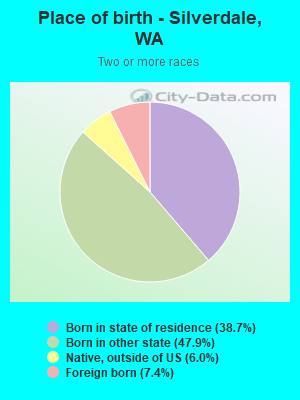
Place of birth - Born in state of residence (%)
Place of birth - Born in state of residence (%) - White
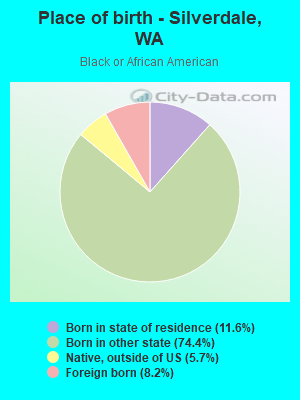
Place of birth - Born in state of residence (%) - Black or African American
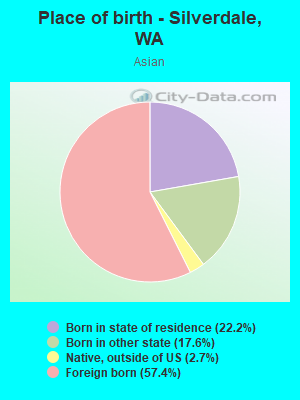
Place of birth - Born in state of residence (%) - Asian
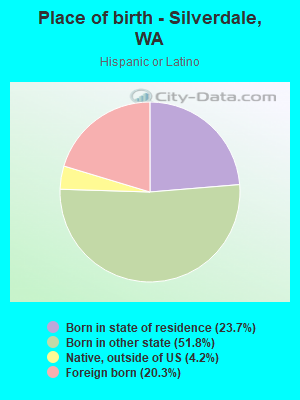
Place of birth - Born in state of residence (%) - Hispanic or Latino
Place of birth - Born in state of residence (%) - American Indian and Alaska Native
Place of birth - Born in state of residence (%) - Multirace
Place of birth - Born in state of residence (%) - Other Race
Place of birth - Born in other state (%)
Place of birth - Born in other state (%) - White
Place of birth - Born in other state (%) - Black or African American
Place of birth - Born in other state (%) - Asian
Place of birth - Born in other state (%) - Hispanic or Latino
Place of birth - Born in other state (%) - American Indian and Alaska Native
Place of birth - Born in other state (%) - Multirace
Place of birth - Born in other state (%) - Other Race
Place of birth - Native, outside of US (%)
Place of birth - Native, outside of US (%) - White
Place of birth - Native, outside of US (%) - Black or African American
Place of birth - Native, outside of US (%) - Asian
Place of birth - Native, outside of US (%) - Hispanic or Latino
Place of birth - Native, outside of US (%) - American Indian and Alaska Native
Place of birth - Native, outside of US (%) - Multirace
Place of birth - Native, outside of US (%) - Other Race
Place of birth - Foreign born (%)
Place of birth - Foreign born (%) - White
Place of birth - Foreign born (%) - Black or African American
Place of birth - Foreign born (%) - Asian
Place of birth - Foreign born (%) - Hispanic or Latino
Place of birth - Foreign born (%) - American Indian and Alaska Native
Place of birth - Foreign born (%) - Multirace
Place of birth - Foreign born (%) - Other Race
Residents speaking English at home (%)
Residents speaking English at home - Born in the United States (%)
Residents speaking English at home - Native, born elsewhere (%)
Residents speaking English at home - Foreign born (%)
Residents speaking Spanish at home (%)
Residents speaking Spanish at home - Born in the United States (%)
Residents speaking Spanish at home - Native, born elsewhere (%)
Residents speaking Spanish at home - Foreign born (%)
Residents speaking other language at home (%)
Residents speaking other language at home - Born in the United States (%)
Residents speaking other language at home - Native, born elsewhere (%)
Residents speaking other language at home - Foreign born (%)
Marital status - Never married (%)
Marital status - Now married (%)
Marital status - Separated (%)
Marital status - Widowed (%)
Marital status - Divorced (%)
Ancestries Reported - Arab (%)
Ancestries Reported - Czech (%)
Ancestries Reported - Danish (%)
Ancestries Reported - Dutch (%)
Ancestries Reported - English (%)
Ancestries Reported - French (%)
Ancestries Reported - French Canadian (%)
Ancestries Reported - German (%)
Ancestries Reported - Greek (%)
Ancestries Reported - Hungarian (%)
Ancestries Reported - Irish (%)
Ancestries Reported - Italian (%)
Ancestries Reported - Lithuanian (%)
Ancestries Reported - Norwegian (%)
Ancestries Reported - Polish (%)
Ancestries Reported - Portuguese (%)
Ancestries Reported - Russian (%)
Ancestries Reported - Scotch-Irish (%)
Ancestries Reported - Scottish (%)
Ancestries Reported - Slovak (%)
Ancestries Reported - Subsaharan African (%)
Ancestries Reported - Swedish (%)
Ancestries Reported - Swiss (%)
Ancestries Reported - Ukrainian (%)
Ancestries Reported - United States (%)
Ancestries Reported - Welsh (%)
Ancestries Reported - West Indian (%)
Ancestries Reported - Other (%)
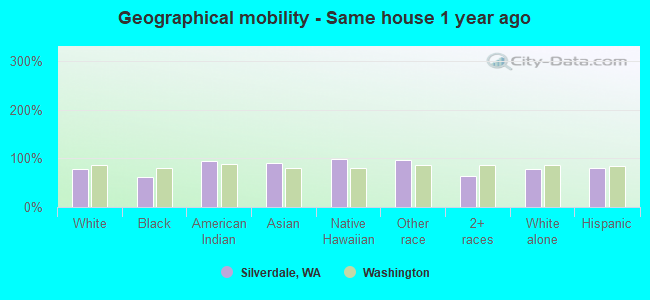
Geographical mobility - Same house 1 year ago (%)
Geographical mobility - Same house 1 year ago (%) - White
Geographical mobility - Same house 1 year ago (%) - Black or African American
Geographical mobility - Same house 1 year ago (%) - Asian
Geographical mobility - Same house 1 year ago (%) - Hispanic or Latino
Geographical mobility - Same house 1 year ago (%) - American Indian and Alaska Native
Geographical mobility - Same house 1 year ago (%) - Multirace
Geographical mobility - Same house 1 year ago (%) - Other Race
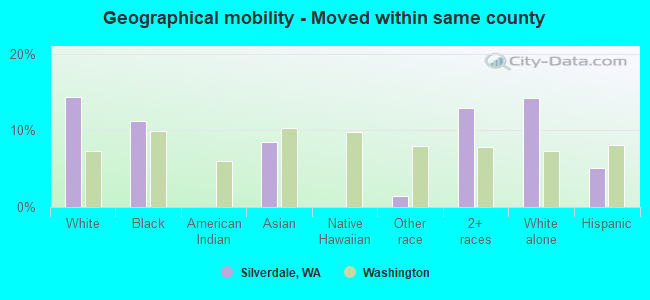
Geographical mobility - Moved within same county (%)
Geographical mobility - Moved within same county (%) - White
Geographical mobility - Moved within same county (%) - Black or African American
Geographical mobility - Moved within same county (%) - Asian
Geographical mobility - Moved within same county (%) - Hispanic or Latino
Geographical mobility - Moved within same county (%) - American Indian and Alaska Native
Geographical mobility - Moved within same county (%) - Multirace
Geographical mobility - Moved within same county (%) - Other Race
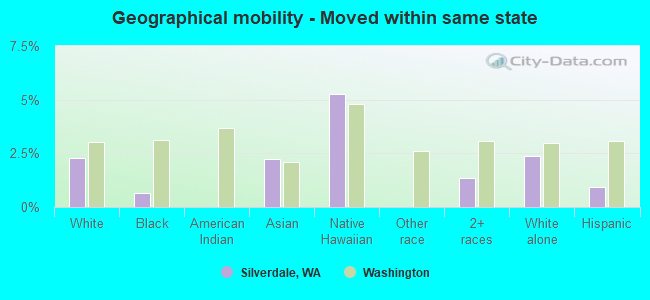
Geographical mobility - Moved from different county within same state (%)
Geographical mobility - Moved from different county within same state (%) - White
Geographical mobility - Moved from different county within same state (%) - Black or African American
Geographical mobility - Moved from different county within same state (%) - Asian
Geographical mobility - Moved from different county within same state (%) - Hispanic or Latino
Geographical mobility - Moved from different county within same state (%) - American Indian and Alaska Native
Geographical mobility - Moved from different county within same state (%) - Multirace
Geographical mobility - Moved from different county within same state (%) - Other Race
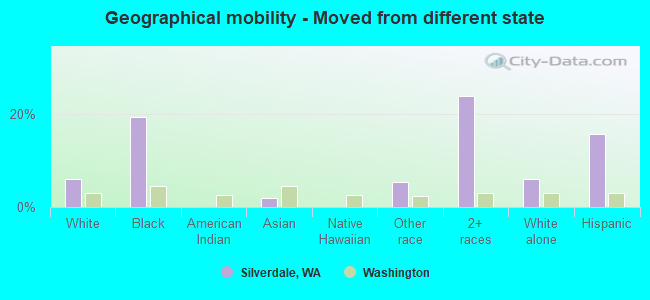
Geographical mobility - Moved from different state (%)
Geographical mobility - Moved from different state (%) - White
Geographical mobility - Moved from different state (%) - Black or African American
Geographical mobility - Moved from different state (%) - Asian
Geographical mobility - Moved from different state (%) - Hispanic or Latino
Geographical mobility - Moved from different state (%) - American Indian and Alaska Native
Geographical mobility - Moved from different state (%) - Multirace
Geographical mobility - Moved from different state (%) - Other Race
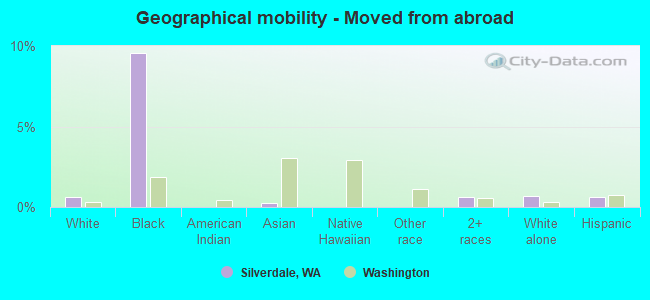
Geographical mobility - Moved from abroad (%)
Geographical mobility - Moved from abroad (%) - White
Geographical mobility - Moved from abroad (%) - Black or African American
Geographical mobility - Moved from abroad (%) - Asian
Geographical mobility - Moved from abroad (%) - Hispanic or Latino
Geographical mobility - Moved from abroad (%) - American Indian and Alaska Native
Geographical mobility - Moved from abroad (%) - Multirace
Geographical mobility - Moved from abroad (%) - Other Race
Place of birth for the foreign-born population - Ireland (%)
Place of birth for the foreign-born population - Denmark (%)
Place of birth for the foreign-born population - Norway (%)
Place of birth for the foreign-born population - Sweden (%)
Place of birth for the foreign-born population - United Kingdom (%)
Place of birth for the foreign-born population - England (%)
Place of birth for the foreign-born population - Scotland (%)
Place of birth for the foreign-born population - Other Northern Europe (%)
Place of birth for the foreign-born population - Austria (%)
Place of birth for the foreign-born population - Belgium (%)
Place of birth for the foreign-born population - France (%)
Place of birth for the foreign-born population - Germany (%)
Place of birth for the foreign-born population - Netherlands (%)
Place of birth for the foreign-born population - Switzerland (%)
Place of birth for the foreign-born population - Other Western Europe (%)
Place of birth for the foreign-born population - Greece (%)
Place of birth for the foreign-born population - Italy (%)
Place of birth for the foreign-born population - Portugal (%)
Place of birth for the foreign-born population - Spain (%)
Place of birth for the foreign-born population - Other Southern Europe (%)
Place of birth for the foreign-born population - Albania (%)
Place of birth for the foreign-born population - Belarus (%)
Place of birth for the foreign-born population - Bosnia and Herzegovina (%)
Place of birth for the foreign-born population - Bulgaria (%)
Place of birth for the foreign-born population - Croatia (%)
Place of birth for the foreign-born population - Czechoslovakia (%)
Place of birth for the foreign-born population - Hungary (%)
Place of birth for the foreign-born population - Latvia (%)
Place of birth for the foreign-born population - Lithuania (%)
Place of birth for the foreign-born population - North Macedonia (Macedonia) (%)
Place of birth for the foreign-born population - Moldova (%)
Place of birth for the foreign-born population - Poland (%)
Place of birth for the foreign-born population - Romania (%)
Place of birth for the foreign-born population - Russia (%)
Place of birth for the foreign-born population - Serbia (%)
Place of birth for the foreign-born population - Ukraine (%)
Place of birth for the foreign-born population - Other Eastern Europe (%)
Place of birth for the foreign-born population - China (%)
Place of birth for the foreign-born population - Hong Kong (%)
Place of birth for the foreign-born population - Taiwan (%)
Place of birth for the foreign-born population - Japan (%)
Place of birth for the foreign-born population - Korea (%)
Place of birth for the foreign-born population - Other Eastern Asia (%)
Place of birth for the foreign-born population - Afghanistan (%)
Place of birth for the foreign-born population - Bangladesh (%)
Place of birth for the foreign-born population - India (%)
Place of birth for the foreign-born population - Iran (%)
Place of birth for the foreign-born population - Kazakhstan (%)
Place of birth for the foreign-born population - Nepal (%)
Place of birth for the foreign-born population - Pakistan (%)
Place of birth for the foreign-born population - Sri Lanka (%)
Place of birth for the foreign-born population - Uzbekistan (%)
Place of birth for the foreign-born population - Other South Central Asia (%)
Place of birth for the foreign-born population - Burma (%)
Place of birth for the foreign-born population - Cambodia (%)
Place of birth for the foreign-born population - Indonesia (%)
Place of birth for the foreign-born population - Laos (%)
Place of birth for the foreign-born population - Malaysia (%)
Place of birth for the foreign-born population - Philippines (%)
Place of birth for the foreign-born population - Singapore (%)
Place of birth for the foreign-born population - Thailand (%)
Place of birth for the foreign-born population - Vietnam (%)
Place of birth for the foreign-born population - Other South Eastern Asia (%)
Place of birth for the foreign-born population - Armenia (%)
Place of birth for the foreign-born population - Iraq (%)
Place of birth for the foreign-born population - Israel (%)
Place of birth for the foreign-born population - Jordan (%)
Place of birth for the foreign-born population - Kuwait (%)
Place of birth for the foreign-born population - Lebanon (%)
Place of birth for the foreign-born population - Saudi Arabia (%)
Place of birth for the foreign-born population - Syria (%)
Place of birth for the foreign-born population - Turkey (%)
Place of birth for the foreign-born population - Yemen (%)
Place of birth for the foreign-born population - Other Western Asia (%)
Place of birth for the foreign-born population - Eritrea (%)
Place of birth for the foreign-born population - Ethiopia (%)
Place of birth for the foreign-born population - Kenya (%)
Place of birth for the foreign-born population - Somalia (%)
Place of birth for the foreign-born population - Uganda (%)
Place of birth for the foreign-born population - Zimbabwe (%)
Place of birth for the foreign-born population - Other Eastern Africa (%)
Place of birth for the foreign-born population - Cameroon (%)
Place of birth for the foreign-born population - Congo (%)
Place of birth for the foreign-born population - Democratic Republic of Congo (Zaire) (%)
Place of birth for the foreign-born population - Other Middle Africa (%)
Place of birth for the foreign-born population - Egypt (%)
Place of birth for the foreign-born population - Morocco (%)
Place of birth for the foreign-born population - Sudan (%)
Place of birth for the foreign-born population - Other Northern Africa (%)
Place of birth for the foreign-born population - South Africa (%)
Place of birth for the foreign-born population - Other Southern Africa (%)
Place of birth for the foreign-born population - Cabo Verde (%)
Place of birth for the foreign-born population - Ghana (%)
Place of birth for the foreign-born population - Liberia (%)
Place of birth for the foreign-born population - Nigeria (%)
Place of birth for the foreign-born population - Senegal (%)
Place of birth for the foreign-born population - Sierra Leone (%)
Place of birth for the foreign-born population - Other Western Africa (%)
Place of birth for the foreign-born population - Australia (%)
Place of birth for the foreign-born population - New Zealand (%)
Place of birth for the foreign-born population - Fiji (%)
Place of birth for the foreign-born population - Micronesia (%)
Place of birth for the foreign-born population - Bahamas (%)
Place of birth for the foreign-born population - Barbados (%)
Place of birth for the foreign-born population - Cuba (%)
Place of birth for the foreign-born population - Dominica (%)
Place of birth for the foreign-born population - Dominican Republic (%)
Place of birth for the foreign-born population - Grenada (%)
Place of birth for the foreign-born population - Haiti (%)
Place of birth for the foreign-born population - Jamaica (%)
Place of birth for the foreign-born population - St. Vincent and the Grenadines (%)
Place of birth for the foreign-born population - Trinidad and Tobago (%)
Place of birth for the foreign-born population - West Indies (%)
Place of birth for the foreign-born population - Other Caribbean (%)
Place of birth for the foreign-born population - Belize (%)
Place of birth for the foreign-born population - Costa Rica (%)
Place of birth for the foreign-born population - El Salvador (%)
Place of birth for the foreign-born population - Guatemala (%)
Place of birth for the foreign-born population - Honduras (%)
Place of birth for the foreign-born population - Mexico (%)
Place of birth for the foreign-born population - Nicaragua (%)
Place of birth for the foreign-born population - Panama (%)
Place of birth for the foreign-born population - Other Central America (%)
Place of birth for the foreign-born population - Argentina (%)
Place of birth for the foreign-born population - Bolivia (%)
Place of birth for the foreign-born population - Brazil (%)
Place of birth for the foreign-born population - Chile (%)
Place of birth for the foreign-born population - Colombia (%)
Place of birth for the foreign-born population - Ecuador (%)
Place of birth for the foreign-born population - Guyana (%)
Place of birth for the foreign-born population - Peru (%)
Place of birth for the foreign-born population - Uruguay (%)
Place of birth for the foreign-born population - Venezuela (%)
Place of birth for the foreign-born population - Other South America (%)
Place of birth for the foreign-born population - Canada (%)
Place of birth for the foreign-born population - Other Northern America (%)
Place of birth for the foreign-born population - Other (%)
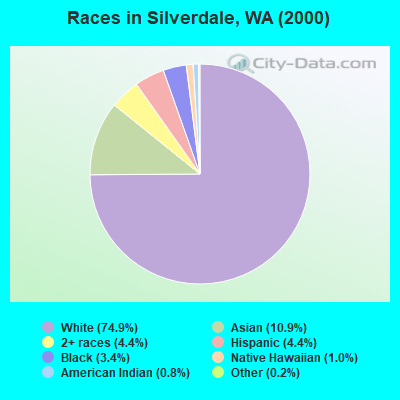
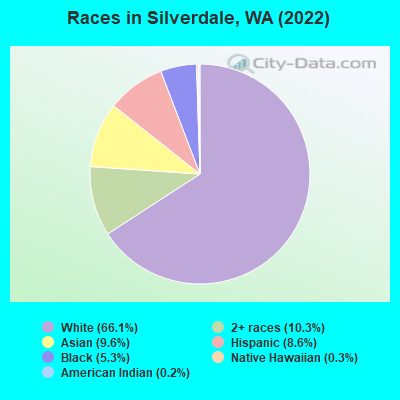
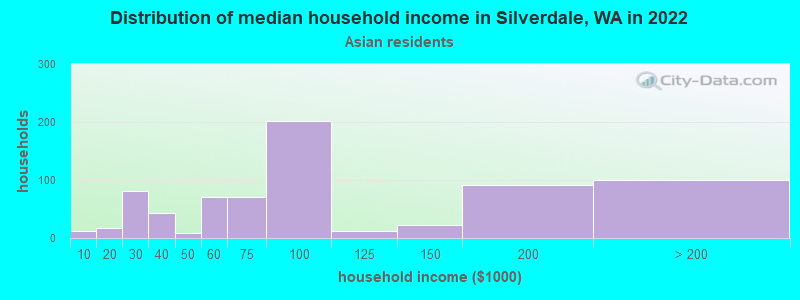
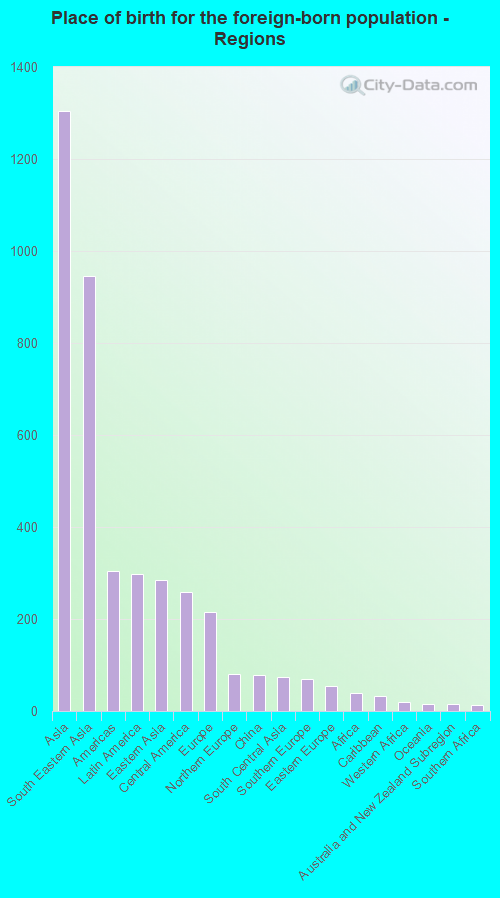
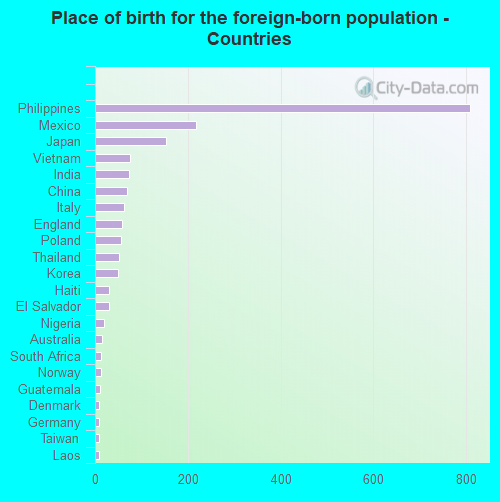
According to 2022 data, the most numerous races in Silverdale, WA are White alone (14,521 residents), Hispanic (1,898 residents), and Asian alone (2,117 residents). 89.9% of Silverdale residents speak English at home. 8.6% of Silverdale, WA residents are foreign-born (5.8% born in Asia, 1.3% born in Latin America, 0.9% born in Europe), which is 75.2% less than the foreign-born rate of 15.0% across the entire state of Washington.
Race distribution in Silverdale
2000 2022
4,652,490 78.9% White alone 441,509 7.5% Hispanic 319,401 5.4% Asian alone 184,631 3.1% Black alone 175,926 3.0% Two or more races 85,396 1.4% American Indian alone 22,779 0.4% Native Hawaiian and Other 11,989 0.2% Other race alone
4,941,456 63.5% White alone 1,093,313 14.0% Hispanic 755,832 9.7% Asian alone 523,448 6.7% Two or more races 299,537 3.8% Black alone 69,024 0.9% American Indian alone 52,231 0.7% Native Hawaiian and Other 50,945 0.7% Other race alone
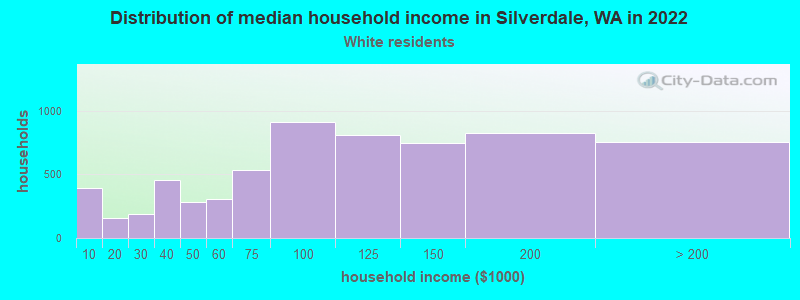
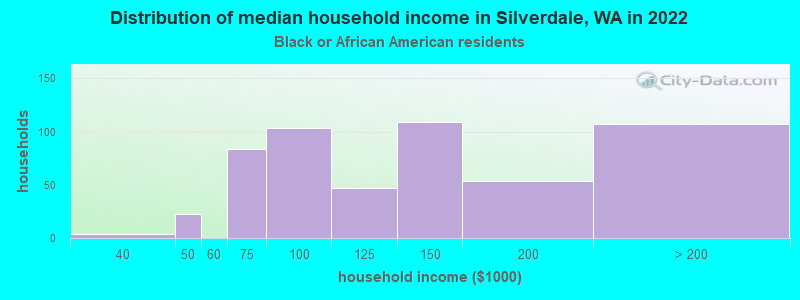
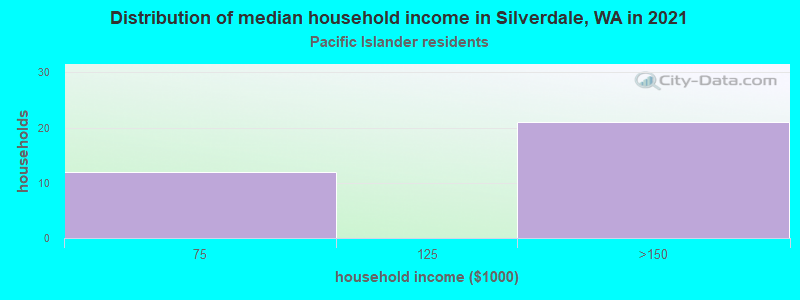
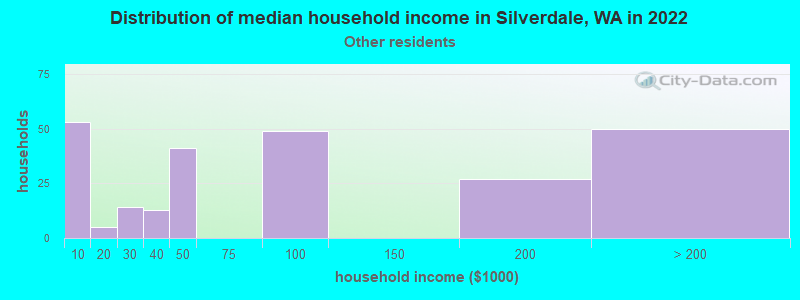
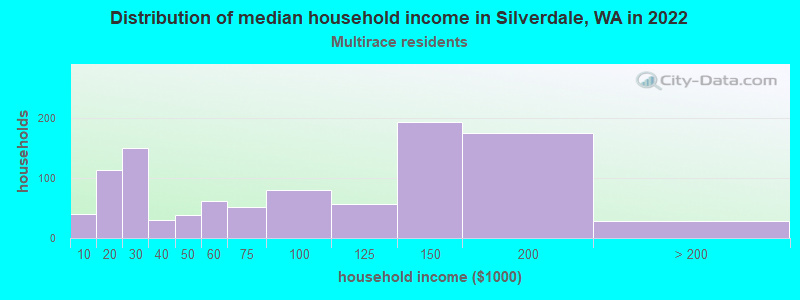
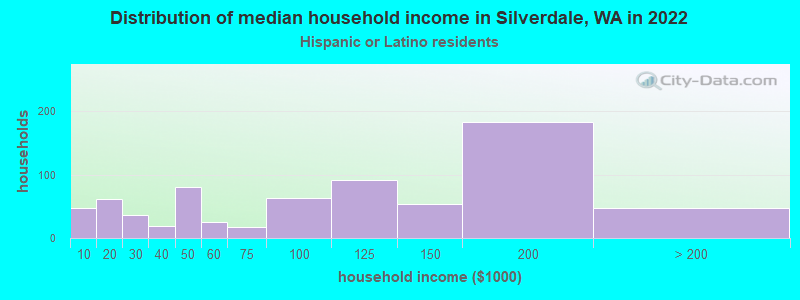
Income and house value in Silverdale Median household income in 2022 $99,056 White non-Hispanic householders$127,641 Black householders$106,128 Asian householders$170,920 Native Hawaiian and other Pacific Islander householders$96,809 Two or more races householders$95,650 Hispanic or Latino race householdersMedian 2022 house value $538,482 White Non-Hispanic householders$472,856 Black or African American householders$576,438 American Indian or Alaska Native householders $582,114 Asian householders$665,121 Native Hawaiian and other Pacific Islander householders$629,648 Some other race householders$502,654 Two or more races householders$492,367 Hispanic or Latino householders
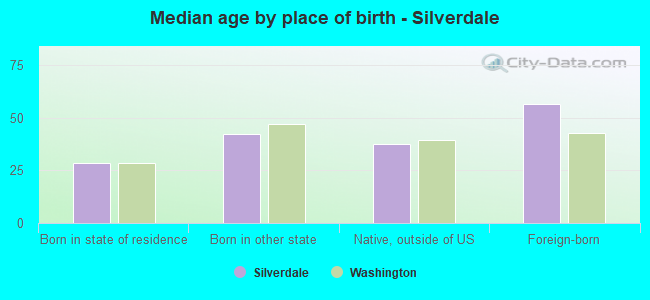
Median age by race in Silverdale
40.6 Median age for White residents39.6 43.6 32.8 Median age for Black or African American residents30.7 36.1 37.6 Median age for American Indian / Alaska Native residents32.0 52.0 48.6 Median age for Asian residents42.2 50.4 35.0 Median age for Native Hawaiian / Pacific Islander residents-639,639,639.0 39.5 28.2 Median age for Other race residents23.7 44.9 25.1 Median age for Two or more races residents26.4 23.2 41.3 Median age for White alone residents40.0 43.7 29.9 Median age for Hispanic or Latino residents29.0 32.8
Owner/renter occupied households by race in Silverdale
House owners and renters - White residents 3,463 54.5% Owner occupied2,896 45.5% Renter occupiedHouse owners and renters - Black or African American residents 84 19.4% Owner occupied350 80.6% Renter occupiedHouse owners and renters - American Indian / Alaska Native residents 8 100.0% Owner occupiedHouse owners and renters - Asian residents 522 71.3% Owner occupied210 28.7% Renter occupiedHouse owners and renters - Native Hawaiian / Pacific Islander residents 27 92.1% Owner occupied2 7.9% Renter occupiedHouse owners and renters - Other race residents 123 42.3% Owner occupied168 57.7% Renter occupiedHouse owners and renters - Two or more races residents 462 50.9% Owner occupied445 49.1% Renter occupiedHouse owners and renters - White alone residents 3,393 54.8% Owner occupied2,801 45.2% Renter occupiedHouse owners and renters - Hispanic or Latino residents 339 48.4% Owner occupied361 51.6% Renter occupied
Language usage in Silverdale
English speakers - Total 89.9% of residents of Silverdale speak English at home.
2.7% of residents speak Spanish at home 319 56.9% Speak English very well242 43.1% Speak English less than very well7.3% of residents speak other language at home 1,024 67.9% Speak English very well483 32.1% Speak English less than very well
English speakers - Born in the United States 95.8% of residents of Silverdale speak English at home.
2.7% of residents speak Spanish at home 191 67.0% Speak English very well94 33.0% Speak English less than very well1.6% of residents speak other language at home 172 100.0% Speak English very well
English speakers - Native, born elsewhere 88.5% of residents of Silverdale speak English at home.
4.1% of residents speak Spanish at home 30 100.0% Speak English very well9.6% of residents speak other language at home 63 88.7% Speak English very well8 11.3% Speak English less than very well
English speakers - Foreign-born 29.4% of residents of Silverdale speak English at home.
12.3% of residents speak Spanish at home 77 31.2% Speak English very well170 68.8% Speak English less than very well54.5% of residents speak other language at home 633 57.9% Speak English very well461 42.1% Speak English less than very well
White (Caucasian) - Speak only English Native:
98.0% (13,820)Foreign-born:
68.3% (183)
White (Caucasian) - Speak another language Native:
2.0% (275)Foreign-born:
24.4% (65)
Black or African American - Speak only English Native:
99.8% (1,036)Foreign-born:
100.0% (53)
Asian - Speak only English Native:
96.5% (762)Foreign-born:
21.1% (257)
Asian - Speak another language Native:
7.6% (60)Foreign-born:
78.6% (957)
Other race - Speak only English Native:
71.6% (364)Foreign-born:
12.6% (20)
Other race - Speak another language Native:
27.7% (141)Foreign-born:
91.5% (144)
Two or more races - Speak only English Native:
93.6% (2,380)Foreign-born:
55.1% (126)
Two or more races - Speak another language Native:
6.2% (158)Foreign-born:
37.1% (84)
White alone - Speak only English Native:
98.4% (13,456)Foreign-born:
70.1% (183)
White alone - Speak another language Native:
1.6% (217)Foreign-born:
15.2% (39)
Hispanic or Latino - Speak only English Native:
84.4% (1,153)Foreign-born:
23.7% (88)
Hispanic or Latino - Speak another language Native:
15.0% (205)Foreign-born:
67.5% (251)
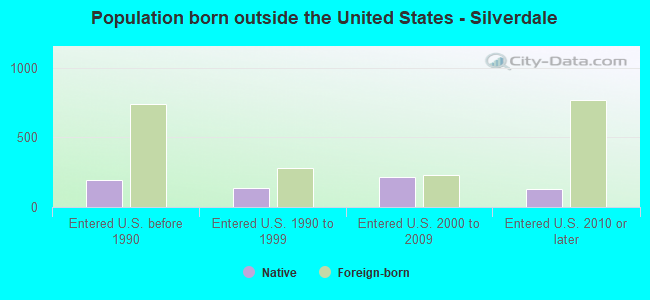
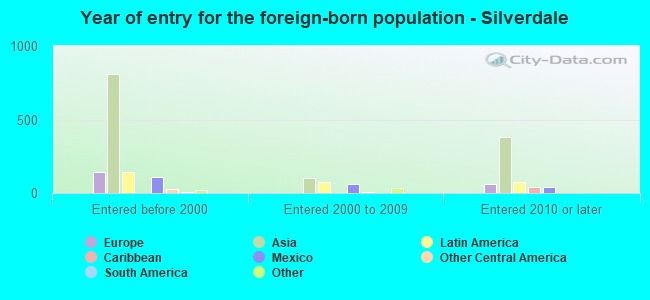
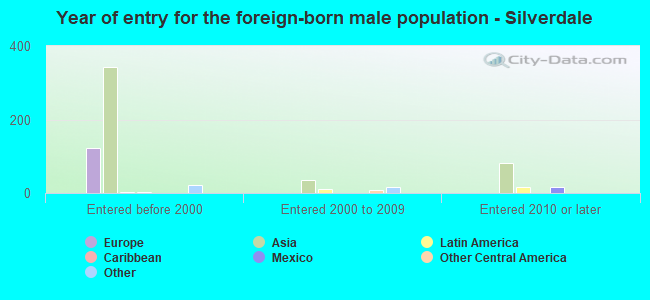
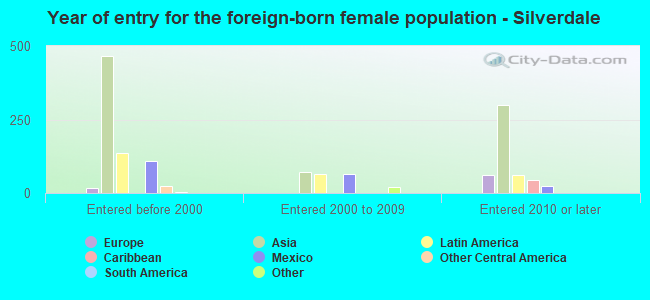
Foreign-born residents in Silverdale 1,880 residents are foreign born (5.8% Asia , 1.3% Latin America , 0.9% Europe ).
This city:
8.6%Washington:
14.9%
Marital status for residents in Silverdale Marital status - White (Caucasian) population 15 years and over
Males 28.9% Never married53.1% Now married1.9% Separated2.4% Widowed13.7% DivorcedFemales 23.8% Never married49.6% Now married2.2% Separated8.8% Widowed15.5% DivorcedWomen who gave birth in the past 12 months Now married:
100.0% (55)Unmarried:
0.0% (0)
Women who did not give birth in the past 12 months Now married:
51.3% (1,706)Unmarried:
48.7% (1,618)
Marital status - Black or African American population 15 years and over
Males 23.9% Never married69.6% Now married0.0% Separated0.0% Widowed6.5% DivorcedFemales 32.0% Never married63.2% Now married0.0% Separated0.0% Widowed4.8% DivorcedWomen who gave birth in the past 12 months Now married:
100.0% (9)Unmarried:
0.0% (0)
Women who did not give birth in the past 12 months Now married:
59.2% (215)Unmarried:
40.8% (148)
Marital status - American Indian / Alaska Native population 15 years and over
Males 38.5% Never married30.8% Now married0.0% Separated30.8% Widowed0.0% DivorcedFemales 0.0% Never married45.5% Now married0.0% Separated54.5% Widowed0.0% DivorcedMarital status - Asian population 15 years and over
Males 31.2% Never married60.2% Now married1.3% Separated1.4% Widowed5.8% DivorcedFemales 23.9% Never married66.9% Now married0.5% Separated3.8% Widowed4.9% DivorcedWomen who gave birth in the past 12 months Now married:
100.0% (17)Unmarried:
0.0% (0)
Women who did not give birth in the past 12 months Now married:
51.1% (280)Unmarried:
48.9% (268)
Marital status - Native Hawaiian / Pacific Islander population 15 years and over
Males 50.0% Never married50.0% Now married0.0% Separated0.0% Widowed0.0% DivorcedFemales 0.0% Never married72.7% Now married0.0% Separated27.3% Widowed0.0% DivorcedWomen who did not give birth in the past 12 months Now married:
100.0% (38)Unmarried:
0.0% (0)
Marital status - Other race population 15 years and over
Males 38.7% Never married61.3% Now married0.0% Separated0.0% Widowed0.0% DivorcedFemales 26.4% Never married52.4% Now married0.0% Separated19.6% Widowed1.6% DivorcedWomen who gave birth in the past 12 months Now married:
100.0% (18)Unmarried:
0.0% (0)
Women who did not give birth in the past 12 months Now married:
90.6% (113)Unmarried:
9.4% (12)
Marital status - Two or more races population 15 years and over
Males 61.1% Never married36.7% Now married1.3% Separated1.0% Widowed0.0% DivorcedFemales 48.4% Never married35.9% Now married5.9% Separated8.3% Widowed1.5% DivorcedWomen who gave birth in the past 12 months Now married:
100.0% (37)Unmarried:
0.0% (0)
Women who did not give birth in the past 12 months Now married:
35.4% (300)Unmarried:
64.6% (548)
Marital status - White alone, not Hispanic / Latino population 15 years and over
Males 28.8% Never married52.9% Now married1.9% Separated2.5% Widowed13.8% DivorcedFemales 24.6% Never married49.5% Now married2.3% Separated7.8% Widowed15.8% DivorcedWomen who gave birth in the past 12 months Now married:
100.0% (42)Unmarried:
0.0% (0)
Women who did not give birth in the past 12 months Now married:
50.5% (1,647)Unmarried:
49.5% (1,612)
Marital status - Hispanic or Latino population 15 years and over
Males 31.2% Never married63.7% Now married0.0% Separated1.1% Widowed4.0% DivorcedFemales 23.2% Never married48.6% Now married2.1% Separated24.1% Widowed2.0% DivorcedWomen who gave birth in the past 12 months Now married:
100.0% (29)Unmarried:
0.0% (0)
Women who did not give birth in the past 12 months Now married:
68.0% (263)Unmarried:
32.0% (124)
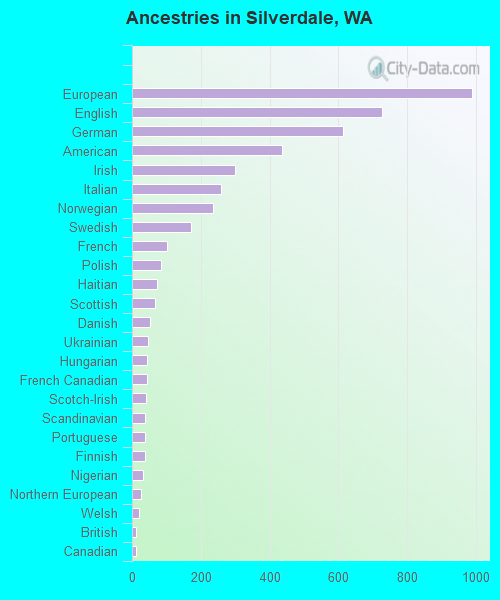
Ancestries in Silverdale
989 11.5% European727 8.5% English614 7.1% German437 5.1% American300 3.5% Irish260 3.0% Italian237 2.8% Norwegian172 2.0% Swedish103 1.2% French84 1.0% Polish74 0.9% Haitian67 0.8% Scottish52 0.6% Danish46 0.5% Ukrainian45 0.5% Hungarian44 0.5% French Canadian42 0.5% Scotch-Irish39 0.5% Scandinavian38 0.4% Portuguese37 0.4% Finnish31 0.4% Nigerian27 0.3% Northern European19 0.2% Welsh13 0.2% British12 0.1% Canadian12 0.1% African10 0.1% British West Indian8 0.09% Russian4 0.05% Lebanese4 0.05% Eastern European4 0.05% Jamaican
Geographical mobility in Silverdale Same house 1 year ago 11,662 78.1% White (Caucasian)768 62.1% Black or African American52 93.7% American Indian / Alaska Native1,896 90.3% Asian75 98.6% Native Hawaiian / Pacific Islander601 96.5% Other race1,996 64.6% Two or more races11,302 78.1% White alone, not Hispanic / Latino1,503 81.0% Hispanic or LatinoMoved within same county 2,136 14.3% White / Caucasian138 11.2% Black or African American177 8.4% Asian9 1.4% Other race400 12.9% Two or more races2,051 14.2% White alone, not Hispanic / Latino95 5.1% Hispanic or LatinoMoved within same state 340 2.3% White / Caucasian8 0.7% Black or African American47 2.3% Asian4 5.3% Native Hawaiian / Pacific Islander41 1.3% Two or more races344 2.4% White alone, not Hispanic / Latino17 0.9% Hispanic or LatinoMoved from different state 895 6.0% White / Caucasian239 19.3% Black or African American40 1.9% Asian34 5.4% Other race732 23.7% Two or more races879 6.1% White alone, not Hispanic / Latino289 15.6% Hispanic or LatinoMoved from abroad 94 0.6% White118 9.5% Black or African American5 0.2% Asian19 0.6% Two or more races95 0.7% White alone, not Hispanic / Latino12 0.6% Hispanic or Latino
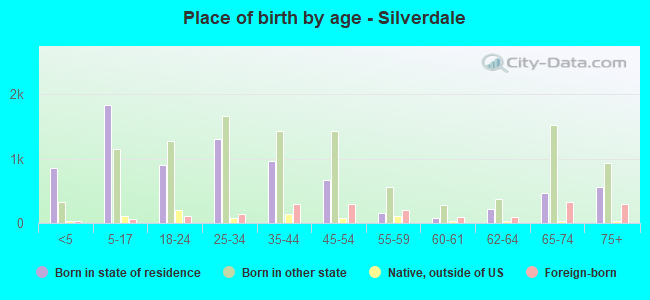
Children Nativity (place of birth) in Silverdale
Children under 6 years - Living with two parents Both parents native 801 100.0% NativeBoth parents foreign-born 76 100.0% NativeOne native, one foreign-born parent 17 100.0% NativeChildren under 6 years - Living with one parent Native parent 530 100.0% NativeChildren 6 to 17 years - Living with two parents Both parents native 1,698 98.6% Native25 1.4% Foreign-bornBoth parents foreign-born 63 100.0% NativeOne native, one foreign-born parent 129 90.5% Native14 9.5% Foreign-bornChildren 6 to 17 years - Living with one parent Native parent 755 100.0% Native
Grandparents responsible for own grandchildren in Silverdale
Grandparents (30 to 59 years) White / Caucasian 74 68.0% Responsible for grandchildren35 32.0% Not responsible for grandchildrenBlack or African American 9 100.0% Not responsible for grandchildrenAsian 6 25.5% Responsible for grandchildren17 74.5% Not responsible for grandchildrenNative Hawaiian / Pacific Islander 4 100.0% Not responsible for grandchildrenOther race 9 100.0% Responsible for grandchildrenWhite alone, not Hispanic / Latino 77 67.6% Responsible for grandchildren37 32.4% Not responsible for grandchildrenHispanic or Latino 13 100.0% Responsible for grandchildrenGrandparents (60 years and over) White / Caucasian 40 28.5% Responsible for grandchildren99 71.5% Not responsible for grandchildrenBlack or African American 13 100.0% Responsible for grandchildrenAsian 9 28.6% Responsible for grandchildren22 71.4% Not responsible for grandchildrenNative Hawaiian / Pacific Islander 20 100.0% Not responsible for grandchildrenOther race 7 100.0% Not responsible for grandchildrenWhite alone, not Hispanic / Latino 40 29.1% Responsible for grandchildren96 70.9% Not responsible for grandchildrenHispanic or Latino 29 100.0% Not responsible for grandchildren