Races in Silverton, Oregon (OR) Detailed Stats
Ancestries, Foreign-born residents, place of birth
Settings
X


Recent posts about races in Silverton, Oregon on our local forum with over 2,400,000 registered users:
 | Question on living in Silverton (8 replies) |
| Salem vs Bend (12 replies) |
| Favorite Areas? (10 replies) |
| Some questions about the Salem Silverton area (3 replies) |
| What's wrong with Salem? (105 replies) |
| Info on Silverton, Oregon please? (5 replies) |
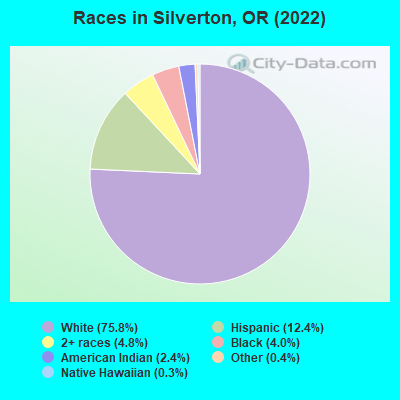
According to 2022 data, the most numerous races in Silverton, OR are White alone (7,936 residents), Hispanic (1,297 residents), and Two or more races (499 residents). 89.1% of Silverton residents speak English at home. 5.0% of Silverton, OR residents are foreign-born (1.4% born in Latin America, 1.0% born in Asia, 0.9% born in North America, 0.7% born in Africa, 0.7% born in Europe), which is 79.1% less than the foreign-born rate of 9.0% across the entire state of Oregon.
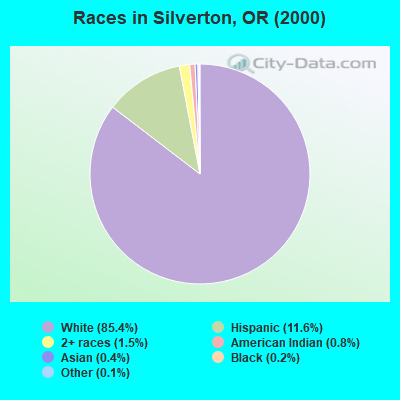
Race distribution in Silverton
2000
2022

- 6,33085.4%White alone
- 85711.6%Hispanic
- 1141.5%Two or more races
- 570.8%American Indian alone
- 290.4%Asian alone
- 140.2%Black alone
- 100.1%Other race alone
- 30.04%Native Hawaiian and Other
Pacific Islander alone
-
- 7,93675.8%White alone
- 1,29712.4%Hispanic
- 4994.8%Two or more races
- 4144.0%Black alone
- 2532.4%American Indian alone
- 420.4%Other race alone
- 290.3%Native Hawaiian and Other
Pacific Islander alone - 60.06%Asian alone
2000
2022
-
- 2,857,61683.5%White alone
- 275,3148.0%Hispanic
- 100,3332.9%Asian alone
- 82,7332.4%Two or more races
- 53,3251.6%Black alone
- 40,1301.2%American Indian alone
- 7,3980.2%Native Hawaiian and Other
Pacific Islander alone - 4,5500.1%Other race alone

-
- 3,037,57171.6%White alone
- 609,53814.4%Hispanic
- 252,7446.0%Two or more races
- 191,2834.5%Asian alone
- 78,2281.8%Black alone
- 29,3990.7%American Indian alone
- 25,7310.6%Other race alone
- 15,6430.4%Native Hawaiian and Other
Pacific Islander alone

Income and house value in Silverton
- Median household income in 2022
- $79,838White non-Hispanic householders
- $88,711Some other race householders
- $47,328Two or more races householders
- $58,297Hispanic or Latino race householders
- Median 2022 house value
- $473,228White Non-Hispanic householders
- $688,277American Indian or Alaska Native householders
- $497,089Asian householders
- $290,605Some other race householders
- $260,015Two or more races householders
- $292,441Hispanic or Latino householders
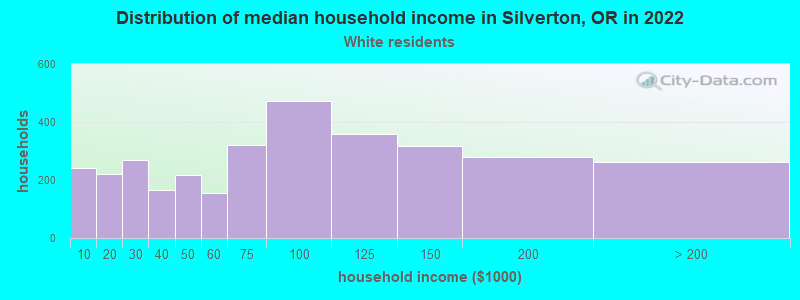
Household income for White non-Hispanic householders
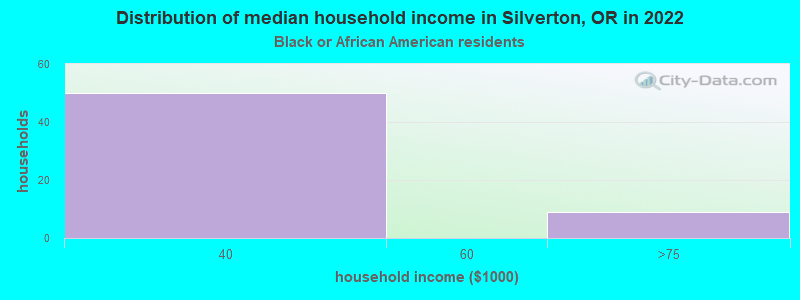
Household income for Black householders
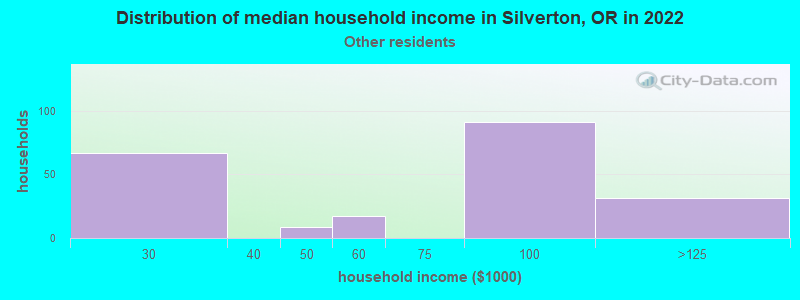
Household income for Some other race householders
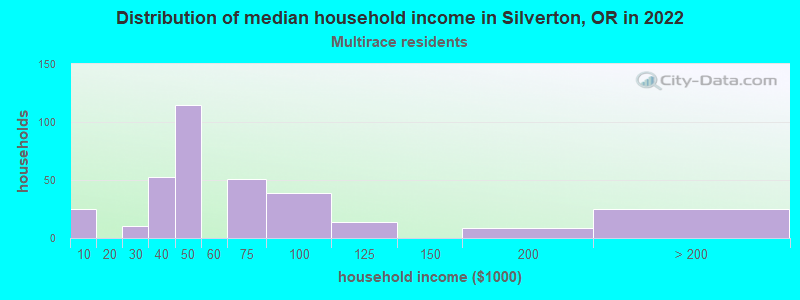
Household income for Two or more races householders
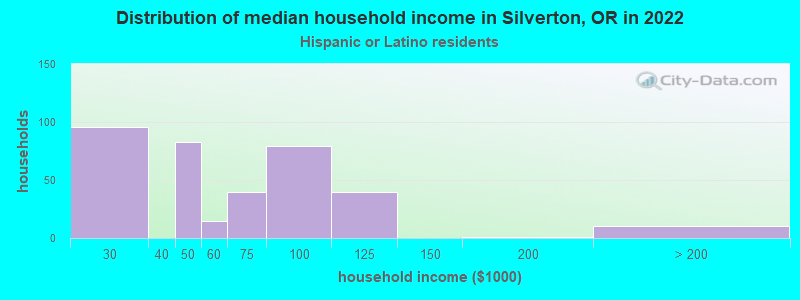
Household income for Hispanic or Latino race householders
Median age by race in Silverton
- 43.3Median age for White residents
- 41.9Males
- 46.1Females
- 14.1Median age for Black or African American residents
- 14.2Males
- 19.9Females
- 24.9Median age for American Indian / Alaska Native residents
- 22.0Males
- 26.1Females
- -761,658,030.3Median age for Asian residents
- -918,095,237.2Males
- -685,759,744.7Females
- -899,543,378.1Median age for Native Hawaiian / Pacific Islander residents
- -966,942,147.8Males
- -866,666,665.8Females
- 21.4Median age for Other race residents
- 20.7Males
- 33.1Females
- 13.1Median age for Two or more races residents
- 13.1Males
- 16.4Females
- 42.0Median age for White alone residents
- 40.0Males
- 44.0Females
- 16.4Median age for Hispanic or Latino residents
- 14.3Males
- 23.2Females
Owner/renter occupied households by race in Silverton
- House owners and renters - White residents
- 2,10064.0%Owner occupied
- 1,18136.0%Renter occupied
- House owners and renters - Black or African American residents
- 59.1%Owner occupied
- 5190.9%Renter occupied
- House owners and renters - American Indian / Alaska Native residents
- 30100.0%Owner occupied
- House owners and renters - Other race residents
- 8648.7%Owner occupied
- 9151.3%Renter occupied
- House owners and renters - Two or more races residents
- 15750.1%Owner occupied
- 15749.9%Renter occupied
- House owners and renters - White alone residents
- 2,13664.2%Owner occupied
- 1,19035.8%Renter occupied
- House owners and renters - Hispanic or Latino residents
- 12635.8%Owner occupied
- 22664.2%Renter occupied
Language usage in Silverton
- English speakers - Total
- 89.1% of residents of Silverton speak English at home.
- 5.3% of residents speak Spanish at home
- 37070.6%Speak English very well
- 15429.4%Speak English less than very well
- 4.5% of residents speak other language at home
- 29768.0%Speak English very well
- 14032.0%Speak English less than very well
- English speakers - Born in the United States
- 91.0% of residents of Silverton speak English at home.
- 6.1% of residents speak Spanish at home
- 25596.6%Speak English very well
- 93.4%Speak English less than very well
- 4.6% of residents speak other language at home
- 4924.6%Speak English very well
- 15075.4%Speak English less than very well
All residents speak only English at home
- English speakers - Foreign-born
- 39.8% of residents of Silverton speak English at home.
- 26.2% of residents speak Spanish at home
- 6441.0%Speak English very well
- 9259.0%Speak English less than very well
- 23.2% of residents speak other language at home
- 138100.0%Speak English very well
White (Caucasian) - Speak only English
| Native: | 100.0% (7,159) |
| Foreign-born: | 94.6% (172) |
White (Caucasian) - Speak another language
| Native: | 1.6% (115) |
| Foreign-born: | 32.8% (60) |
Black or African American - Speak only English
| Native: | 50.7% (144) |
| Foreign-born: | 5.7% (6) |
Black or African American - Speak another language
| Native: | 41.1% (117) |
| Foreign-born: | 100.0% (100) |
Other race - Speak another language
| Native: | 73.6% (214) |
| Foreign-born: | 100.0% (99) |
Two or more races - Speak only English
| Native: | 79.5% (813) |
| Foreign-born: | 25.7% (29) |
Two or more races - Speak another language
| Native: | 19.1% (195) |
| Foreign-born: | 72.7% (81) |
White alone - Speak only English
| Native: | 98.3% (7,122) |
| Foreign-born: | 61.3% (206) |
White alone - Speak another language
| Native: | 1.8% (130) |
| Foreign-born: | 35.7% (120) |
Hispanic or Latino - Speak another language
| Native: | 40.6% (361) |
| Foreign-born: | 100.0% (167) |
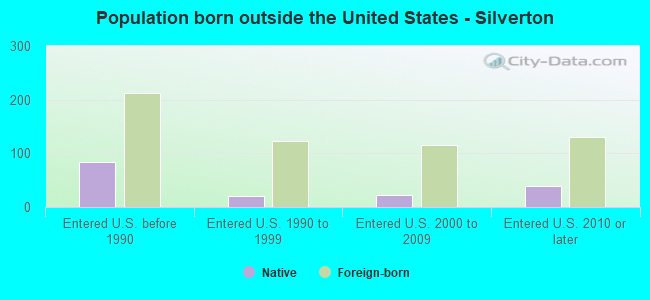
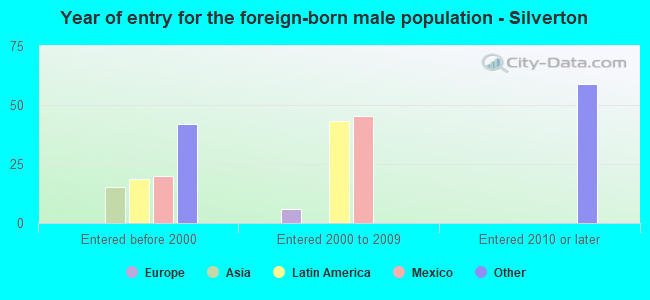
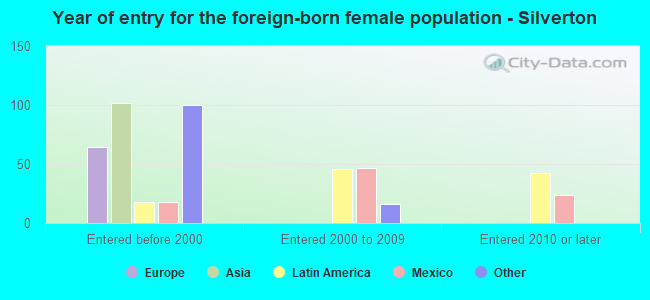
Foreign-born residents in Silverton
526 residents are foreign born (1.4% Latin America, 1.0% Asia, 0.9% North America, 0.7% Africa, 0.7% Europe).
| This city: | 5.0% |
| Oregon: | 9.8% |

Marital status for residents in Silverton
Marital status - White (Caucasian) population 15 years and over
- Males
- 29.7%Never married
- 54.0%Now married
- 1.7%Separated
- 1.4%Widowed
- 13.2%Divorced
- Females
- 16.8%Never married
- 51.9%Now married
- 1.9%Separated
- 9.2%Widowed
- 20.2%Divorced
Women who gave birth in the past 12 months
| Now married: | 33.6% (69) |
| Unmarried: | 66.4% (136) |
Women who did not give birth in the past 12 months
| Now married: | 56.2% (739) |
| Unmarried: | 43.8% (577) |
Marital status - Black or African American population 15 years and over
- Males
- 37.5%Never married
- 62.5%Now married
- 0.0%Separated
- 0.0%Widowed
- 0.0%Divorced
- Females
- 49.4%Never married
- 50.6%Now married
- 0.0%Separated
- 0.0%Widowed
- 0.0%Divorced
Women who did not give birth in the past 12 months
| Now married: | 47.6% (42) |
| Unmarried: | 52.4% (46) |
Marital status - American Indian / Alaska Native population 15 years and over
- Males
- 11.3%Never married
- 75.5%Now married
- 0.0%Separated
- 0.0%Widowed
- 13.2%Divorced
- Females
- 14.4%Never married
- 26.8%Now married
- 0.0%Separated
- 0.0%Widowed
- 58.8%Divorced
Women who did not give birth in the past 12 months
| Now married: | 26.8% (28) |
| Unmarried: | 73.2% (78) |
Marital status - Other race population 15 years and over
- Males
- 68.6%Never married
- 31.4%Now married
- 0.0%Separated
- 0.0%Widowed
- 0.0%Divorced
- Females
- 23.3%Never married
- 24.4%Now married
- 52.2%Separated
- 0.0%Widowed
- 0.0%Divorced
Women who did not give birth in the past 12 months
| Now married: | 76.7% (96) |
| Unmarried: | 23.3% (29) |
Marital status - Two or more races population 15 years and over
- Males
- 19.1%Never married
- 44.3%Now married
- 0.0%Separated
- 0.0%Widowed
- 36.6%Divorced
- Females
- 18.2%Never married
- 19.4%Now married
- 6.5%Separated
- 49.4%Widowed
- 6.5%Divorced
Women who did not give birth in the past 12 months
| Now married: | 55.8% (78) |
| Unmarried: | 44.2% (62) |
Marital status - White alone, not Hispanic / Latino population 15 years and over
- Males
- 29.8%Never married
- 53.3%Now married
- 1.8%Separated
- 1.4%Widowed
- 13.7%Divorced
- Females
- 16.3%Never married
- 52.9%Now married
- 1.9%Separated
- 8.9%Widowed
- 20.0%Divorced
Women who gave birth in the past 12 months
| Now married: | 33.6% (75) |
| Unmarried: | 66.4% (148) |
Women who did not give birth in the past 12 months
| Now married: | 58.2% (805) |
| Unmarried: | 41.8% (577) |
Marital status - Hispanic or Latino population 15 years and over
- Males
- 41.5%Never married
- 50.4%Now married
- 0.0%Separated
- 0.0%Widowed
- 8.1%Divorced
- Females
- 31.0%Never married
- 22.3%Now married
- 24.8%Separated
- 6.6%Widowed
- 15.3%Divorced
Women who did not give birth in the past 12 months
| Now married: | 55.3% (125) |
| Unmarried: | 44.7% (101) |
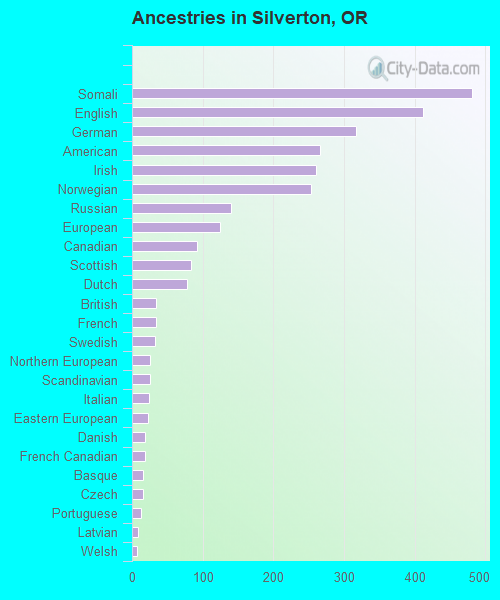
Ancestries in Silverton

- 48112.0%Somali
- 41110.2%English
- 3177.9%German
- 2666.6%American
- 2616.5%Irish
- 2536.3%Norwegian
- 1403.5%Russian
- 1253.1%European
- 922.3%Canadian
- 832.1%Scottish
- 781.9%Dutch
- 340.8%British
- 340.8%French
- 320.8%Swedish
- 250.6%Northern European
- 250.6%Scandinavian
- 240.6%Italian
- 220.5%Eastern European
- 180.4%Danish
- 180.4%French Canadian
- 160.4%Basque
- 160.4%Czech
- 130.3%Portuguese
- 80.2%Latvian
- 70.2%Welsh
- 60.1%Polish
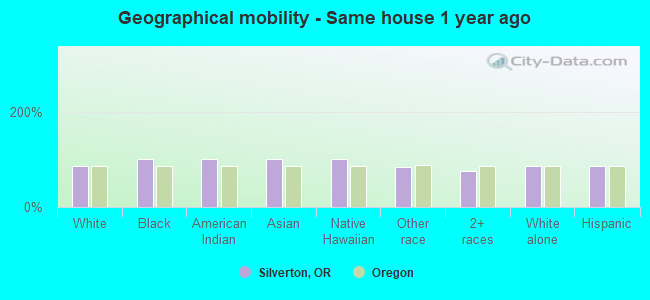
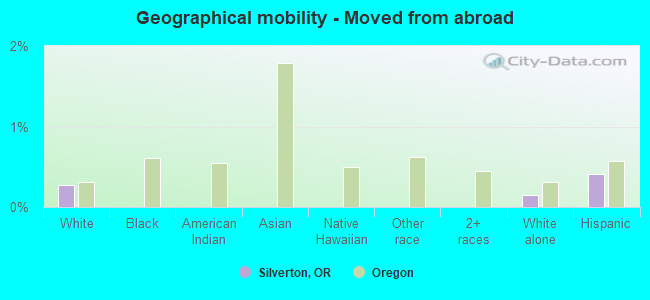
Geographical mobility in Silverton

- Same house 1 year ago
- 6,44685.7%White (Caucasian)
- 395100.0%Black or African American
- 196100.0%American Indian / Alaska Native
- 7100.0%Asian
- 29100.0%Native Hawaiian / Pacific Islander
- 37084.1%Other race
- 1,12474.6%Two or more races
- 6,76586.2%White alone, not Hispanic / Latino
- 1,09885.3%Hispanic or Latino
-
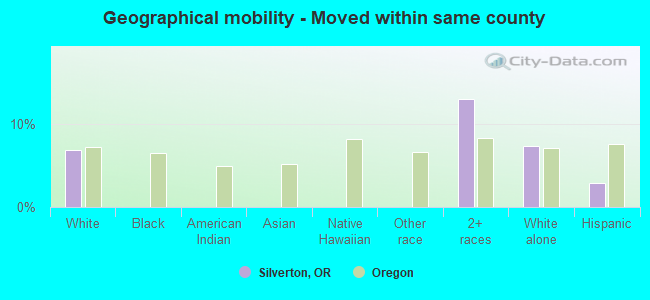
- Moved within same county
- 5196.9%White / Caucasian
- 19713.1%Two or more races
- 5807.4%White alone, not Hispanic / Latino
- 382.9%Hispanic or Latino
-
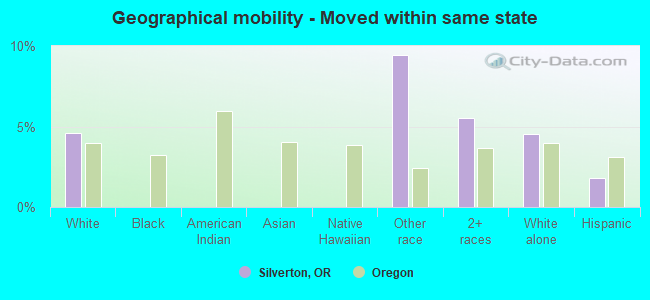
- Moved within same state
- 3454.6%White / Caucasian
- 419.4%Other race
- 845.6%Two or more races
- 3554.5%White alone, not Hispanic / Latino
- 231.8%Hispanic or Latino
-
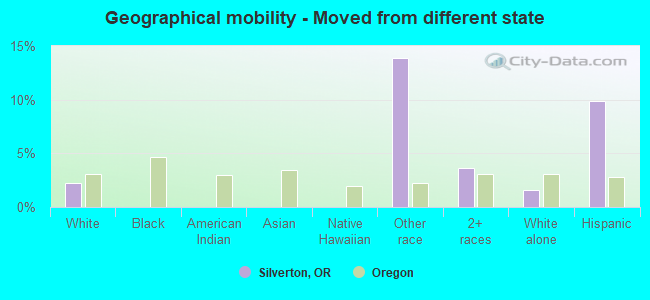
- Moved from different state
- 1682.2%White / Caucasian
- 6113.9%Other race
- 553.6%Two or more races
- 1241.6%White alone, not Hispanic / Latino
- 1279.9%Hispanic or Latino
-
- Moved from abroad
- 210.3%White
- 120.1%White alone, not Hispanic / Latino
- 50.4%Hispanic or Latino
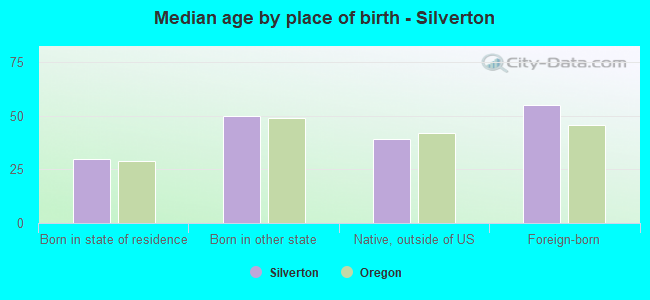
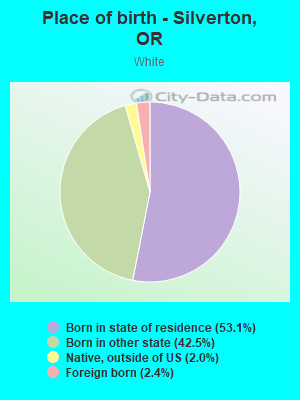
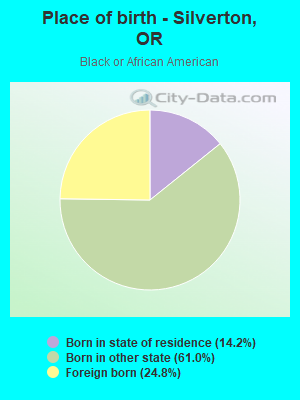
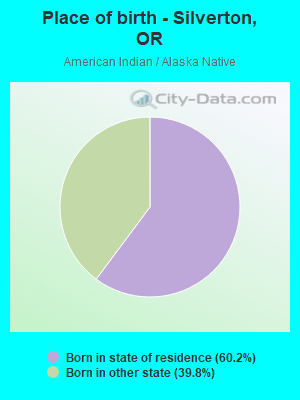
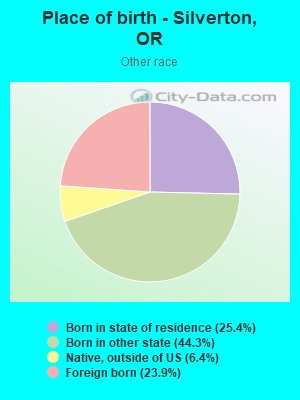
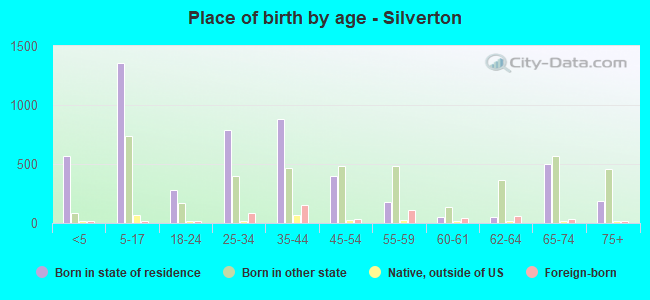
Children Nativity (place of birth) in Silverton
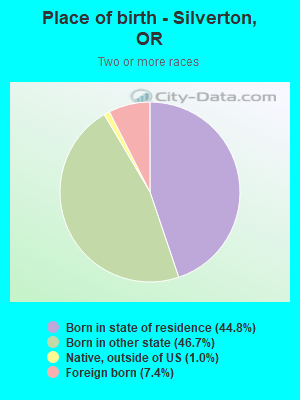
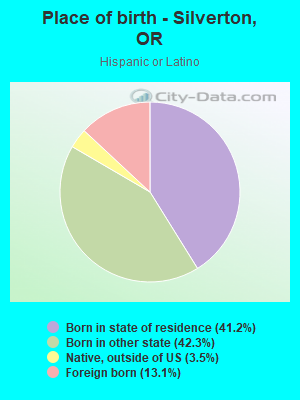
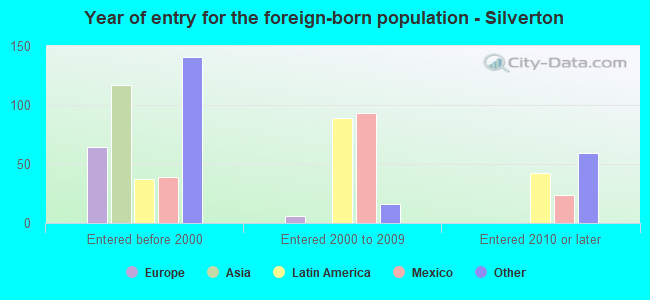
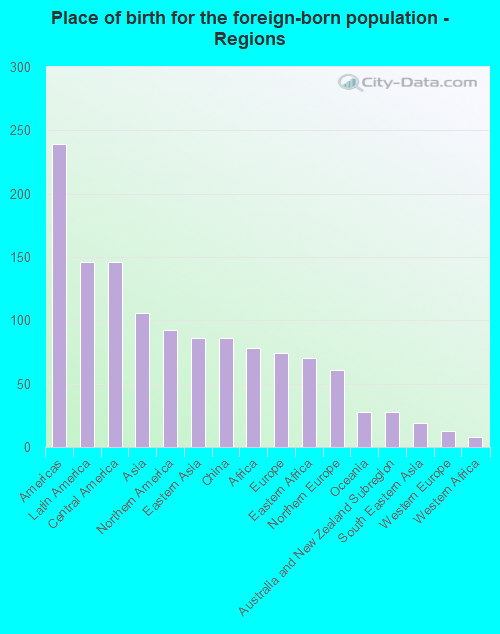
Place of birth for residents in Silverton
![Place of birth for the foreign-born population - Regions]()
- 239Americas
- 146Latin America
- 146Central America
- 106Asia
- 92Northern America
- 86Eastern Asia
- 86China
- 78Africa
- 74Europe
- 70Eastern Africa
- 61Northern Europe
- 28Oceania
- 28Australia and New Zealand Subregion
- 19South Eastern Asia
- 13Western Europe
- 8Western Africa
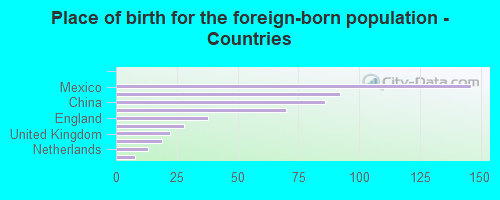
![Place of birth for the foreign-born population - Countries]()
- 146Mexico
- 92Canada
- 86China
- 70Somalia
- 38England
- 28New Zealand
- 22United Kingdom
- 19Philippines
- 13Netherlands
- 8Liberia
Grandparents responsible for own grandchildren in Silverton
Zip codes: 97381.