Races in Simpsonville, South Carolina (SC) Detailed Stats
Data:
Races - White alone (%)
Races - White alone (% change since 2000)
Races - Black alone (%)
Races - Black alone (% change since 2000)
Races - American Indian alone (%)
Races - American Indian alone (% change since 2000)
Races - Asian alone (%)
Races - Asian alone (% change since 2000)
Races - Hispanic (%)
Races - Hispanic (% change since 2000)
Races - Native Hawaiian and Other Pacific Islander alone (%)
Races - Native Hawaiian and Other Pacific Islander alone (% change since 2000)
Races - Two or more races(%)
Races - Two or more races(% change since 2000)
Races - Other race alone (%)
Races - Other race alone (% change since 2000)
Racial diversity
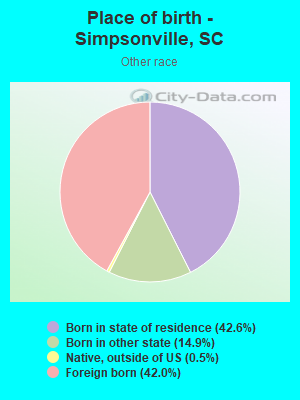
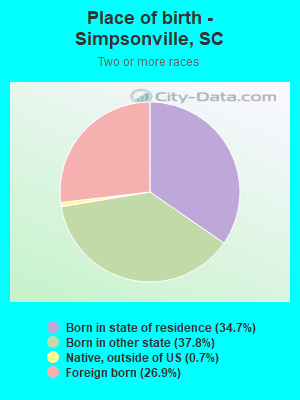
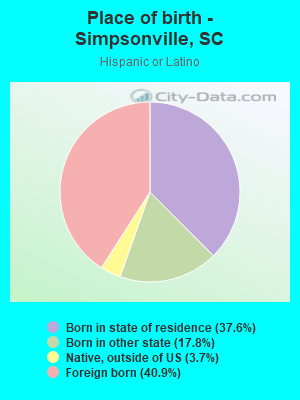
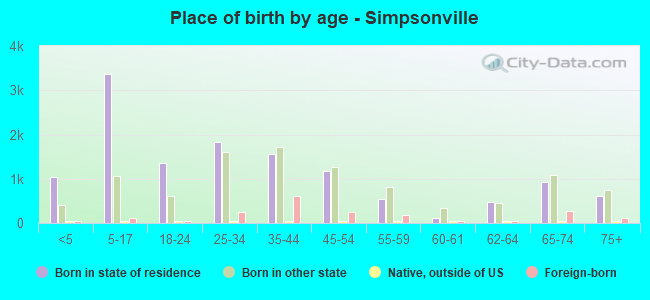
Place of birth - Born in state of residence (%)
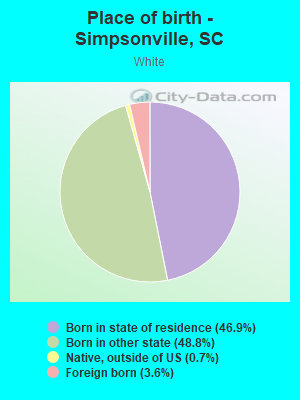
Place of birth - Born in state of residence (%) - White
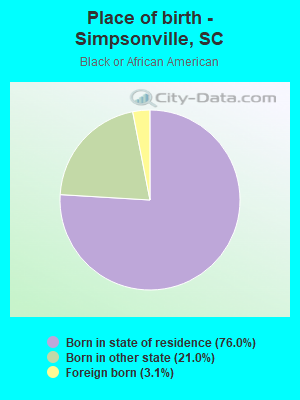
Place of birth - Born in state of residence (%) - Black or African American
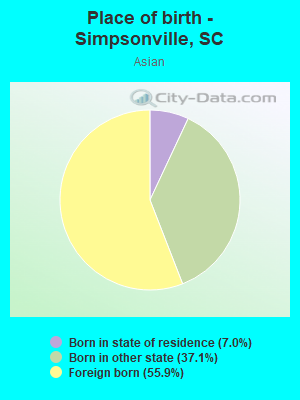
Place of birth - Born in state of residence (%) - Asian
Place of birth - Born in state of residence (%) - Hispanic or Latino
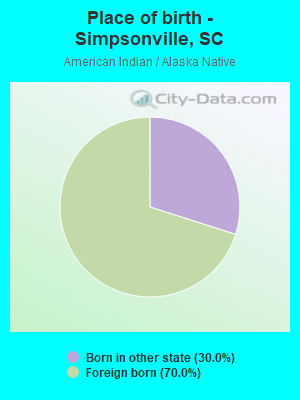
Place of birth - Born in state of residence (%) - American Indian and Alaska Native
Place of birth - Born in state of residence (%) - Multirace
Place of birth - Born in state of residence (%) - Other Race
Place of birth - Born in other state (%)
Place of birth - Born in other state (%) - White
Place of birth - Born in other state (%) - Black or African American
Place of birth - Born in other state (%) - Asian
Place of birth - Born in other state (%) - Hispanic or Latino
Place of birth - Born in other state (%) - American Indian and Alaska Native
Place of birth - Born in other state (%) - Multirace
Place of birth - Born in other state (%) - Other Race
Place of birth - Native, outside of US (%)
Place of birth - Native, outside of US (%) - White
Place of birth - Native, outside of US (%) - Black or African American
Place of birth - Native, outside of US (%) - Asian
Place of birth - Native, outside of US (%) - Hispanic or Latino
Place of birth - Native, outside of US (%) - American Indian and Alaska Native
Place of birth - Native, outside of US (%) - Multirace
Place of birth - Native, outside of US (%) - Other Race
Place of birth - Foreign born (%)
Place of birth - Foreign born (%) - White
Place of birth - Foreign born (%) - Black or African American
Place of birth - Foreign born (%) - Asian
Place of birth - Foreign born (%) - Hispanic or Latino
Place of birth - Foreign born (%) - American Indian and Alaska Native
Place of birth - Foreign born (%) - Multirace
Place of birth - Foreign born (%) - Other Race
Residents speaking English at home (%)
Residents speaking English at home - Born in the United States (%)
Residents speaking English at home - Native, born elsewhere (%)
Residents speaking English at home - Foreign born (%)
Residents speaking Spanish at home (%)
Residents speaking Spanish at home - Born in the United States (%)
Residents speaking Spanish at home - Native, born elsewhere (%)
Residents speaking Spanish at home - Foreign born (%)
Residents speaking other language at home (%)
Residents speaking other language at home - Born in the United States (%)
Residents speaking other language at home - Native, born elsewhere (%)
Residents speaking other language at home - Foreign born (%)
Marital status - Never married (%)
Marital status - Now married (%)
Marital status - Separated (%)
Marital status - Widowed (%)
Marital status - Divorced (%)
Ancestries Reported - Arab (%)
Ancestries Reported - Czech (%)
Ancestries Reported - Danish (%)
Ancestries Reported - Dutch (%)
Ancestries Reported - English (%)
Ancestries Reported - French (%)
Ancestries Reported - French Canadian (%)
Ancestries Reported - German (%)
Ancestries Reported - Greek (%)
Ancestries Reported - Hungarian (%)
Ancestries Reported - Irish (%)
Ancestries Reported - Italian (%)
Ancestries Reported - Lithuanian (%)
Ancestries Reported - Norwegian (%)
Ancestries Reported - Polish (%)
Ancestries Reported - Portuguese (%)
Ancestries Reported - Russian (%)
Ancestries Reported - Scotch-Irish (%)
Ancestries Reported - Scottish (%)
Ancestries Reported - Slovak (%)
Ancestries Reported - Subsaharan African (%)
Ancestries Reported - Swedish (%)
Ancestries Reported - Swiss (%)
Ancestries Reported - Ukrainian (%)
Ancestries Reported - United States (%)
Ancestries Reported - Welsh (%)
Ancestries Reported - West Indian (%)
Ancestries Reported - Other (%)
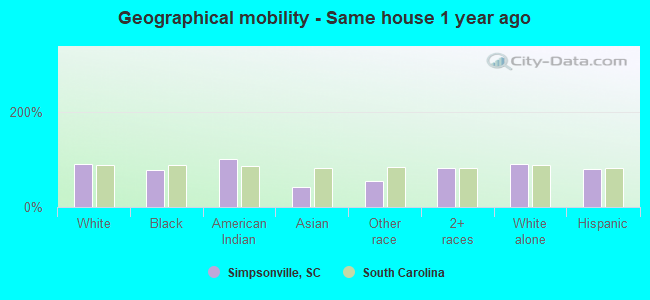
Geographical mobility - Same house 1 year ago (%)
Geographical mobility - Same house 1 year ago (%) - White
Geographical mobility - Same house 1 year ago (%) - Black or African American
Geographical mobility - Same house 1 year ago (%) - Asian
Geographical mobility - Same house 1 year ago (%) - Hispanic or Latino
Geographical mobility - Same house 1 year ago (%) - American Indian and Alaska Native
Geographical mobility - Same house 1 year ago (%) - Multirace
Geographical mobility - Same house 1 year ago (%) - Other Race
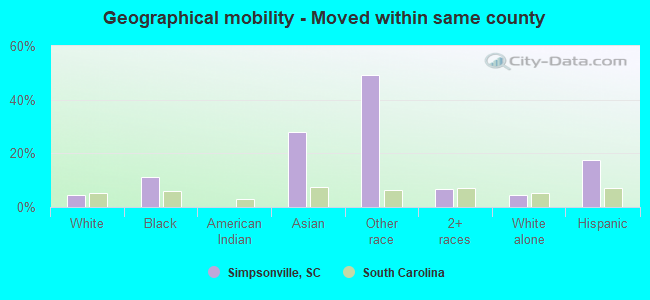
Geographical mobility - Moved within same county (%)
Geographical mobility - Moved within same county (%) - White
Geographical mobility - Moved within same county (%) - Black or African American
Geographical mobility - Moved within same county (%) - Asian
Geographical mobility - Moved within same county (%) - Hispanic or Latino
Geographical mobility - Moved within same county (%) - American Indian and Alaska Native
Geographical mobility - Moved within same county (%) - Multirace
Geographical mobility - Moved within same county (%) - Other Race
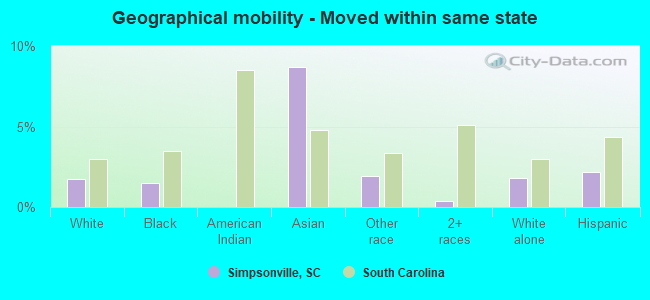
Geographical mobility - Moved from different county within same state (%)
Geographical mobility - Moved from different county within same state (%) - White
Geographical mobility - Moved from different county within same state (%) - Black or African American
Geographical mobility - Moved from different county within same state (%) - Asian
Geographical mobility - Moved from different county within same state (%) - Hispanic or Latino
Geographical mobility - Moved from different county within same state (%) - American Indian and Alaska Native
Geographical mobility - Moved from different county within same state (%) - Multirace
Geographical mobility - Moved from different county within same state (%) - Other Race
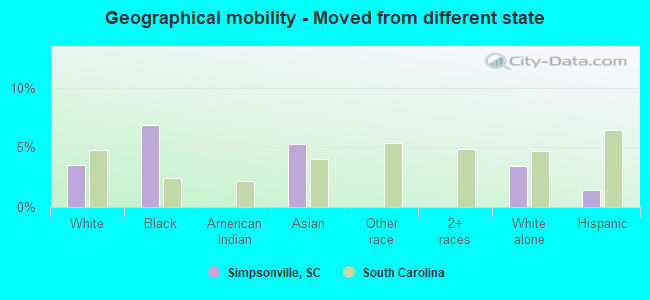
Geographical mobility - Moved from different state (%)
Geographical mobility - Moved from different state (%) - White
Geographical mobility - Moved from different state (%) - Black or African American
Geographical mobility - Moved from different state (%) - Asian
Geographical mobility - Moved from different state (%) - Hispanic or Latino
Geographical mobility - Moved from different state (%) - American Indian and Alaska Native
Geographical mobility - Moved from different state (%) - Multirace
Geographical mobility - Moved from different state (%) - Other Race
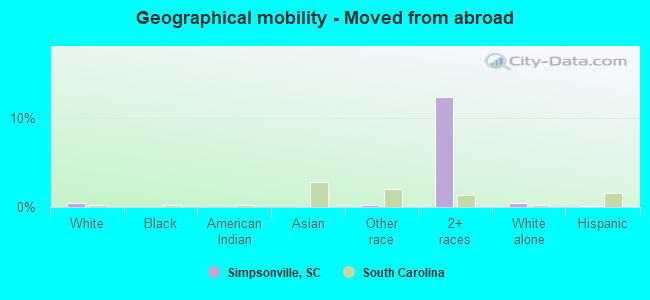
Geographical mobility - Moved from abroad (%)
Geographical mobility - Moved from abroad (%) - White
Geographical mobility - Moved from abroad (%) - Black or African American
Geographical mobility - Moved from abroad (%) - Asian
Geographical mobility - Moved from abroad (%) - Hispanic or Latino
Geographical mobility - Moved from abroad (%) - American Indian and Alaska Native
Geographical mobility - Moved from abroad (%) - Multirace
Geographical mobility - Moved from abroad (%) - Other Race
Place of birth for the foreign-born population - Ireland (%)
Place of birth for the foreign-born population - Denmark (%)
Place of birth for the foreign-born population - Norway (%)
Place of birth for the foreign-born population - Sweden (%)
Place of birth for the foreign-born population - United Kingdom (%)
Place of birth for the foreign-born population - England (%)
Place of birth for the foreign-born population - Scotland (%)
Place of birth for the foreign-born population - Other Northern Europe (%)
Place of birth for the foreign-born population - Austria (%)
Place of birth for the foreign-born population - Belgium (%)
Place of birth for the foreign-born population - France (%)
Place of birth for the foreign-born population - Germany (%)
Place of birth for the foreign-born population - Netherlands (%)
Place of birth for the foreign-born population - Switzerland (%)
Place of birth for the foreign-born population - Other Western Europe (%)
Place of birth for the foreign-born population - Greece (%)
Place of birth for the foreign-born population - Italy (%)
Place of birth for the foreign-born population - Portugal (%)
Place of birth for the foreign-born population - Spain (%)
Place of birth for the foreign-born population - Other Southern Europe (%)
Place of birth for the foreign-born population - Albania (%)
Place of birth for the foreign-born population - Belarus (%)
Place of birth for the foreign-born population - Bosnia and Herzegovina (%)
Place of birth for the foreign-born population - Bulgaria (%)
Place of birth for the foreign-born population - Croatia (%)
Place of birth for the foreign-born population - Czechoslovakia (%)
Place of birth for the foreign-born population - Hungary (%)
Place of birth for the foreign-born population - Latvia (%)
Place of birth for the foreign-born population - Lithuania (%)
Place of birth for the foreign-born population - North Macedonia (Macedonia) (%)
Place of birth for the foreign-born population - Moldova (%)
Place of birth for the foreign-born population - Poland (%)
Place of birth for the foreign-born population - Romania (%)
Place of birth for the foreign-born population - Russia (%)
Place of birth for the foreign-born population - Serbia (%)
Place of birth for the foreign-born population - Ukraine (%)
Place of birth for the foreign-born population - Other Eastern Europe (%)
Place of birth for the foreign-born population - China (%)
Place of birth for the foreign-born population - Hong Kong (%)
Place of birth for the foreign-born population - Taiwan (%)
Place of birth for the foreign-born population - Japan (%)
Place of birth for the foreign-born population - Korea (%)
Place of birth for the foreign-born population - Other Eastern Asia (%)
Place of birth for the foreign-born population - Afghanistan (%)
Place of birth for the foreign-born population - Bangladesh (%)
Place of birth for the foreign-born population - India (%)
Place of birth for the foreign-born population - Iran (%)
Place of birth for the foreign-born population - Kazakhstan (%)
Place of birth for the foreign-born population - Nepal (%)
Place of birth for the foreign-born population - Pakistan (%)
Place of birth for the foreign-born population - Sri Lanka (%)
Place of birth for the foreign-born population - Uzbekistan (%)
Place of birth for the foreign-born population - Other South Central Asia (%)
Place of birth for the foreign-born population - Burma (%)
Place of birth for the foreign-born population - Cambodia (%)
Place of birth for the foreign-born population - Indonesia (%)
Place of birth for the foreign-born population - Laos (%)
Place of birth for the foreign-born population - Malaysia (%)
Place of birth for the foreign-born population - Philippines (%)
Place of birth for the foreign-born population - Singapore (%)
Place of birth for the foreign-born population - Thailand (%)
Place of birth for the foreign-born population - Vietnam (%)
Place of birth for the foreign-born population - Other South Eastern Asia (%)
Place of birth for the foreign-born population - Armenia (%)
Place of birth for the foreign-born population - Iraq (%)
Place of birth for the foreign-born population - Israel (%)
Place of birth for the foreign-born population - Jordan (%)
Place of birth for the foreign-born population - Kuwait (%)
Place of birth for the foreign-born population - Lebanon (%)
Place of birth for the foreign-born population - Saudi Arabia (%)
Place of birth for the foreign-born population - Syria (%)
Place of birth for the foreign-born population - Turkey (%)
Place of birth for the foreign-born population - Yemen (%)
Place of birth for the foreign-born population - Other Western Asia (%)
Place of birth for the foreign-born population - Eritrea (%)
Place of birth for the foreign-born population - Ethiopia (%)
Place of birth for the foreign-born population - Kenya (%)
Place of birth for the foreign-born population - Somalia (%)
Place of birth for the foreign-born population - Uganda (%)
Place of birth for the foreign-born population - Zimbabwe (%)
Place of birth for the foreign-born population - Other Eastern Africa (%)
Place of birth for the foreign-born population - Cameroon (%)
Place of birth for the foreign-born population - Congo (%)
Place of birth for the foreign-born population - Democratic Republic of Congo (Zaire) (%)
Place of birth for the foreign-born population - Other Middle Africa (%)
Place of birth for the foreign-born population - Egypt (%)
Place of birth for the foreign-born population - Morocco (%)
Place of birth for the foreign-born population - Sudan (%)
Place of birth for the foreign-born population - Other Northern Africa (%)
Place of birth for the foreign-born population - South Africa (%)
Place of birth for the foreign-born population - Other Southern Africa (%)
Place of birth for the foreign-born population - Cabo Verde (%)
Place of birth for the foreign-born population - Ghana (%)
Place of birth for the foreign-born population - Liberia (%)
Place of birth for the foreign-born population - Nigeria (%)
Place of birth for the foreign-born population - Senegal (%)
Place of birth for the foreign-born population - Sierra Leone (%)
Place of birth for the foreign-born population - Other Western Africa (%)
Place of birth for the foreign-born population - Australia (%)
Place of birth for the foreign-born population - New Zealand (%)
Place of birth for the foreign-born population - Fiji (%)
Place of birth for the foreign-born population - Micronesia (%)
Place of birth for the foreign-born population - Bahamas (%)
Place of birth for the foreign-born population - Barbados (%)
Place of birth for the foreign-born population - Cuba (%)
Place of birth for the foreign-born population - Dominica (%)
Place of birth for the foreign-born population - Dominican Republic (%)
Place of birth for the foreign-born population - Grenada (%)
Place of birth for the foreign-born population - Haiti (%)
Place of birth for the foreign-born population - Jamaica (%)
Place of birth for the foreign-born population - St. Vincent and the Grenadines (%)
Place of birth for the foreign-born population - Trinidad and Tobago (%)
Place of birth for the foreign-born population - West Indies (%)
Place of birth for the foreign-born population - Other Caribbean (%)
Place of birth for the foreign-born population - Belize (%)
Place of birth for the foreign-born population - Costa Rica (%)
Place of birth for the foreign-born population - El Salvador (%)
Place of birth for the foreign-born population - Guatemala (%)
Place of birth for the foreign-born population - Honduras (%)
Place of birth for the foreign-born population - Mexico (%)
Place of birth for the foreign-born population - Nicaragua (%)
Place of birth for the foreign-born population - Panama (%)
Place of birth for the foreign-born population - Other Central America (%)
Place of birth for the foreign-born population - Argentina (%)
Place of birth for the foreign-born population - Bolivia (%)
Place of birth for the foreign-born population - Brazil (%)
Place of birth for the foreign-born population - Chile (%)
Place of birth for the foreign-born population - Colombia (%)
Place of birth for the foreign-born population - Ecuador (%)
Place of birth for the foreign-born population - Guyana (%)
Place of birth for the foreign-born population - Peru (%)
Place of birth for the foreign-born population - Uruguay (%)
Place of birth for the foreign-born population - Venezuela (%)
Place of birth for the foreign-born population - Other South America (%)
Place of birth for the foreign-born population - Canada (%)
Place of birth for the foreign-born population - Other Northern America (%)
Place of birth for the foreign-born population - Other (%)
Latest news about races in Simpsonville, SC collected exclusively by city-data.com from local newspapers, TV, and radio stations
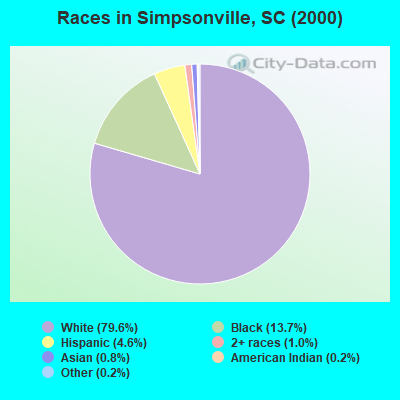
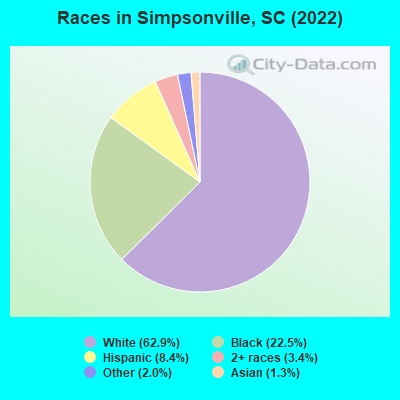
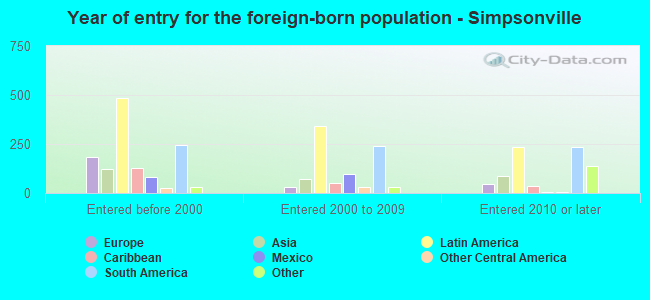
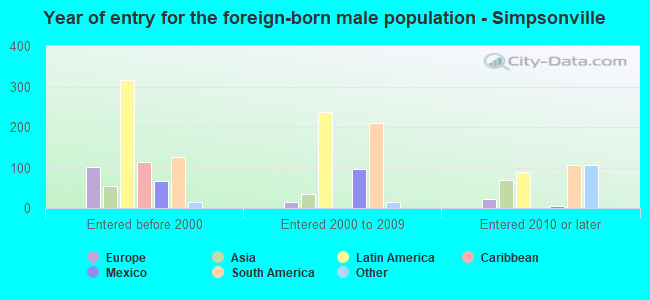
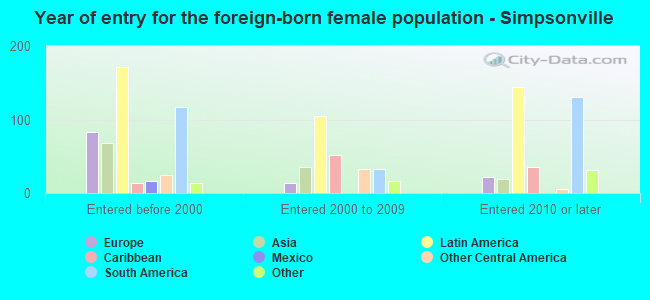
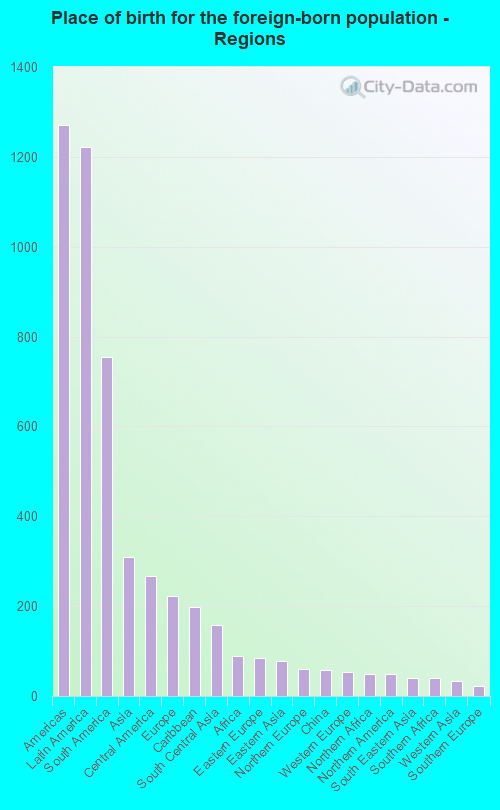
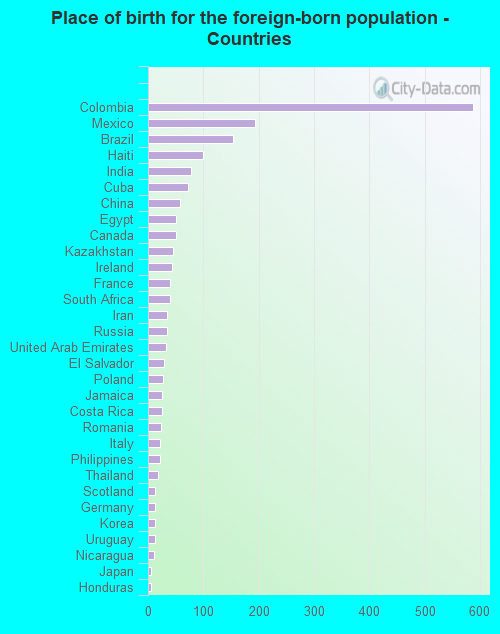
According to 2022 data, the most numerous races in Simpsonville, SC are White alone (15,734 residents), Black alone (5,638 residents), and Hispanic (2,093 residents). 89.2% of Simpsonville residents speak English at home. 7.6% of Simpsonville, SC residents are foreign-born (5.0% born in Latin America, 1.3% born in Asia, 0.9% born in Europe), which is 33.9% greater than the foreign-born rate of 5.0% across the entire state of South Carolina.
Race distribution in Simpsonville
2000 2022
2,652,291 66.1% White alone 1,178,486 29.4% Black alone 95,076 2.4% Hispanic 35,568 0.9% Asian alone 33,290 0.8% Two or more races 12,765 0.3% American Indian alone 3,266 0.08% Other race alone 1,270 0.03% Native Hawaiian and Other
3,301,739 62.5% White alone 1,313,290 24.9% Black alone 343,783 6.5% Hispanic 190,508 3.6% Two or more races 89,888 1.7% Asian alone 29,390 0.6% Other race alone 12,112 0.2% American Indian alone 1,924 0.04% Native Hawaiian and Other
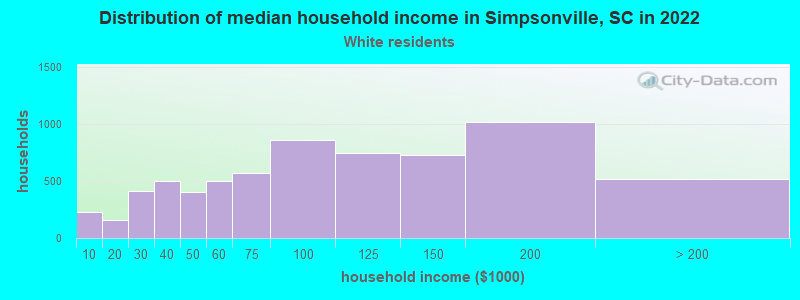
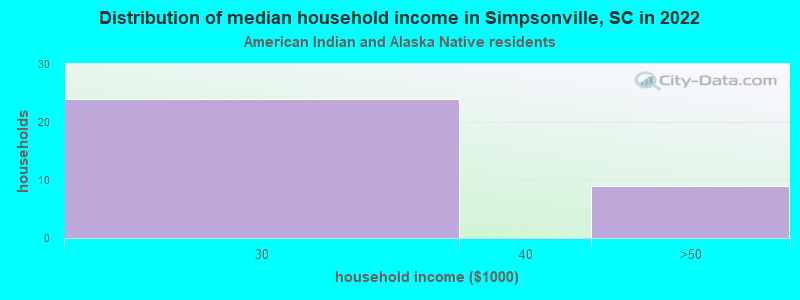
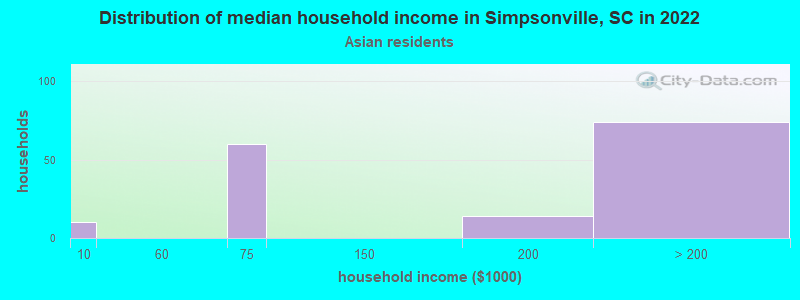
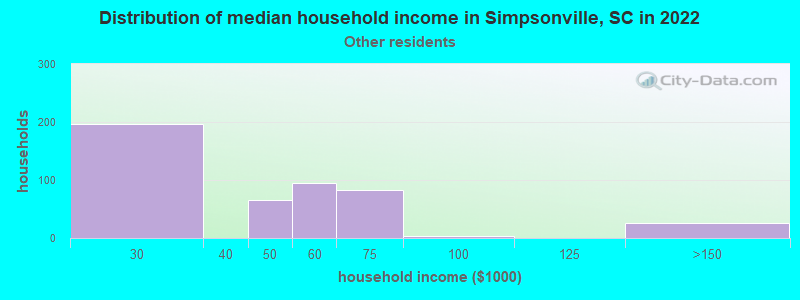
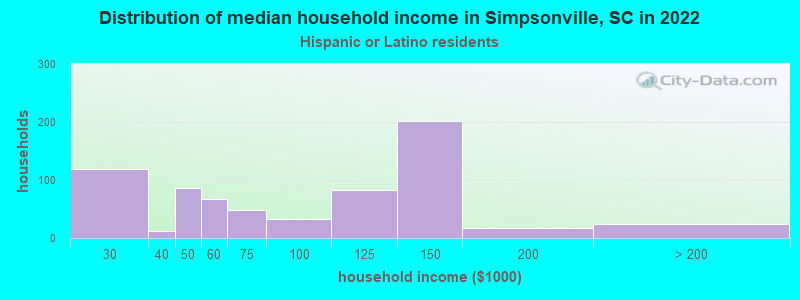
Income and house value in Simpsonville Median household income in 2022 $91,088 White non-Hispanic householders$73,845 Black householders$49,635 Some other race householders$129,200 Two or more races householders$66,787 Hispanic or Latino race householdersMedian 2022 house value $289,515 White Non-Hispanic householders$258,867 Black or African American householders$376,260 American Indian or Alaska Native householders $258,320 Asian householders$345,886 Some other race householders$289,789 Two or more races householders$232,597 Hispanic or Latino householders
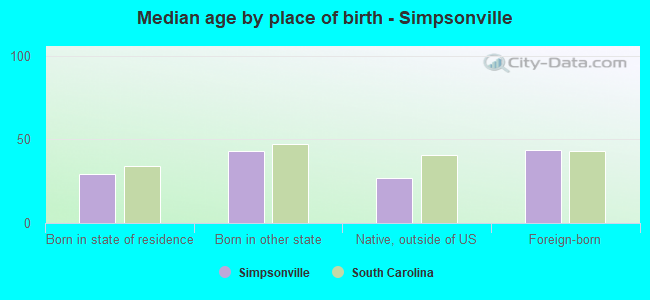
Median age by race in Simpsonville
40.1 Median age for White residents39.9 40.2 34.7 Median age for Black or African American residents32.1 45.8 23.5 Median age for American Indian / Alaska Native residents-862,419,205.0 -446,859,902.9 37.2 Median age for Asian residents38.8 37.6 -698,412,697.7 Median age for Native Hawaiian / Pacific Islander residents-551,574,375.1 -1,016,109,044.8 26.4 Median age for Other race residents37.8 21.6 24.6 Median age for Two or more races residents13.9 26.7 40.1 Median age for White alone residents39.2 40.2 34.0 Median age for Hispanic or Latino residents34.4 33.8
Owner/renter occupied households by race in Simpsonville
House owners and renters - White residents 5,264 79.5% Owner occupied1,361 20.5% Renter occupiedHouse owners and renters - Black or African American residents 1,081 54.4% Owner occupied908 45.6% Renter occupiedHouse owners and renters - American Indian / Alaska Native residents 36 100.0% Owner occupiedHouse owners and renters - Asian residents 108 61.0% Owner occupied69 39.0% Renter occupiedHouse owners and renters - Other race residents 74 15.8% Owner occupied393 84.2% Renter occupiedHouse owners and renters - Two or more races residents 360 65.5% Owner occupied189 34.5% Renter occupiedHouse owners and renters - White alone residents 5,108 78.5% Owner occupied1,403 21.5% Renter occupiedHouse owners and renters - Hispanic or Latino residents 429 62.3% Owner occupied259 37.7% Renter occupied
Language usage in Simpsonville
English speakers - Total 89.2% of residents of Simpsonville speak English at home.
7.2% of residents speak Spanish at home 1,178 69.2% Speak English very well525 30.8% Speak English less than very well3.7% of residents speak other language at home 619 70.8% Speak English very well255 29.2% Speak English less than very well
English speakers - Born in the United States 95.5% of residents of Simpsonville speak English at home.
2.2% of residents speak Spanish at home 214 100.0% Speak English very well1.7% of residents speak other language at home 152 94.4% Speak English very well9 5.6% Speak English less than very well
English speakers - Native, born elsewhere 52.1% of residents of Simpsonville speak English at home.
45.1% of residents speak Spanish at home 63 98.4% Speak English very well1 1.6% Speak English less than very well5.6% of residents speak other language at home 8 100.0% Speak English very well
English speakers - Foreign-born 20.3% of residents of Simpsonville speak English at home.
42.6% of residents speak Spanish at home 436 57.4% Speak English very well323 42.6% Speak English less than very well39.6% of residents speak other language at home 479 67.9% Speak English very well226 32.1% Speak English less than very well
White (Caucasian) - Speak only English Native:
97.4% (14,505)Foreign-born:
24.2% (140)
White (Caucasian) - Speak another language Native:
2.5% (366)Foreign-born:
67.7% (392)
Black or African American - Speak only English Native:
96.9% (4,983)Foreign-born:
3.0% (5)
Black or African American - Speak another language Native:
2.9% (152)Foreign-born:
100.0% (174)
Asian - Speak only English Native:
37.2% (48)Foreign-born:
21.4% (44)
Asian - Speak another language Native:
43.8% (57)Foreign-born:
78.8% (161)
Other race - Speak only English Native:
53.2% (261)Foreign-born:
31.1% (105)
Other race - Speak another language Native:
48.4% (237)Foreign-born:
75.2% (255)
Two or more races - Speak only English Native:
71.5% (833)Foreign-born:
17.9% (89)
Two or more races - Speak another language Native:
28.7% (335)Foreign-born:
79.9% (396)
White alone - Speak only English Native:
99.0% (14,392)Foreign-born:
36.0% (147)
White alone - Speak another language Native:
1.0% (151)Foreign-born:
62.4% (254)
Hispanic or Latino - Speak only English Native:
51.4% (614)Foreign-born:
13.5% (114)
Hispanic or Latino - Speak another language Native:
48.9% (584)Foreign-born:
87.9% (738)
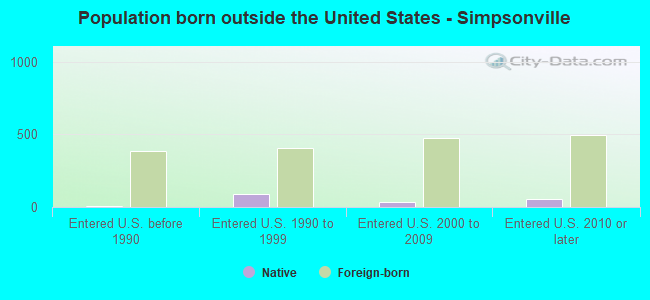
Foreign-born residents in Simpsonville 1,894 residents are foreign born (5.0% Latin America , 1.3% Asia , 0.9% Europe ).
This city:
7.6%South Carolina:
5.3%
Marital status for residents in Simpsonville Marital status - White (Caucasian) population 15 years and over
Males 23.3% Never married59.5% Now married4.4% Separated2.2% Widowed10.6% DivorcedFemales 21.7% Never married57.7% Now married1.2% Separated9.3% Widowed10.1% DivorcedWomen who gave birth in the past 12 months Now married:
82.8% (154)Unmarried:
17.2% (32)
Women who did not give birth in the past 12 months Now married:
59.5% (2,107)Unmarried:
40.5% (1,435)
Marital status - Black or African American population 15 years and over
Males 53.6% Never married38.6% Now married3.0% Separated0.0% Widowed4.8% DivorcedFemales 42.2% Never married39.3% Now married1.9% Separated6.8% Widowed9.8% DivorcedWomen who gave birth in the past 12 months Now married:
0.0% (0)Unmarried:
100.0% (86)
Women who did not give birth in the past 12 months Now married:
40.9% (500)Unmarried:
59.1% (723)
Marital status - American Indian / Alaska Native population 15 years and over
Males 87.0% Never married13.0% Now married0.0% Separated0.0% Widowed0.0% DivorcedFemales 0.0% Never married0.0% Now married0.0% Separated100.0% Widowed0.0% DivorcedMarital status - Asian population 15 years and over
Males 31.9% Never married68.1% Now married0.0% Separated0.0% Widowed0.0% DivorcedFemales 10.4% Never married75.0% Now married0.0% Separated0.0% Widowed14.6% DivorcedWomen who did not give birth in the past 12 months Now married:
85.1% (95)Unmarried:
14.9% (17)
Marital status - Other race population 15 years and over
Males 51.3% Never married37.6% Now married0.0% Separated0.0% Widowed11.1% DivorcedFemales 46.0% Never married33.5% Now married0.0% Separated14.4% Widowed6.1% DivorcedWomen who gave birth in the past 12 months Now married:
100.0% (15)Unmarried:
0.0% (0)
Women who did not give birth in the past 12 months Now married:
38.9% (103)Unmarried:
61.1% (162)
Marital status - Two or more races population 15 years and over
Males 22.5% Never married62.1% Now married6.1% Separated3.9% Widowed5.5% DivorcedFemales 28.6% Never married65.9% Now married0.0% Separated0.0% Widowed5.5% DivorcedWomen who gave birth in the past 12 months Now married:
100.0% (44)Unmarried:
0.0% (0)
Women who did not give birth in the past 12 months Now married:
59.2% (267)Unmarried:
40.8% (184)
Marital status - White alone, not Hispanic / Latino population 15 years and over
Males 23.3% Never married59.9% Now married4.7% Separated2.2% Widowed9.9% DivorcedFemales 21.9% Never married57.0% Now married1.3% Separated9.6% Widowed10.3% DivorcedWomen who gave birth in the past 12 months Now married:
82.8% (157)Unmarried:
17.2% (33)
Women who did not give birth in the past 12 months Now married:
58.9% (2,040)Unmarried:
41.1% (1,424)
Marital status - Hispanic or Latino population 15 years and over
Males 34.5% Never married49.0% Now married0.0% Separated0.5% Widowed16.0% DivorcedFemales 23.7% Never married65.2% Now married4.1% Separated3.1% Widowed4.1% DivorcedWomen who gave birth in the past 12 months Now married:
100.0% (55)Unmarried:
0.0% (0)
Women who did not give birth in the past 12 months Now married:
64.2% (301)Unmarried:
35.8% (168)
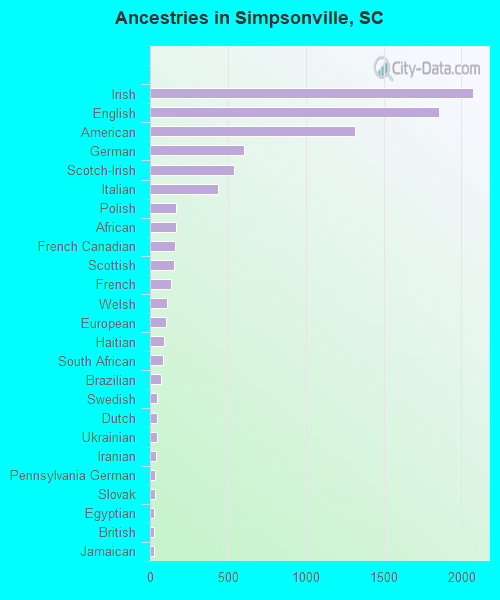
Ancestries in Simpsonville
2,074 16.8% Irish1,854 15.0% English1,315 10.6% American605 4.9% German540 4.4% Scotch-Irish439 3.6% Italian170 1.4% Polish164 1.3% African160 1.3% French Canadian155 1.3% Scottish135 1.1% French112 0.9% Welsh101 0.8% European92 0.7% Haitian81 0.7% South African69 0.6% Brazilian46 0.4% Swedish43 0.3% Dutch42 0.3% Ukrainian36 0.3% Iranian35 0.3% Pennsylvania German30 0.2% Slovak28 0.2% Egyptian28 0.2% British27 0.2% Jamaican24 0.2% Eastern European22 0.2% Romanian18 0.1% Greek17 0.1% Russian11 0.09% Hungarian11 0.09% Northern European7 0.06% Armenian6 0.05% Norwegian
Geographical mobility in Simpsonville Same house 1 year ago 14,520 90.0% White (Caucasian)4,351 77.8% Black or African American38 100.0% American Indian / Alaska Native137 41.1% Asian474 54.0% Other race1,404 82.0% Two or more races13,985 89.8% White alone, not Hispanic / Latino1,627 80.2% Hispanic or LatinoMoved within same county 723 4.5% White / Caucasian630 11.3% Black or African American93 27.9% Asian431 49.1% Other race115 6.7% Two or more races692 4.4% White alone, not Hispanic / Latino353 17.4% Hispanic or LatinoMoved within same state 282 1.7% White / Caucasian84 1.5% Black or African American29 8.7% Asian17 1.9% Other race7 0.4% Two or more races284 1.8% White alone, not Hispanic / Latino44 2.2% Hispanic or LatinoMoved from different state 562 3.5% White / Caucasian386 6.9% Black or African American18 5.3% Asian535 3.4% White alone, not Hispanic / Latino28 1.4% Hispanic or LatinoMoved from abroad 69 0.4% White2 0.3% Other race210 12.3% Two or more races73 0.5% White alone, not Hispanic / Latino2 0.1% Hispanic or Latino
Children Nativity (place of birth) in Simpsonville
Children under 6 years - Living with two parents Both parents native 1,149 100.0% NativeBoth parents foreign-born 94 100.0% NativeOne native, one foreign-born parent 125 100.0% NativeChildren under 6 years - Living with one parent Native parent 433 100.0% NativeChildren 6 to 17 years - Living with two parents Both parents native 2,965 99.2% Native23 0.8% Foreign-bornBoth parents foreign-born 303 82.1% Native66 17.9% Foreign-bornOne native, one foreign-born parent 98 100.0% NativeChildren 6 to 17 years - Living with one parent Native parent 674 100.0% NativeForeign-born parent 42 47.5% Native47 52.5% Foreign-born
Grandparents responsible for own grandchildren in Simpsonville
Grandparents (30 to 59 years) White / Caucasian 18 26.2% Responsible for grandchildren51 73.8% Not responsible for grandchildrenBlack or African American 82 100.0% Not responsible for grandchildrenWhite alone, not Hispanic / Latino 19 27.5% Responsible for grandchildren49 72.5% Not responsible for grandchildrenHispanic or Latino 42 100.0% Not responsible for grandchildrenGrandparents (60 years and over) White / Caucasian 70 62.3% Responsible for grandchildren42 37.7% Not responsible for grandchildrenBlack or African American 49 55.1% Responsible for grandchildren40 44.9% Not responsible for grandchildrenWhite alone, not Hispanic / Latino 72 66.6% Responsible for grandchildren36 33.4% Not responsible for grandchildrenHispanic or Latino 6 100.0% Not responsible for grandchildren