Races in Sioux Falls, South Dakota (SD) Detailed Stats
Data:
Races - White alone (%)
Races - White alone (% change since 2000)
Races - Black alone (%)
Races - Black alone (% change since 2000)
Races - American Indian alone (%)
Races - American Indian alone (% change since 2000)
Races - Asian alone (%)
Races - Asian alone (% change since 2000)
Races - Hispanic (%)
Races - Hispanic (% change since 2000)
Races - Native Hawaiian and Other Pacific Islander alone (%)
Races - Native Hawaiian and Other Pacific Islander alone (% change since 2000)
Races - Two or more races(%)
Races - Two or more races(% change since 2000)
Races - Other race alone (%)
Races - Other race alone (% change since 2000)
Racial diversity
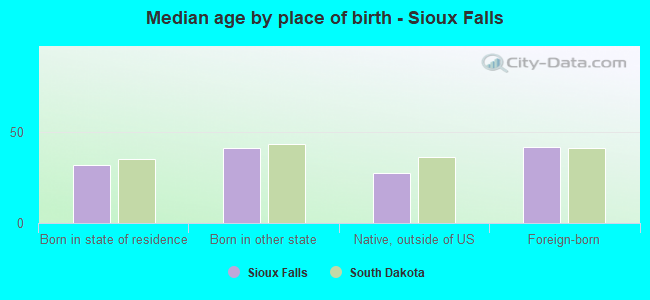
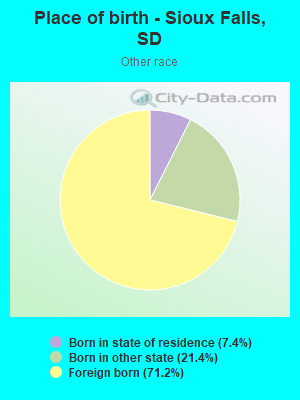
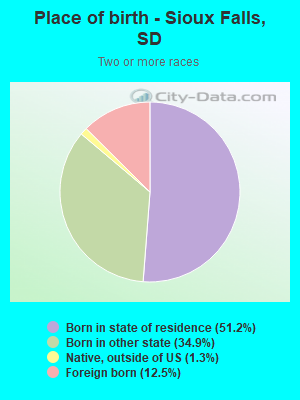
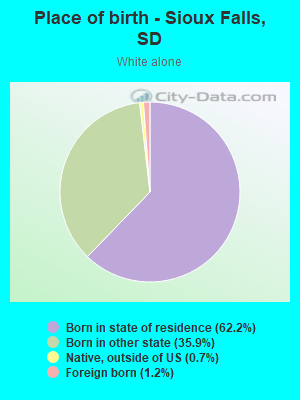
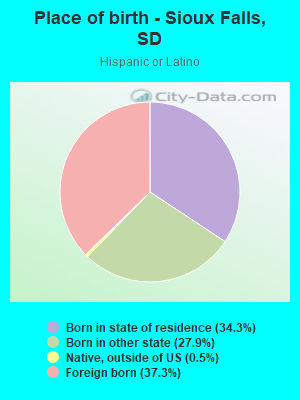
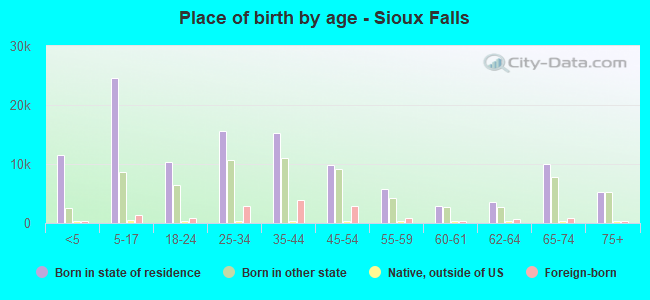
Place of birth - Born in state of residence (%)
Place of birth - Born in state of residence (%) - White
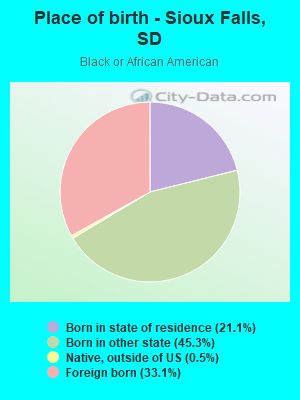
Place of birth - Born in state of residence (%) - Black or African American
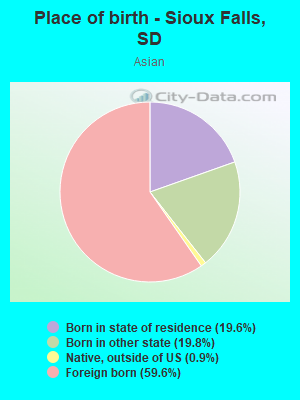
Place of birth - Born in state of residence (%) - Asian
Place of birth - Born in state of residence (%) - Hispanic or Latino
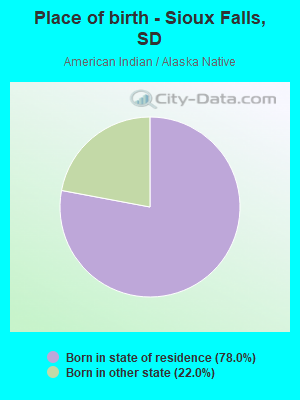
Place of birth - Born in state of residence (%) - American Indian and Alaska Native
Place of birth - Born in state of residence (%) - Multirace
Place of birth - Born in state of residence (%) - Other Race
Place of birth - Born in other state (%)
Place of birth - Born in other state (%) - White
Place of birth - Born in other state (%) - Black or African American
Place of birth - Born in other state (%) - Asian
Place of birth - Born in other state (%) - Hispanic or Latino
Place of birth - Born in other state (%) - American Indian and Alaska Native
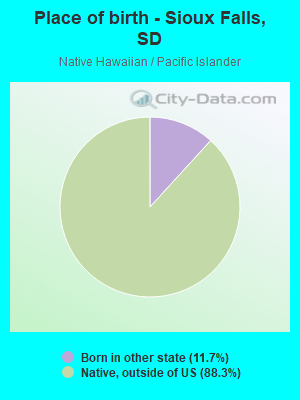
Place of birth - Born in other state (%) - Multirace
Place of birth - Born in other state (%) - Other Race
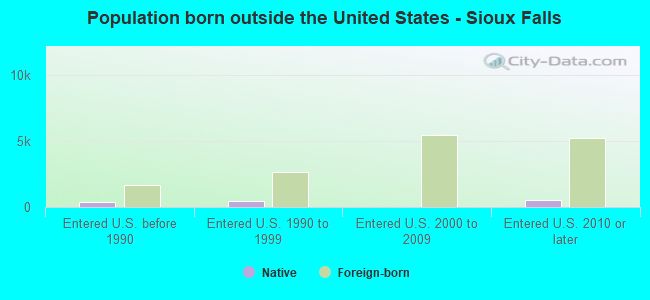
Place of birth - Native, outside of US (%)
Place of birth - Native, outside of US (%) - White
Place of birth - Native, outside of US (%) - Black or African American
Place of birth - Native, outside of US (%) - Asian
Place of birth - Native, outside of US (%) - Hispanic or Latino
Place of birth - Native, outside of US (%) - American Indian and Alaska Native
Place of birth - Native, outside of US (%) - Multirace
Place of birth - Native, outside of US (%) - Other Race
Place of birth - Foreign born (%)
Place of birth - Foreign born (%) - White
Place of birth - Foreign born (%) - Black or African American
Place of birth - Foreign born (%) - Asian
Place of birth - Foreign born (%) - Hispanic or Latino
Place of birth - Foreign born (%) - American Indian and Alaska Native
Place of birth - Foreign born (%) - Multirace
Place of birth - Foreign born (%) - Other Race
Residents speaking English at home (%)
Residents speaking English at home - Born in the United States (%)
Residents speaking English at home - Native, born elsewhere (%)
Residents speaking English at home - Foreign born (%)
Residents speaking Spanish at home (%)
Residents speaking Spanish at home - Born in the United States (%)
Residents speaking Spanish at home - Native, born elsewhere (%)
Residents speaking Spanish at home - Foreign born (%)
Residents speaking other language at home (%)
Residents speaking other language at home - Born in the United States (%)
Residents speaking other language at home - Native, born elsewhere (%)
Residents speaking other language at home - Foreign born (%)
Marital status - Never married (%)
Marital status - Now married (%)
Marital status - Separated (%)
Marital status - Widowed (%)
Marital status - Divorced (%)
Ancestries Reported - Arab (%)
Ancestries Reported - Czech (%)
Ancestries Reported - Danish (%)
Ancestries Reported - Dutch (%)
Ancestries Reported - English (%)
Ancestries Reported - French (%)
Ancestries Reported - French Canadian (%)
Ancestries Reported - German (%)
Ancestries Reported - Greek (%)
Ancestries Reported - Hungarian (%)
Ancestries Reported - Irish (%)
Ancestries Reported - Italian (%)
Ancestries Reported - Lithuanian (%)
Ancestries Reported - Norwegian (%)
Ancestries Reported - Polish (%)
Ancestries Reported - Portuguese (%)
Ancestries Reported - Russian (%)
Ancestries Reported - Scotch-Irish (%)
Ancestries Reported - Scottish (%)
Ancestries Reported - Slovak (%)
Ancestries Reported - Subsaharan African (%)
Ancestries Reported - Swedish (%)
Ancestries Reported - Swiss (%)
Ancestries Reported - Ukrainian (%)
Ancestries Reported - United States (%)
Ancestries Reported - Welsh (%)
Ancestries Reported - West Indian (%)
Ancestries Reported - Other (%)
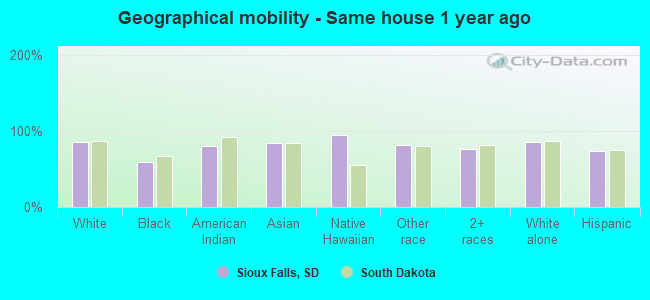
Geographical mobility - Same house 1 year ago (%)
Geographical mobility - Same house 1 year ago (%) - White
Geographical mobility - Same house 1 year ago (%) - Black or African American
Geographical mobility - Same house 1 year ago (%) - Asian
Geographical mobility - Same house 1 year ago (%) - Hispanic or Latino
Geographical mobility - Same house 1 year ago (%) - American Indian and Alaska Native
Geographical mobility - Same house 1 year ago (%) - Multirace
Geographical mobility - Same house 1 year ago (%) - Other Race
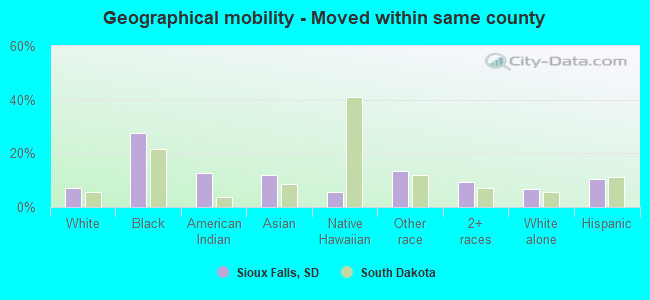
Geographical mobility - Moved within same county (%)
Geographical mobility - Moved within same county (%) - White
Geographical mobility - Moved within same county (%) - Black or African American
Geographical mobility - Moved within same county (%) - Asian
Geographical mobility - Moved within same county (%) - Hispanic or Latino
Geographical mobility - Moved within same county (%) - American Indian and Alaska Native
Geographical mobility - Moved within same county (%) - Multirace
Geographical mobility - Moved within same county (%) - Other Race
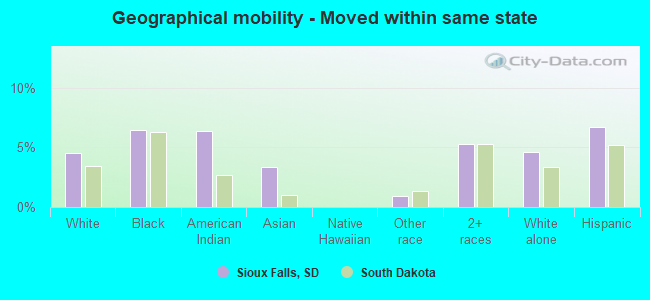
Geographical mobility - Moved from different county within same state (%)
Geographical mobility - Moved from different county within same state (%) - White
Geographical mobility - Moved from different county within same state (%) - Black or African American
Geographical mobility - Moved from different county within same state (%) - Asian
Geographical mobility - Moved from different county within same state (%) - Hispanic or Latino
Geographical mobility - Moved from different county within same state (%) - American Indian and Alaska Native
Geographical mobility - Moved from different county within same state (%) - Multirace
Geographical mobility - Moved from different county within same state (%) - Other Race
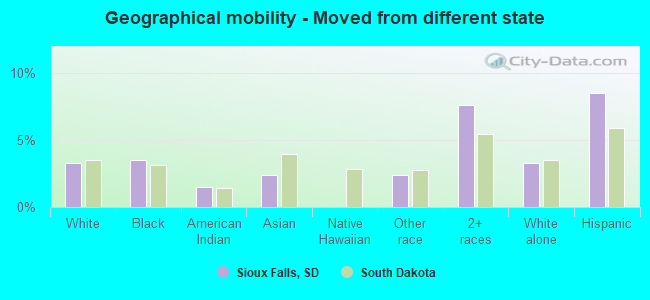
Geographical mobility - Moved from different state (%)
Geographical mobility - Moved from different state (%) - White
Geographical mobility - Moved from different state (%) - Black or African American
Geographical mobility - Moved from different state (%) - Asian
Geographical mobility - Moved from different state (%) - Hispanic or Latino
Geographical mobility - Moved from different state (%) - American Indian and Alaska Native
Geographical mobility - Moved from different state (%) - Multirace
Geographical mobility - Moved from different state (%) - Other Race
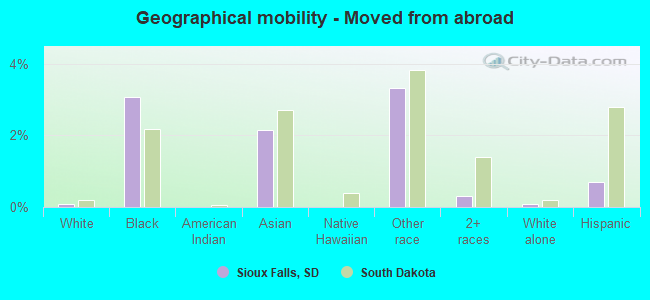
Geographical mobility - Moved from abroad (%)
Geographical mobility - Moved from abroad (%) - White
Geographical mobility - Moved from abroad (%) - Black or African American
Geographical mobility - Moved from abroad (%) - Asian
Geographical mobility - Moved from abroad (%) - Hispanic or Latino
Geographical mobility - Moved from abroad (%) - American Indian and Alaska Native
Geographical mobility - Moved from abroad (%) - Multirace
Geographical mobility - Moved from abroad (%) - Other Race
Place of birth for the foreign-born population - Ireland (%)
Place of birth for the foreign-born population - Denmark (%)
Place of birth for the foreign-born population - Norway (%)
Place of birth for the foreign-born population - Sweden (%)
Place of birth for the foreign-born population - United Kingdom (%)
Place of birth for the foreign-born population - England (%)
Place of birth for the foreign-born population - Scotland (%)
Place of birth for the foreign-born population - Other Northern Europe (%)
Place of birth for the foreign-born population - Austria (%)
Place of birth for the foreign-born population - Belgium (%)
Place of birth for the foreign-born population - France (%)
Place of birth for the foreign-born population - Germany (%)
Place of birth for the foreign-born population - Netherlands (%)
Place of birth for the foreign-born population - Switzerland (%)
Place of birth for the foreign-born population - Other Western Europe (%)
Place of birth for the foreign-born population - Greece (%)
Place of birth for the foreign-born population - Italy (%)
Place of birth for the foreign-born population - Portugal (%)
Place of birth for the foreign-born population - Spain (%)
Place of birth for the foreign-born population - Other Southern Europe (%)
Place of birth for the foreign-born population - Albania (%)
Place of birth for the foreign-born population - Belarus (%)
Place of birth for the foreign-born population - Bosnia and Herzegovina (%)
Place of birth for the foreign-born population - Bulgaria (%)
Place of birth for the foreign-born population - Croatia (%)
Place of birth for the foreign-born population - Czechoslovakia (%)
Place of birth for the foreign-born population - Hungary (%)
Place of birth for the foreign-born population - Latvia (%)
Place of birth for the foreign-born population - Lithuania (%)
Place of birth for the foreign-born population - North Macedonia (Macedonia) (%)
Place of birth for the foreign-born population - Moldova (%)
Place of birth for the foreign-born population - Poland (%)
Place of birth for the foreign-born population - Romania (%)
Place of birth for the foreign-born population - Russia (%)
Place of birth for the foreign-born population - Serbia (%)
Place of birth for the foreign-born population - Ukraine (%)
Place of birth for the foreign-born population - Other Eastern Europe (%)
Place of birth for the foreign-born population - China (%)
Place of birth for the foreign-born population - Hong Kong (%)
Place of birth for the foreign-born population - Taiwan (%)
Place of birth for the foreign-born population - Japan (%)
Place of birth for the foreign-born population - Korea (%)
Place of birth for the foreign-born population - Other Eastern Asia (%)
Place of birth for the foreign-born population - Afghanistan (%)
Place of birth for the foreign-born population - Bangladesh (%)
Place of birth for the foreign-born population - India (%)
Place of birth for the foreign-born population - Iran (%)
Place of birth for the foreign-born population - Kazakhstan (%)
Place of birth for the foreign-born population - Nepal (%)
Place of birth for the foreign-born population - Pakistan (%)
Place of birth for the foreign-born population - Sri Lanka (%)
Place of birth for the foreign-born population - Uzbekistan (%)
Place of birth for the foreign-born population - Other South Central Asia (%)
Place of birth for the foreign-born population - Burma (%)
Place of birth for the foreign-born population - Cambodia (%)
Place of birth for the foreign-born population - Indonesia (%)
Place of birth for the foreign-born population - Laos (%)
Place of birth for the foreign-born population - Malaysia (%)
Place of birth for the foreign-born population - Philippines (%)
Place of birth for the foreign-born population - Singapore (%)
Place of birth for the foreign-born population - Thailand (%)
Place of birth for the foreign-born population - Vietnam (%)
Place of birth for the foreign-born population - Other South Eastern Asia (%)
Place of birth for the foreign-born population - Armenia (%)
Place of birth for the foreign-born population - Iraq (%)
Place of birth for the foreign-born population - Israel (%)
Place of birth for the foreign-born population - Jordan (%)
Place of birth for the foreign-born population - Kuwait (%)
Place of birth for the foreign-born population - Lebanon (%)
Place of birth for the foreign-born population - Saudi Arabia (%)
Place of birth for the foreign-born population - Syria (%)
Place of birth for the foreign-born population - Turkey (%)
Place of birth for the foreign-born population - Yemen (%)
Place of birth for the foreign-born population - Other Western Asia (%)
Place of birth for the foreign-born population - Eritrea (%)
Place of birth for the foreign-born population - Ethiopia (%)
Place of birth for the foreign-born population - Kenya (%)
Place of birth for the foreign-born population - Somalia (%)
Place of birth for the foreign-born population - Uganda (%)
Place of birth for the foreign-born population - Zimbabwe (%)
Place of birth for the foreign-born population - Other Eastern Africa (%)
Place of birth for the foreign-born population - Cameroon (%)
Place of birth for the foreign-born population - Congo (%)
Place of birth for the foreign-born population - Democratic Republic of Congo (Zaire) (%)
Place of birth for the foreign-born population - Other Middle Africa (%)
Place of birth for the foreign-born population - Egypt (%)
Place of birth for the foreign-born population - Morocco (%)
Place of birth for the foreign-born population - Sudan (%)
Place of birth for the foreign-born population - Other Northern Africa (%)
Place of birth for the foreign-born population - South Africa (%)
Place of birth for the foreign-born population - Other Southern Africa (%)
Place of birth for the foreign-born population - Cabo Verde (%)
Place of birth for the foreign-born population - Ghana (%)
Place of birth for the foreign-born population - Liberia (%)
Place of birth for the foreign-born population - Nigeria (%)
Place of birth for the foreign-born population - Senegal (%)
Place of birth for the foreign-born population - Sierra Leone (%)
Place of birth for the foreign-born population - Other Western Africa (%)
Place of birth for the foreign-born population - Australia (%)
Place of birth for the foreign-born population - New Zealand (%)
Place of birth for the foreign-born population - Fiji (%)
Place of birth for the foreign-born population - Micronesia (%)
Place of birth for the foreign-born population - Bahamas (%)
Place of birth for the foreign-born population - Barbados (%)
Place of birth for the foreign-born population - Cuba (%)
Place of birth for the foreign-born population - Dominica (%)
Place of birth for the foreign-born population - Dominican Republic (%)
Place of birth for the foreign-born population - Grenada (%)
Place of birth for the foreign-born population - Haiti (%)
Place of birth for the foreign-born population - Jamaica (%)
Place of birth for the foreign-born population - St. Vincent and the Grenadines (%)
Place of birth for the foreign-born population - Trinidad and Tobago (%)
Place of birth for the foreign-born population - West Indies (%)
Place of birth for the foreign-born population - Other Caribbean (%)
Place of birth for the foreign-born population - Belize (%)
Place of birth for the foreign-born population - Costa Rica (%)
Place of birth for the foreign-born population - El Salvador (%)
Place of birth for the foreign-born population - Guatemala (%)
Place of birth for the foreign-born population - Honduras (%)
Place of birth for the foreign-born population - Mexico (%)
Place of birth for the foreign-born population - Nicaragua (%)
Place of birth for the foreign-born population - Panama (%)
Place of birth for the foreign-born population - Other Central America (%)
Place of birth for the foreign-born population - Argentina (%)
Place of birth for the foreign-born population - Bolivia (%)
Place of birth for the foreign-born population - Brazil (%)
Place of birth for the foreign-born population - Chile (%)
Place of birth for the foreign-born population - Colombia (%)
Place of birth for the foreign-born population - Ecuador (%)
Place of birth for the foreign-born population - Guyana (%)
Place of birth for the foreign-born population - Peru (%)
Place of birth for the foreign-born population - Uruguay (%)
Place of birth for the foreign-born population - Venezuela (%)
Place of birth for the foreign-born population - Other South America (%)
Place of birth for the foreign-born population - Canada (%)
Place of birth for the foreign-born population - Other Northern America (%)
Place of birth for the foreign-born population - Other (%)
According to 2022 data, the most numerous races in Sioux Falls, SD are White alone (156,416 residents), American Indian alone (4,016 residents), and Hispanic (13,301 residents). 90.7% of Sioux Falls residents speak English at home. 8.6% of Sioux Falls, SD residents are foreign-born (3.4% born in Africa, 2.2% born in Asia, 1.9% born in Latin America, 1.1% born in Europe), which is 65.0% greater than the foreign-born rate of 3.0% across the entire state of South Dakota.
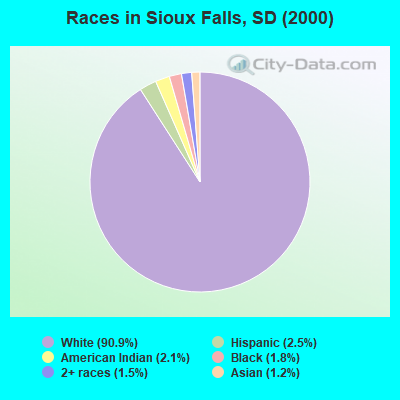
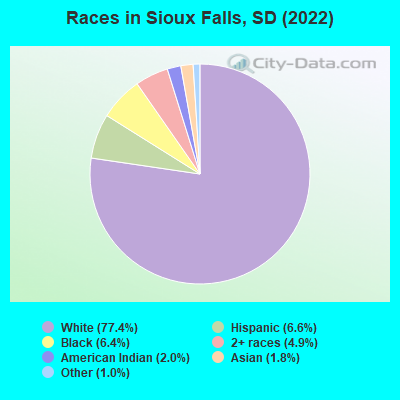
Race distribution in Sioux Falls
2000 2022
112,703 90.9% White alone 3,087 2.5% Hispanic 2,558 2.1% American Indian alone 2,198 1.8% Black alone 1,818 1.5% Two or more races 1,467 1.2% Asian alone 95 0.08% Other race alone 49 0.04% Native Hawaiian and Other
156,416 77.4% White alone 13,301 6.6% Hispanic 12,883 6.4% Black alone 9,833 4.9% Two or more races 4,016 2.0% American Indian alone 3,585 1.8% Asian alone 1,997 1.0% Other race alone 59 0.03% Native Hawaiian and Other
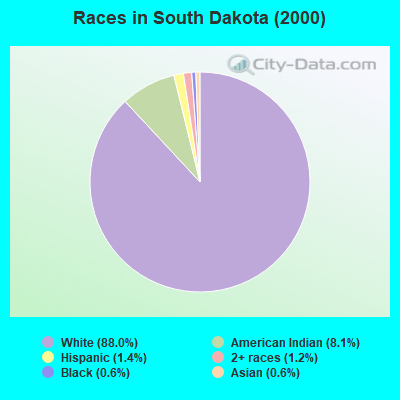
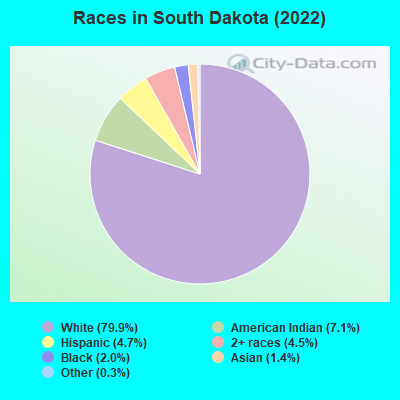
2000 2022
664,585 88.0% White alone 60,988 8.1% American Indian alone 10,903 1.4% Hispanic 8,960 1.2% Two or more races 4,563 0.6% Black alone 4,316 0.6% Asian alone 310 0.04% Other race alone 219 0.03% Native Hawaiian and Other
726,885 79.9% White alone 64,666 7.1% American Indian alone 42,430 4.7% Hispanic 40,984 4.5% Two or more races 18,053 2.0% Black alone 12,874 1.4% Asian alone 3,136 0.3% Other race alone 796 0.09% Native Hawaiian and Other
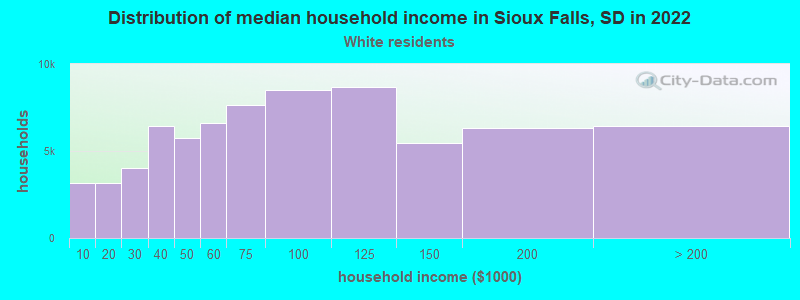
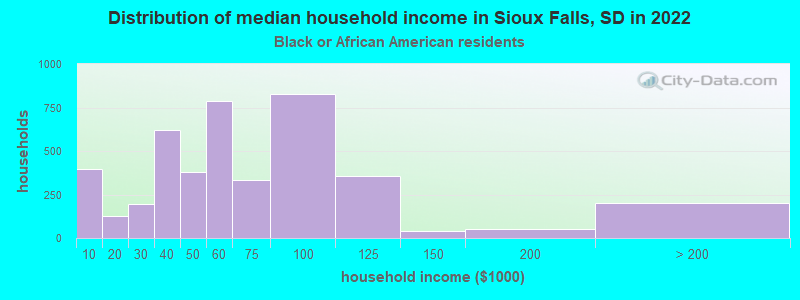
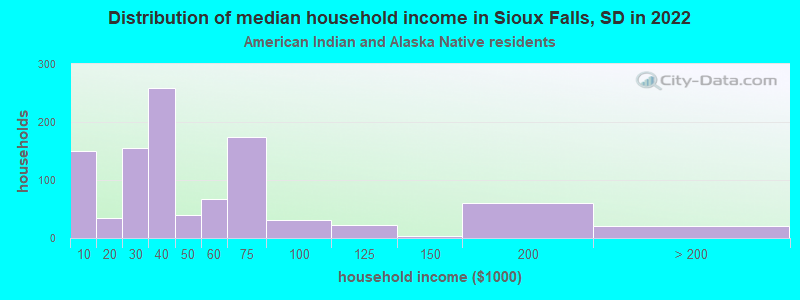
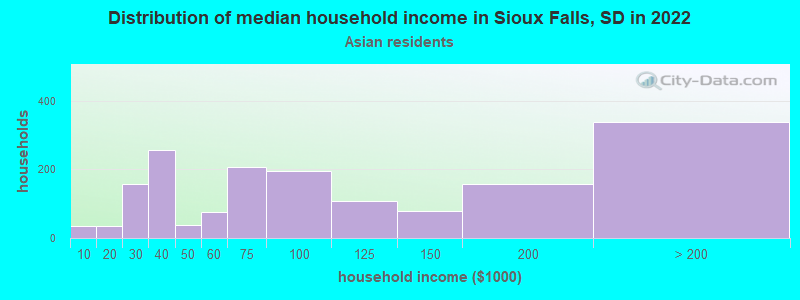
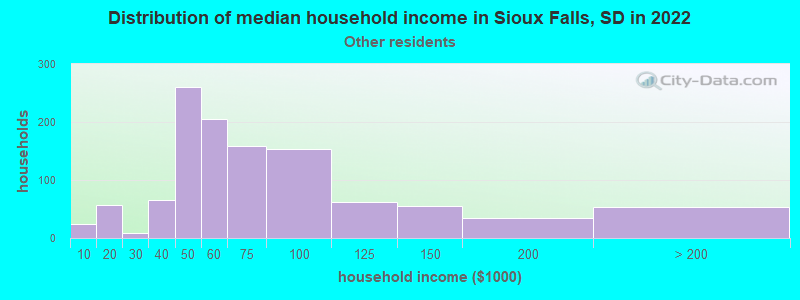
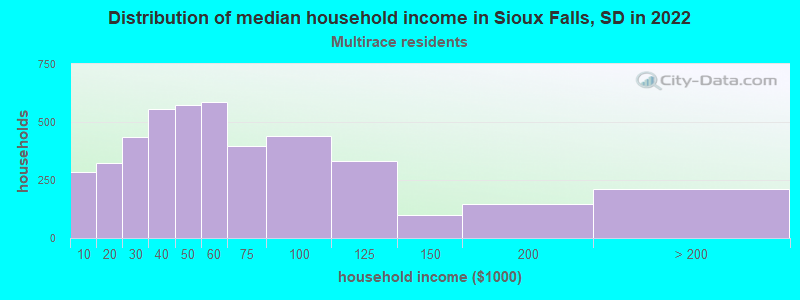
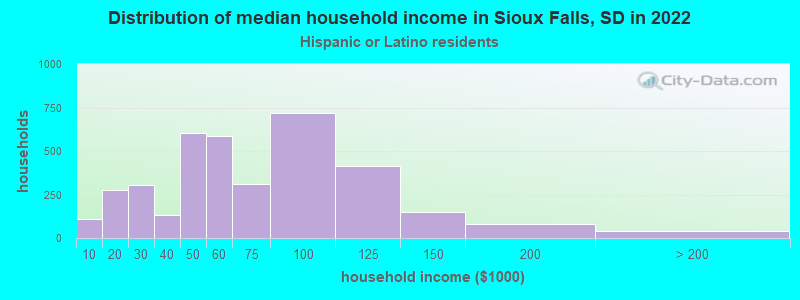
Income and house value in Sioux Falls Median household income in 2022 $72,941 White non-Hispanic householders$77,659 Black householders$56,436 American Indian and Alaska Native householders$62,003 Asian householders$71,655 Some other race householders$53,713 Two or more races householders$53,713 Hispanic or Latino race householdersMedian 2022 house value $287,864 White Non-Hispanic householders$297,459 Black or African American householders$182,878 American Indian or Alaska Native householders $239,886 Asian householders$176,387 Some other race householders$241,298 Two or more races householders$273,471 Hispanic or Latino householders
Median age by race in Sioux Falls
38.6 Median age for White residents37.6 40.0 34.2 Median age for Black or African American residents34.2 34.2 27.2 Median age for American Indian / Alaska Native residents23.9 27.9 31.4 Median age for Asian residents28.8 33.0 -666,666,666.0 Median age for Native Hawaiian / Pacific Islander residents-666,666,666.0 -666,666,666.0 37.5 Median age for Other race residents24.4 45.3 16.4 Median age for Two or more races residents15.4 21.5 39.1 Median age for White alone residents37.8 40.7 23.9 Median age for Hispanic or Latino residents20.0 28.0
Owner/renter occupied households by race in Sioux Falls
House owners and renters - White residents 47,055 65.2% Owner occupied25,164 34.8% Renter occupiedHouse owners and renters - Black or African American residents 2,690 59.4% Owner occupied1,842 40.6% Renter occupiedHouse owners and renters - American Indian / Alaska Native residents 444 29.2% Owner occupied1,076 70.8% Renter occupiedHouse owners and renters - Asian residents 420 31.5% Owner occupied915 68.5% Renter occupiedHouse owners and renters - Other race residents 1,232 49.6% Owner occupied1,253 50.4% Renter occupiedHouse owners and renters - Two or more races residents 2,072 46.3% Owner occupied2,402 53.7% Renter occupiedHouse owners and renters - White alone residents 46,887 65.2% Owner occupied24,993 34.8% Renter occupiedHouse owners and renters - Hispanic or Latino residents 2,047 46.0% Owner occupied2,407 54.0% Renter occupied
Language usage in Sioux Falls
English speakers - Total 90.7% of residents of Sioux Falls speak English at home.
4.5% of residents speak Spanish at home 4,910 57.9% Speak English very well3,577 42.1% Speak English less than very well4.8% of residents speak other language at home 5,523 61.2% Speak English very well3,504 38.8% Speak English less than very well
English speakers - Born in the United States 95.1% of residents of Sioux Falls speak English at home.
3.1% of residents speak Spanish at home 2,040 95.5% Speak English very well96 4.5% Speak English less than very well1.8% of residents speak other language at home 959 79.5% Speak English very well247 20.5% Speak English less than very well
English speakers - Native, born elsewhere 94.9% of residents of Sioux Falls speak English at home.
5.1% of residents speak Spanish at home 68 100.0% Speak English very well
English speakers - Foreign-born 21.7% of residents of Sioux Falls speak English at home.
32.3% of residents speak Spanish at home 1,493 30.9% Speak English very well3,345 69.1% Speak English less than very well46.0% of residents speak other language at home 3,684 53.4% Speak English very well3,214 46.6% Speak English less than very well
White (Caucasian) - Speak only English Native:
98.4% (145,288)Foreign-born:
34.8% (640)
White (Caucasian) - Speak another language Native:
1.6% (2,320)Foreign-born:
65.2% (1,197)
Black or African American - Speak only English Native:
96.3% (6,477)Foreign-born:
43.6% (1,864)
Black or African American - Speak another language Native:
3.7% (250)Foreign-born:
56.4% (2,408)
Asian - Speak only English Native:
60.7% (700)Foreign-born:
13.3% (289)
Asian - Speak another language Native:
39.3% (454)Foreign-born:
86.7% (1,876)
Other race - Speak only English Native:
56.5% (1,095)Foreign-born:
4.1% (196)
Other race - Speak another language Native:
43.5% (844)Foreign-born:
95.9% (4,587)
Two or more races - Speak only English Native:
84.3% (9,523)Foreign-born:
13.8% (266)
Two or more races - Speak another language Native:
15.7% (1,774)Foreign-born:
86.2% (1,668)
White alone - Speak only English Native:
98.6% (143,747)Foreign-born:
36.3% (640)
White alone - Speak another language Native:
1.4% (2,088)Foreign-born:
63.7% (1,122)
Hispanic or Latino - Speak only English Native:
56.7% (3,444)Foreign-born:
2.4% (118)
Hispanic or Latino - Speak another language Native:
43.3% (2,631)Foreign-born:
97.6% (4,838)
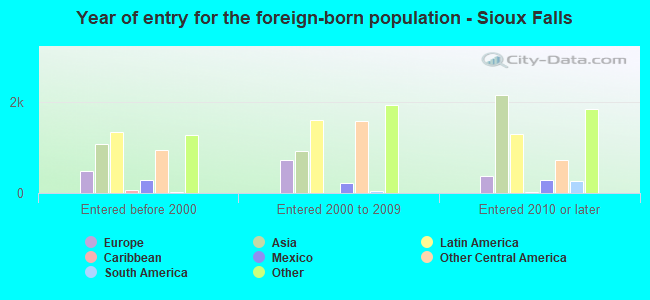
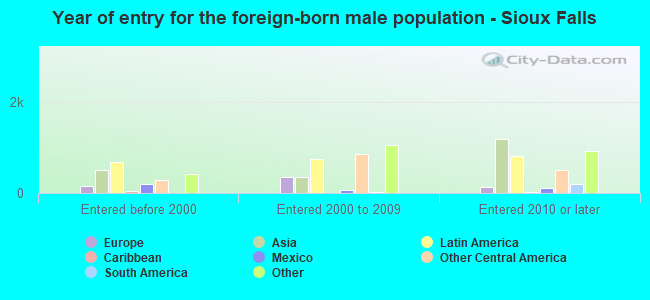
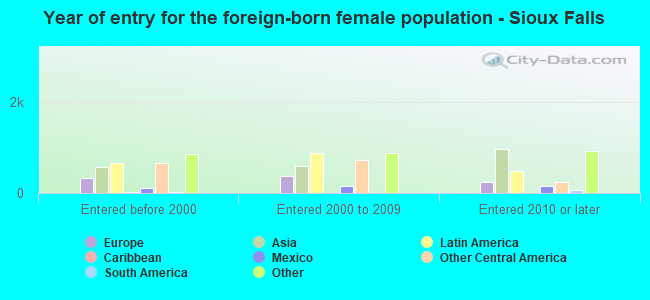
Foreign-born residents in Sioux Falls 17,102 residents are foreign born (3.4% Africa , 2.2% Asia , 1.9% Latin America , 1.1% Europe ).
This city:
8.6%South Dakota:
3.8%
Marital status for residents in Sioux Falls Marital status - White (Caucasian) population 15 years and over
Males 33.5% Never married52.9% Now married1.4% Separated2.0% Widowed10.1% DivorcedFemales 26.2% Never married51.5% Now married1.0% Separated7.7% Widowed13.6% DivorcedWomen who gave birth in the past 12 months Now married:
74.7% (1,816)Unmarried:
25.3% (616)
Women who did not give birth in the past 12 months Now married:
46.8% (15,579)Unmarried:
53.2% (17,730)
Marital status - Black or African American population 15 years and over
Males 45.1% Never married43.4% Now married1.8% Separated0.7% Widowed9.0% DivorcedFemales 45.9% Never married37.9% Now married3.0% Separated2.8% Widowed10.4% DivorcedWomen who gave birth in the past 12 months Now married:
64.5% (164)Unmarried:
35.5% (90)
Women who did not give birth in the past 12 months Now married:
40.2% (1,200)Unmarried:
59.8% (1,786)
Marital status - American Indian / Alaska Native population 15 years and over
Males 69.2% Never married20.1% Now married5.2% Separated0.4% Widowed5.2% DivorcedFemales 57.8% Never married30.8% Now married0.6% Separated1.6% Widowed9.2% DivorcedWomen who gave birth in the past 12 months Now married:
12.4% (23)Unmarried:
87.6% (161)
Women who did not give birth in the past 12 months Now married:
32.9% (273)Unmarried:
67.1% (556)
Marital status - Asian population 15 years and over
Males 34.3% Never married58.7% Now married1.4% Separated0.7% Widowed4.8% DivorcedFemales 29.9% Never married59.4% Now married3.2% Separated5.2% Widowed2.4% DivorcedWomen who gave birth in the past 12 months Now married:
100.0% (294)Unmarried:
0.0% (0)
Women who did not give birth in the past 12 months Now married:
36.4% (333)Unmarried:
63.6% (582)
Marital status - Native Hawaiian / Pacific Islander population 15 years and over
Males 100.0% Never married0.0% Now married0.0% Separated0.0% Widowed0.0% DivorcedFemales 0.0% Never married100.0% Now married0.0% Separated0.0% Widowed0.0% DivorcedMarital status - Other race population 15 years and over
Males 53.6% Never married30.6% Now married3.5% Separated3.2% Widowed9.2% DivorcedFemales 24.1% Never married40.1% Now married0.0% Separated0.0% Widowed35.8% DivorcedWomen who gave birth in the past 12 months Now married:
100.0% (49)Unmarried:
0.0% (0)
Women who did not give birth in the past 12 months Now married:
23.5% (229)Unmarried:
76.5% (746)
Marital status - Two or more races population 15 years and over
Males 54.4% Never married38.4% Now married2.3% Separated0.0% Widowed4.8% DivorcedFemales 52.8% Never married30.6% Now married7.3% Separated3.0% Widowed6.4% DivorcedWomen who gave birth in the past 12 months Now married:
29.6% (118)Unmarried:
70.4% (281)
Women who did not give birth in the past 12 months Now married:
29.8% (729)Unmarried:
70.2% (1,719)
Marital status - White alone, not Hispanic / Latino population 15 years and over
Males 33.3% Never married53.3% Now married1.5% Separated2.0% Widowed10.0% DivorcedFemales 25.8% Never married51.7% Now married1.0% Separated7.7% Widowed13.7% DivorcedWomen who gave birth in the past 12 months Now married:
74.7% (1,816)Unmarried:
25.3% (616)
Women who did not give birth in the past 12 months Now married:
47.3% (15,516)Unmarried:
52.7% (17,315)
Marital status - Hispanic or Latino population 15 years and over
Males 59.6% Never married30.3% Now married3.5% Separated2.2% Widowed4.3% DivorcedFemales 43.7% Never married30.5% Now married1.3% Separated2.9% Widowed21.6% DivorcedWomen who gave birth in the past 12 months Now married:
25.0% (118)Unmarried:
75.0% (354)
Women who did not give birth in the past 12 months Now married:
35.3% (865)Unmarried:
64.7% (1,587)
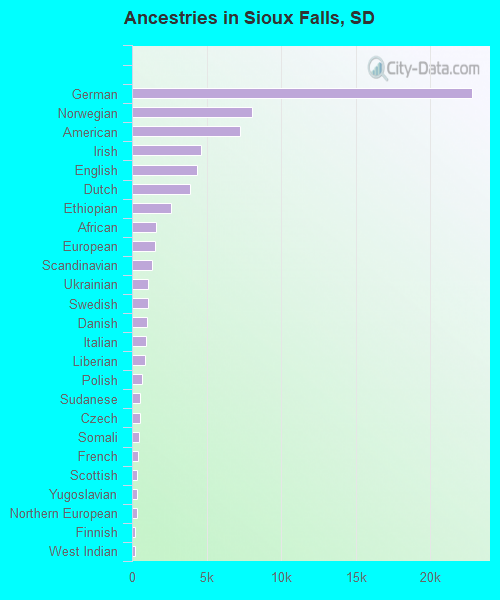
Ancestries in Sioux Falls
22,796 25.6% German8,061 9.1% Norwegian7,230 8.1% American4,622 5.2% Irish4,366 4.9% English3,879 4.4% Dutch2,627 3.0% Ethiopian1,601 1.8% African1,560 1.8% European1,345 1.5% Scandinavian1,102 1.2% Ukrainian1,082 1.2% Swedish1,005 1.1% Danish920 1.0% Italian873 1.0% Liberian683 0.8% Polish552 0.6% Sudanese522 0.6% Czech455 0.5% Somali433 0.5% French345 0.4% Scottish341 0.4% Yugoslavian330 0.4% Northern European221 0.2% Finnish213 0.2% West Indian183 0.2% Afghan168 0.2% Russian153 0.2% Greek126 0.1% Serbian118 0.1% Albanian110 0.1% Austrian104 0.1% Lebanese92 0.1% Belgian85 0.10% French Canadian84 0.09% Iraqi72 0.08% Swiss55 0.06% Eastern European54 0.06% Scotch-Irish51 0.06% British51 0.06% Welsh47 0.05% Czechoslovakian47 0.05% Celtic42 0.05% Croatian42 0.05% Portuguese34 0.04% Egyptian33 0.04% Canadian31 0.03% Pennsylvania German30 0.03% Arab30 0.03% Hungarian28 0.03% Nigerian24 0.03% Haitian24 0.03% Slovak22 0.02% Luxembourger18 0.02% Jamaican17 0.02% Armenian15 0.02% Palestinian15 0.02% Iranian13 0.01% Basque11 0.01% German Russian10 0.01% Jordanian10 0.01% Maltese9 0.01% Ugandan7 0.01% Cypriot
Geographical mobility in Sioux Falls Same house 1 year ago 133,090 84.9% White (Caucasian)7,683 59.5% Black or African American3,369 79.5% American Indian / Alaska Native3,753 84.2% Asian67 94.9% Native Hawaiian / Pacific Islander3,784 81.1% Other race11,324 76.8% Two or more races131,549 85.2% White alone, not Hispanic / Latino9,066 73.6% Hispanic or LatinoMoved within same county 11,248 7.2% White / Caucasian3,551 27.5% Black or African American534 12.6% American Indian / Alaska Native525 11.8% Asian4 5.7% Native Hawaiian / Pacific Islander621 13.3% Other race1,349 9.1% Two or more races10,616 6.9% White alone, not Hispanic / Latino1,286 10.4% Hispanic or LatinoMoved within same state 7,103 4.5% White / Caucasian838 6.5% Black or African American271 6.4% American Indian / Alaska Native151 3.4% Asian44 0.9% Other race775 5.3% Two or more races7,103 4.6% White alone, not Hispanic / Latino830 6.7% Hispanic or LatinoMoved from different state 5,127 3.3% White / Caucasian452 3.5% Black or African American62 1.5% American Indian / Alaska Native106 2.4% Asian112 2.4% Other race1,122 7.6% Two or more races5,052 3.3% White alone, not Hispanic / Latino1,051 8.5% Hispanic or LatinoMoved from abroad 150 0.1% White396 3.1% Black or African American96 2.2% Asian156 3.3% Other race47 0.3% Two or more races150 0.1% White alone, not Hispanic / Latino85 0.7% Hispanic or Latino
Children Nativity (place of birth) in Sioux Falls
Children under 6 years - Living with two parents Both parents native 8,826 100.0% NativeBoth parents foreign-born 1,175 100.0% NativeOne native, one foreign-born parent 898 100.0% NativeChildren under 6 years - Living with one parent Native parent 4,863 100.0% NativeForeign-born parent 200 100.0% NativeChildren 6 to 17 years - Living with two parents Both parents native 17,803 99.6% Native78 0.4% Foreign-bornBoth parents foreign-born 1,647 59.1% Native1,140 40.9% Foreign-bornOne native, one foreign-born parent 1,932 100.0% NativeChildren 6 to 17 years - Living with one parent Native parent 7,484 100.0% NativeForeign-born parent 770 50.0% Native770 50.0% Foreign-born
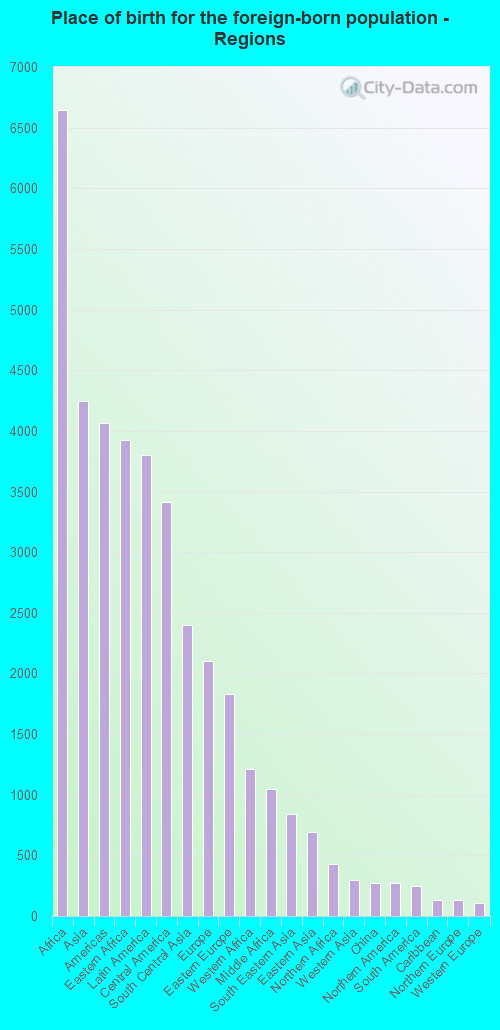
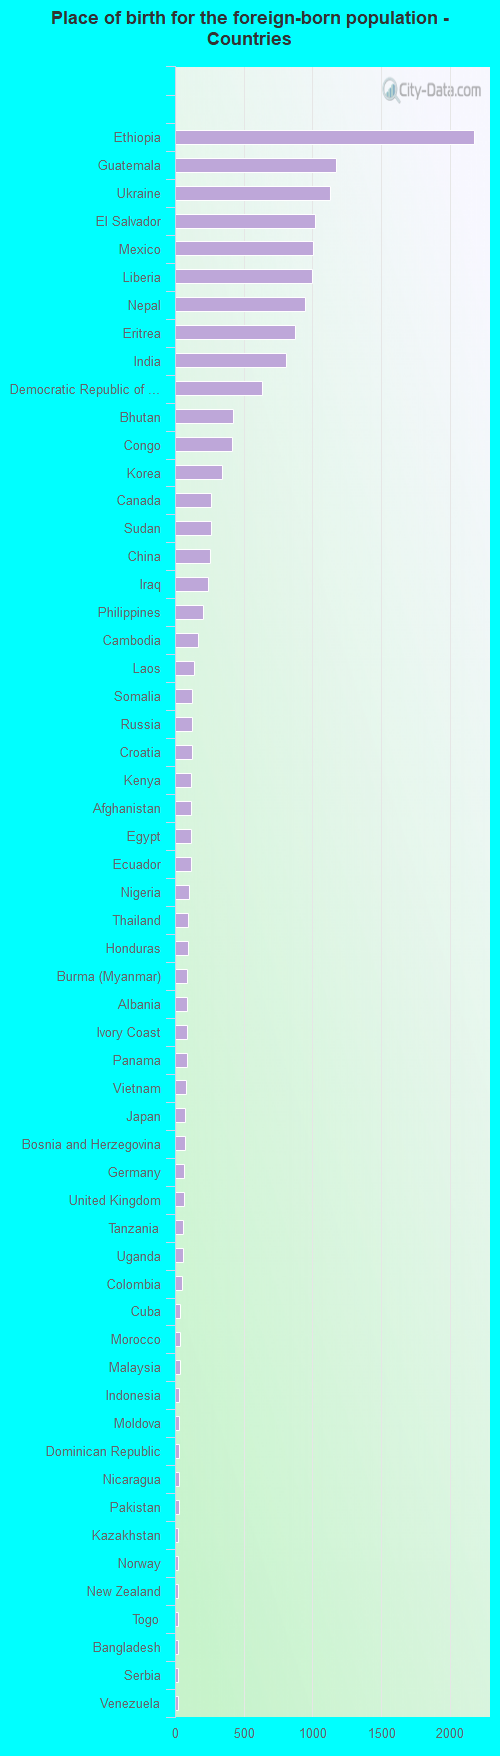
Place of birth for residents in Sioux Falls 6,643 Africa4,250 Asia4,068 Americas3,921 Eastern Africa3,797 Latin America3,411 Central America2,400 South Central Asia2,104 Europe1,832 Eastern Europe1,212 Western Africa1,046 Middle Africa843 South Eastern Asia692 Eastern Asia432 Northern Africa300 Western Asia272 China271 Northern America251 South America133 Caribbean130 Northern Europe104 Western Europe36 Southern Europe35 Oceania35 Australia and New Zealand Subregion16 Southern Africa2,177 Ethiopia1,171 Guatemala1,126 Ukraine1,022 El Salvador1,007 Mexico996 Liberia943 Nepal873 Eritrea806 India633 Democratic Republic of Congo (Zaire)425 Bhutan413 Congo343 Korea264 Canada259 Sudan258 China243 Iraq201 Philippines164 Cambodia139 Laos126 Somalia122 Russia121 Croatia119 Kenya116 Afghanistan116 Egypt113 Ecuador104 Nigeria95 Thailand92 Honduras90 Burma (Myanmar)89 Albania89 Ivory Coast84 Panama82 Vietnam76 Japan71 Bosnia and Herzegovina69 Germany65 United Kingdom61 Tanzania57 Uganda54 Colombia39 Cuba37 Morocco36 Malaysia31 Indonesia30 Moldova29 Dominican Republic26 Nicaragua26 Pakistan25 Kazakhstan24 Norway22 New Zealand22 Togo22 Bangladesh21 Serbia21 Venezuela19 Algeria19 Lebanon18 Scotland18 Zimbabwe18 Chile17 England17 Peru16 Netherlands16 South Africa15 Iran15 Bolivia14 Hong Kong13 Australia13 Jordan13 Israel12 Austria12 Romania12 Brazil11 Haiti11 Azerbaijan7 Belarus6 France6 Greece5 Ireland5 Costa Rica4 Latvia
Grandparents responsible for own grandchildren in Sioux Falls
Grandparents (30 to 59 years) White / Caucasian 214 36.4% Responsible for grandchildren373 63.6% Not responsible for grandchildrenBlack or African American 51 100.0% Responsible for grandchildrenAmerican Indian / Alaska Native 6 100.0% Responsible for grandchildrenAsian 5 8.1% Responsible for grandchildren53 91.9% Not responsible for grandchildrenOther race 19 62.9% Responsible for grandchildren11 37.1% Not responsible for grandchildrenTwo or more races 14 35.7% Responsible for grandchildren26 64.3% Not responsible for grandchildrenWhite alone, not Hispanic / Latino 214 36.7% Responsible for grandchildren369 63.3% Not responsible for grandchildrenHispanic or Latino 16 53.0% Responsible for grandchildren14 47.0% Not responsible for grandchildrenGrandparents (60 years and over) White / Caucasian 229 24.6% Responsible for grandchildren703 75.4% Not responsible for grandchildrenBlack or African American 83 100.0% Not responsible for grandchildrenAmerican Indian / Alaska Native 27 54.8% Responsible for grandchildren22 45.2% Not responsible for grandchildrenAsian 13 33.0% Responsible for grandchildren26 67.0% Not responsible for grandchildrenOther race 36 100.0% Not responsible for grandchildrenWhite alone, not Hispanic / Latino 238 25.4% Responsible for grandchildren696 74.6% Not responsible for grandchildrenHispanic or Latino 11 100.0% Not responsible for grandchildren