Races in Sky Lake, Florida (FL) Detailed Stats
Data:
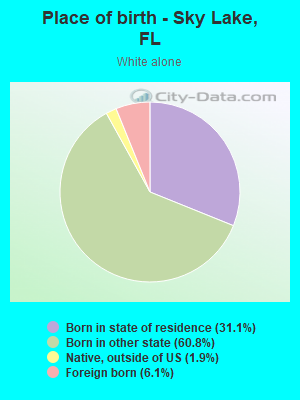
Races - White alone (%)
Races - White alone (% change since 2000)
Races - Black alone (%)
Races - Black alone (% change since 2000)
Races - American Indian alone (%)
Races - American Indian alone (% change since 2000)
Races - Asian alone (%)
Races - Asian alone (% change since 2000)
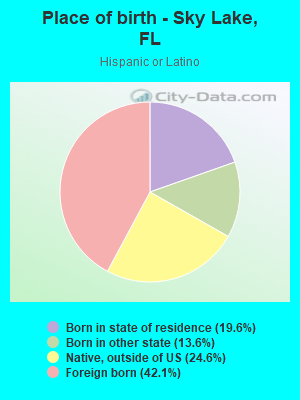
Races - Hispanic (%)
Races - Hispanic (% change since 2000)
Races - Native Hawaiian and Other Pacific Islander alone (%)
Races - Native Hawaiian and Other Pacific Islander alone (% change since 2000)
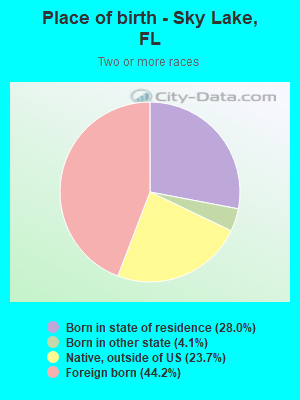
Races - Two or more races(%)
Races - Two or more races(% change since 2000)
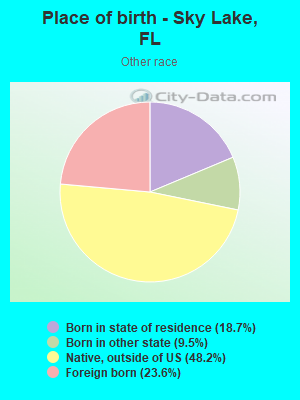
Races - Other race alone (%)
Races - Other race alone (% change since 2000)
Racial diversity
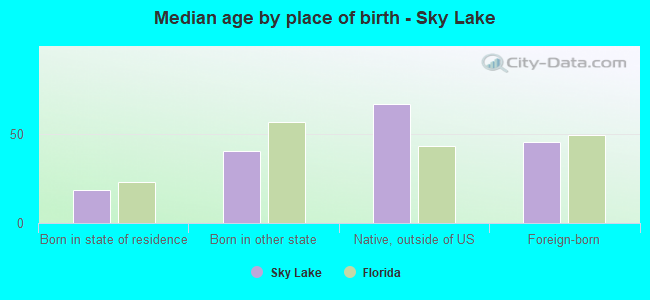
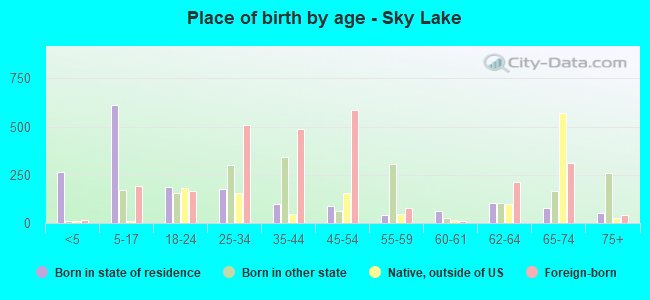
Place of birth - Born in state of residence (%)
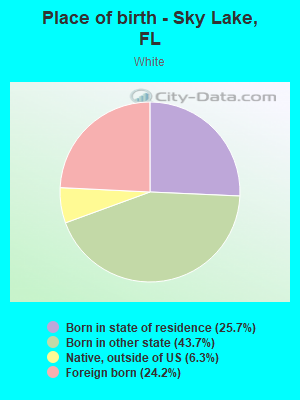
Place of birth - Born in state of residence (%) - White
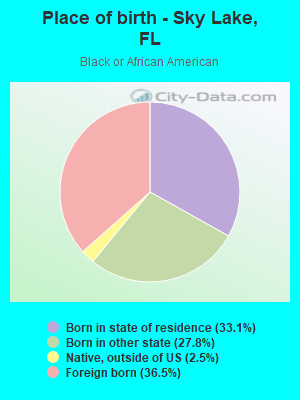
Place of birth - Born in state of residence (%) - Black or African American
Place of birth - Born in state of residence (%) - Asian
Place of birth - Born in state of residence (%) - Hispanic or Latino
Place of birth - Born in state of residence (%) - American Indian and Alaska Native
Place of birth - Born in state of residence (%) - Multirace
Place of birth - Born in state of residence (%) - Other Race
Place of birth - Born in other state (%)
Place of birth - Born in other state (%) - White
Place of birth - Born in other state (%) - Black or African American
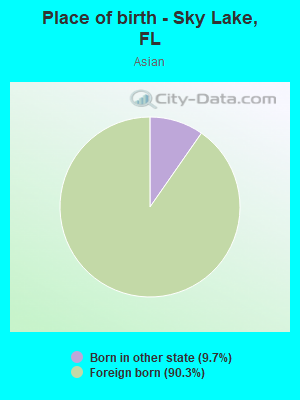
Place of birth - Born in other state (%) - Asian
Place of birth - Born in other state (%) - Hispanic or Latino
Place of birth - Born in other state (%) - American Indian and Alaska Native
Place of birth - Born in other state (%) - Multirace
Place of birth - Born in other state (%) - Other Race
Place of birth - Native, outside of US (%)
Place of birth - Native, outside of US (%) - White
Place of birth - Native, outside of US (%) - Black or African American
Place of birth - Native, outside of US (%) - Asian
Place of birth - Native, outside of US (%) - Hispanic or Latino
Place of birth - Native, outside of US (%) - American Indian and Alaska Native
Place of birth - Native, outside of US (%) - Multirace
Place of birth - Native, outside of US (%) - Other Race
Place of birth - Foreign born (%)
Place of birth - Foreign born (%) - White
Place of birth - Foreign born (%) - Black or African American
Place of birth - Foreign born (%) - Asian
Place of birth - Foreign born (%) - Hispanic or Latino
Place of birth - Foreign born (%) - American Indian and Alaska Native
Place of birth - Foreign born (%) - Multirace
Place of birth - Foreign born (%) - Other Race
Residents speaking English at home (%)
Residents speaking English at home - Born in the United States (%)
Residents speaking English at home - Native, born elsewhere (%)
Residents speaking English at home - Foreign born (%)
Residents speaking Spanish at home (%)
Residents speaking Spanish at home - Born in the United States (%)
Residents speaking Spanish at home - Native, born elsewhere (%)
Residents speaking Spanish at home - Foreign born (%)
Residents speaking other language at home (%)
Residents speaking other language at home - Born in the United States (%)
Residents speaking other language at home - Native, born elsewhere (%)
Residents speaking other language at home - Foreign born (%)
Marital status - Never married (%)
Marital status - Now married (%)
Marital status - Separated (%)
Marital status - Widowed (%)
Marital status - Divorced (%)
Ancestries Reported - Arab (%)
Ancestries Reported - Czech (%)
Ancestries Reported - Danish (%)
Ancestries Reported - Dutch (%)
Ancestries Reported - English (%)
Ancestries Reported - French (%)
Ancestries Reported - French Canadian (%)
Ancestries Reported - German (%)
Ancestries Reported - Greek (%)
Ancestries Reported - Hungarian (%)
Ancestries Reported - Irish (%)
Ancestries Reported - Italian (%)
Ancestries Reported - Lithuanian (%)
Ancestries Reported - Norwegian (%)
Ancestries Reported - Polish (%)
Ancestries Reported - Portuguese (%)
Ancestries Reported - Russian (%)
Ancestries Reported - Scotch-Irish (%)
Ancestries Reported - Scottish (%)
Ancestries Reported - Slovak (%)
Ancestries Reported - Subsaharan African (%)
Ancestries Reported - Swedish (%)
Ancestries Reported - Swiss (%)
Ancestries Reported - Ukrainian (%)
Ancestries Reported - United States (%)
Ancestries Reported - Welsh (%)
Ancestries Reported - West Indian (%)
Ancestries Reported - Other (%)
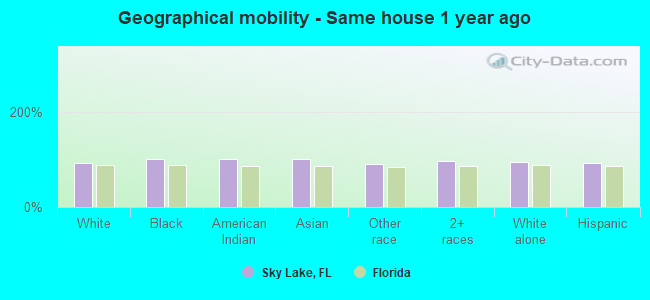
Geographical mobility - Same house 1 year ago (%)
Geographical mobility - Same house 1 year ago (%) - White
Geographical mobility - Same house 1 year ago (%) - Black or African American
Geographical mobility - Same house 1 year ago (%) - Asian
Geographical mobility - Same house 1 year ago (%) - Hispanic or Latino
Geographical mobility - Same house 1 year ago (%) - American Indian and Alaska Native
Geographical mobility - Same house 1 year ago (%) - Multirace
Geographical mobility - Same house 1 year ago (%) - Other Race
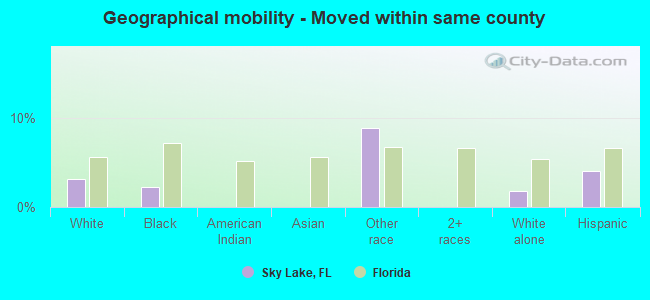
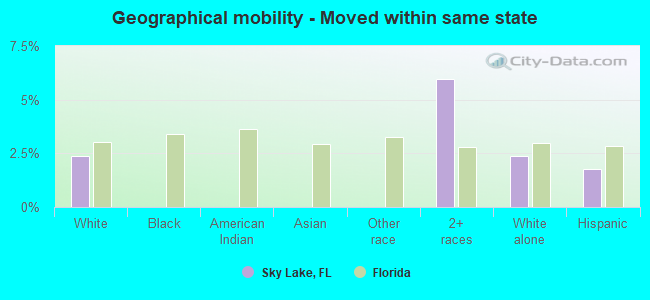
Geographical mobility - Moved within same county (%)
Geographical mobility - Moved within same county (%) - White
Geographical mobility - Moved within same county (%) - Black or African American
Geographical mobility - Moved within same county (%) - Asian
Geographical mobility - Moved within same county (%) - Hispanic or Latino
Geographical mobility - Moved within same county (%) - American Indian and Alaska Native
Geographical mobility - Moved within same county (%) - Multirace
Geographical mobility - Moved within same county (%) - Other Race
Geographical mobility - Moved from different county within same state (%)
Geographical mobility - Moved from different county within same state (%) - White
Geographical mobility - Moved from different county within same state (%) - Black or African American
Geographical mobility - Moved from different county within same state (%) - Asian
Geographical mobility - Moved from different county within same state (%) - Hispanic or Latino
Geographical mobility - Moved from different county within same state (%) - American Indian and Alaska Native
Geographical mobility - Moved from different county within same state (%) - Multirace
Geographical mobility - Moved from different county within same state (%) - Other Race
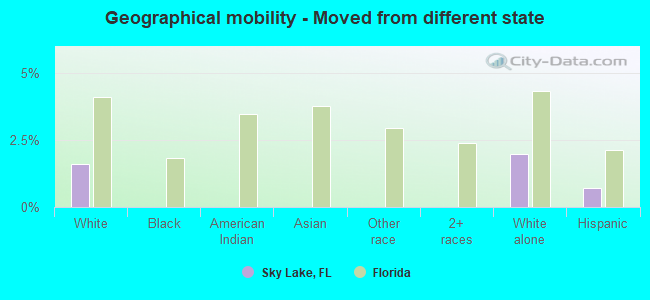
Geographical mobility - Moved from different state (%)
Geographical mobility - Moved from different state (%) - White
Geographical mobility - Moved from different state (%) - Black or African American
Geographical mobility - Moved from different state (%) - Asian
Geographical mobility - Moved from different state (%) - Hispanic or Latino
Geographical mobility - Moved from different state (%) - American Indian and Alaska Native
Geographical mobility - Moved from different state (%) - Multirace
Geographical mobility - Moved from different state (%) - Other Race
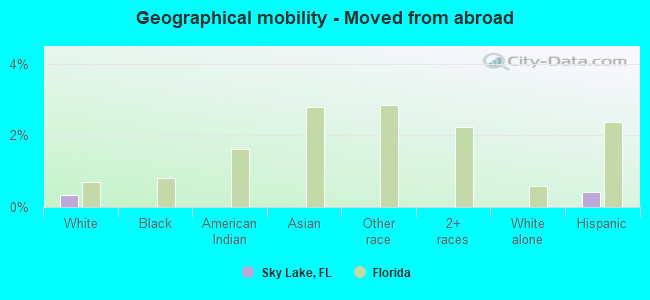
Geographical mobility - Moved from abroad (%)
Geographical mobility - Moved from abroad (%) - White
Geographical mobility - Moved from abroad (%) - Black or African American
Geographical mobility - Moved from abroad (%) - Asian
Geographical mobility - Moved from abroad (%) - Hispanic or Latino
Geographical mobility - Moved from abroad (%) - American Indian and Alaska Native
Geographical mobility - Moved from abroad (%) - Multirace
Geographical mobility - Moved from abroad (%) - Other Race
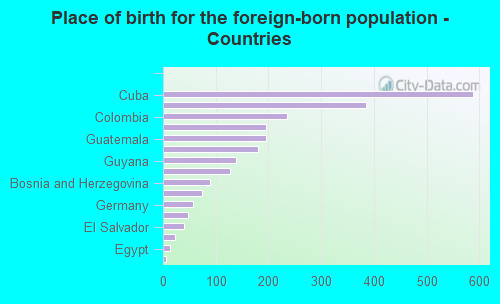
Place of birth for the foreign-born population - Ireland (%)
Place of birth for the foreign-born population - Denmark (%)
Place of birth for the foreign-born population - Norway (%)
Place of birth for the foreign-born population - Sweden (%)
Place of birth for the foreign-born population - United Kingdom (%)
Place of birth for the foreign-born population - England (%)
Place of birth for the foreign-born population - Scotland (%)
Place of birth for the foreign-born population - Other Northern Europe (%)
Place of birth for the foreign-born population - Austria (%)
Place of birth for the foreign-born population - Belgium (%)
Place of birth for the foreign-born population - France (%)
Place of birth for the foreign-born population - Germany (%)
Place of birth for the foreign-born population - Netherlands (%)
Place of birth for the foreign-born population - Switzerland (%)
Place of birth for the foreign-born population - Other Western Europe (%)
Place of birth for the foreign-born population - Greece (%)
Place of birth for the foreign-born population - Italy (%)
Place of birth for the foreign-born population - Portugal (%)
Place of birth for the foreign-born population - Spain (%)
Place of birth for the foreign-born population - Other Southern Europe (%)
Place of birth for the foreign-born population - Albania (%)
Place of birth for the foreign-born population - Belarus (%)
Place of birth for the foreign-born population - Bosnia and Herzegovina (%)
Place of birth for the foreign-born population - Bulgaria (%)
Place of birth for the foreign-born population - Croatia (%)
Place of birth for the foreign-born population - Czechoslovakia (%)
Place of birth for the foreign-born population - Hungary (%)
Place of birth for the foreign-born population - Latvia (%)
Place of birth for the foreign-born population - Lithuania (%)
Place of birth for the foreign-born population - North Macedonia (Macedonia) (%)
Place of birth for the foreign-born population - Moldova (%)
Place of birth for the foreign-born population - Poland (%)
Place of birth for the foreign-born population - Romania (%)
Place of birth for the foreign-born population - Russia (%)
Place of birth for the foreign-born population - Serbia (%)
Place of birth for the foreign-born population - Ukraine (%)
Place of birth for the foreign-born population - Other Eastern Europe (%)
Place of birth for the foreign-born population - China (%)
Place of birth for the foreign-born population - Hong Kong (%)
Place of birth for the foreign-born population - Taiwan (%)
Place of birth for the foreign-born population - Japan (%)
Place of birth for the foreign-born population - Korea (%)
Place of birth for the foreign-born population - Other Eastern Asia (%)
Place of birth for the foreign-born population - Afghanistan (%)
Place of birth for the foreign-born population - Bangladesh (%)
Place of birth for the foreign-born population - India (%)
Place of birth for the foreign-born population - Iran (%)
Place of birth for the foreign-born population - Kazakhstan (%)
Place of birth for the foreign-born population - Nepal (%)
Place of birth for the foreign-born population - Pakistan (%)
Place of birth for the foreign-born population - Sri Lanka (%)
Place of birth for the foreign-born population - Uzbekistan (%)
Place of birth for the foreign-born population - Other South Central Asia (%)
Place of birth for the foreign-born population - Burma (%)
Place of birth for the foreign-born population - Cambodia (%)
Place of birth for the foreign-born population - Indonesia (%)
Place of birth for the foreign-born population - Laos (%)
Place of birth for the foreign-born population - Malaysia (%)
Place of birth for the foreign-born population - Philippines (%)
Place of birth for the foreign-born population - Singapore (%)
Place of birth for the foreign-born population - Thailand (%)
Place of birth for the foreign-born population - Vietnam (%)
Place of birth for the foreign-born population - Other South Eastern Asia (%)
Place of birth for the foreign-born population - Armenia (%)
Place of birth for the foreign-born population - Iraq (%)
Place of birth for the foreign-born population - Israel (%)
Place of birth for the foreign-born population - Jordan (%)
Place of birth for the foreign-born population - Kuwait (%)
Place of birth for the foreign-born population - Lebanon (%)
Place of birth for the foreign-born population - Saudi Arabia (%)
Place of birth for the foreign-born population - Syria (%)
Place of birth for the foreign-born population - Turkey (%)
Place of birth for the foreign-born population - Yemen (%)
Place of birth for the foreign-born population - Other Western Asia (%)
Place of birth for the foreign-born population - Eritrea (%)
Place of birth for the foreign-born population - Ethiopia (%)
Place of birth for the foreign-born population - Kenya (%)
Place of birth for the foreign-born population - Somalia (%)
Place of birth for the foreign-born population - Uganda (%)
Place of birth for the foreign-born population - Zimbabwe (%)
Place of birth for the foreign-born population - Other Eastern Africa (%)
Place of birth for the foreign-born population - Cameroon (%)
Place of birth for the foreign-born population - Congo (%)
Place of birth for the foreign-born population - Democratic Republic of Congo (Zaire) (%)
Place of birth for the foreign-born population - Other Middle Africa (%)
Place of birth for the foreign-born population - Egypt (%)
Place of birth for the foreign-born population - Morocco (%)
Place of birth for the foreign-born population - Sudan (%)
Place of birth for the foreign-born population - Other Northern Africa (%)
Place of birth for the foreign-born population - South Africa (%)
Place of birth for the foreign-born population - Other Southern Africa (%)
Place of birth for the foreign-born population - Cabo Verde (%)
Place of birth for the foreign-born population - Ghana (%)
Place of birth for the foreign-born population - Liberia (%)
Place of birth for the foreign-born population - Nigeria (%)
Place of birth for the foreign-born population - Senegal (%)
Place of birth for the foreign-born population - Sierra Leone (%)
Place of birth for the foreign-born population - Other Western Africa (%)
Place of birth for the foreign-born population - Australia (%)
Place of birth for the foreign-born population - New Zealand (%)
Place of birth for the foreign-born population - Fiji (%)
Place of birth for the foreign-born population - Micronesia (%)
Place of birth for the foreign-born population - Bahamas (%)
Place of birth for the foreign-born population - Barbados (%)
Place of birth for the foreign-born population - Cuba (%)
Place of birth for the foreign-born population - Dominica (%)
Place of birth for the foreign-born population - Dominican Republic (%)
Place of birth for the foreign-born population - Grenada (%)
Place of birth for the foreign-born population - Haiti (%)
Place of birth for the foreign-born population - Jamaica (%)
Place of birth for the foreign-born population - St. Vincent and the Grenadines (%)
Place of birth for the foreign-born population - Trinidad and Tobago (%)
Place of birth for the foreign-born population - West Indies (%)
Place of birth for the foreign-born population - Other Caribbean (%)
Place of birth for the foreign-born population - Belize (%)
Place of birth for the foreign-born population - Costa Rica (%)
Place of birth for the foreign-born population - El Salvador (%)
Place of birth for the foreign-born population - Guatemala (%)
Place of birth for the foreign-born population - Honduras (%)
Place of birth for the foreign-born population - Mexico (%)
Place of birth for the foreign-born population - Nicaragua (%)
Place of birth for the foreign-born population - Panama (%)
Place of birth for the foreign-born population - Other Central America (%)
Place of birth for the foreign-born population - Argentina (%)
Place of birth for the foreign-born population - Bolivia (%)
Place of birth for the foreign-born population - Brazil (%)
Place of birth for the foreign-born population - Chile (%)
Place of birth for the foreign-born population - Colombia (%)
Place of birth for the foreign-born population - Ecuador (%)
Place of birth for the foreign-born population - Guyana (%)
Place of birth for the foreign-born population - Peru (%)
Place of birth for the foreign-born population - Uruguay (%)
Place of birth for the foreign-born population - Venezuela (%)
Place of birth for the foreign-born population - Other South America (%)
Place of birth for the foreign-born population - Canada (%)
Place of birth for the foreign-born population - Other Northern America (%)
Place of birth for the foreign-born population - Other (%)
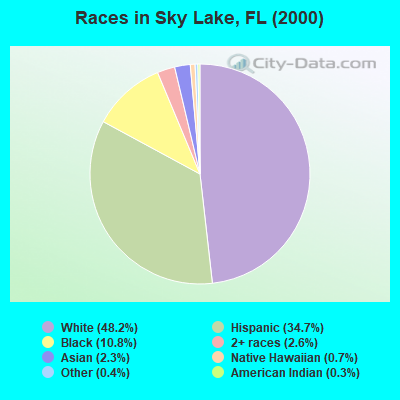
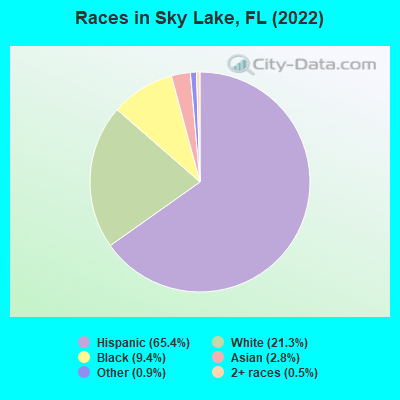
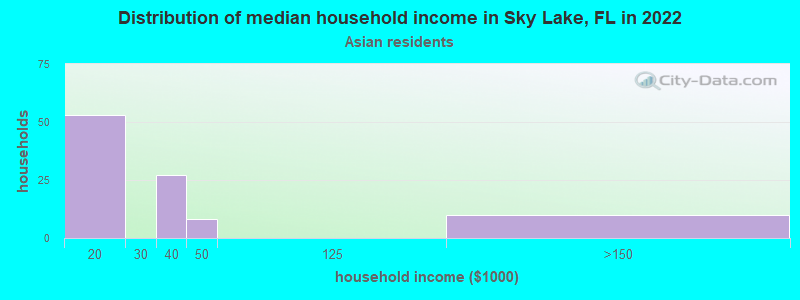
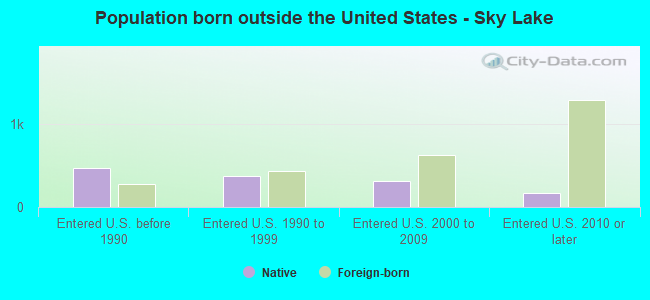
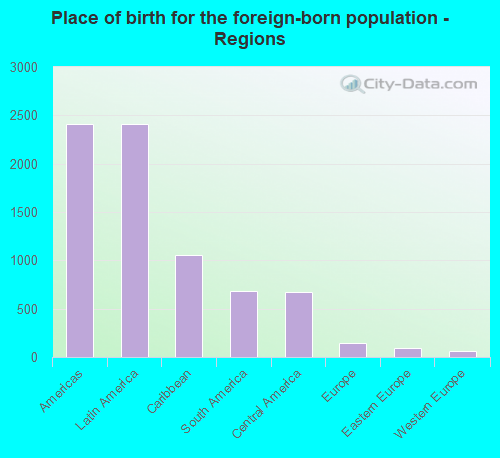
According to 2022 data, the most numerous races in Sky Lake, FL are White alone (1,608 residents), Hispanic (4,940 residents), and Black alone (711 residents). 35.8% of Sky Lake residents speak English at home. 34.2% of Sky Lake, FL residents are foreign-born (30.9% born in Latin America), which is 38.5% greater than the foreign-born rate of 21.0% across the entire state of Florida.
Race distribution in Sky Lake
2000 2022
10,458,509 65.4% White alone 2,682,715 16.8% Hispanic 2,264,268 14.2% Black alone 261,693 1.6% Asian alone 236,954 1.5% Two or more races 42,358 0.3% American Indian alone 28,994 0.2% Other race alone 6,887 0.04% Native Hawaiian and Other
11,309,403 50.8% White alone 6,025,039 27.1% Hispanic 3,241,015 14.6% Black alone 861,630 3.9% Two or more races 623,692 2.8% Asian alone 152,054 0.7% Other race alone 22,504 0.1% American Indian alone 9,486 0.04% Native Hawaiian and Other
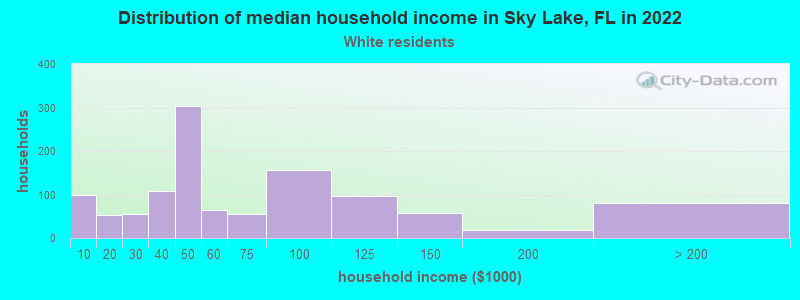
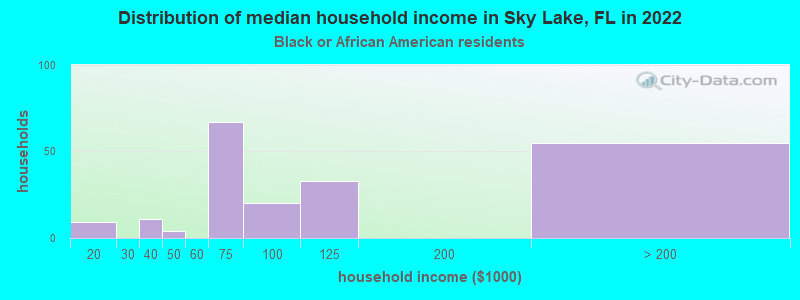
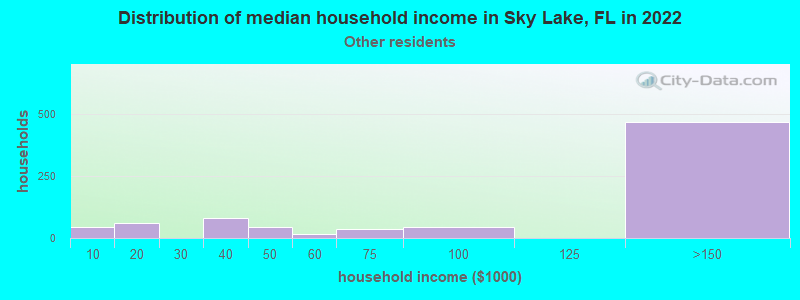
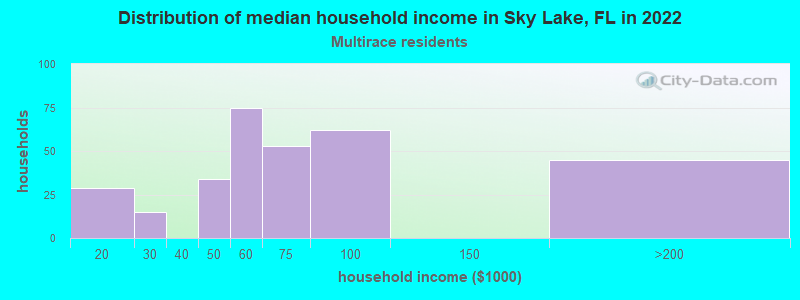
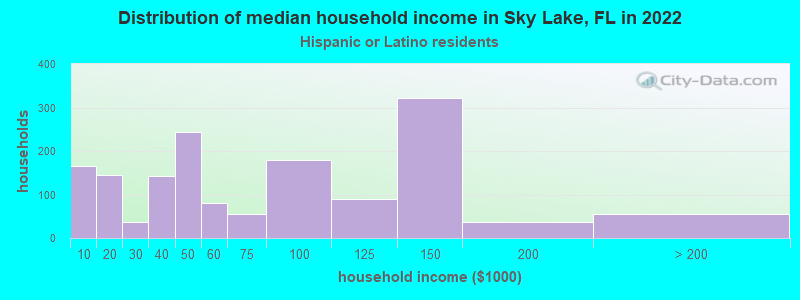
Income and house value in Sky Lake Median household income in 2022 $57,444 White non-Hispanic householders$85,310 Black householders$63,038 Two or more races householders$57,119 Hispanic or Latino race householdersMedian 2022 house value $259,622 White Non-Hispanic householders$254,936 Black or African American householders $296,800 Asian householders$243,064 Some other race householders$231,817 Two or more races householders$248,063 Hispanic or Latino householders
Median age by race in Sky Lake
41.9 Median age for White residents39.9 43.2 32.4 Median age for Black or African American residents32.3 57.7 -614,300,100.1 Median age for American Indian / Alaska Native residents-735,632,183.2 -529,680,364.8 76.6 Median age for Asian residents73.5 76.9 -679,790,025.6 Median age for Native Hawaiian / Pacific Islander residents-1,327,635,326.3 -611,111,110.5 57.0 Median age for Other race residents49.6 57.0 43.8 Median age for Two or more races residents22.8 55.6 59.2 Median age for White alone residents61.8 59.1 41.5 Median age for Hispanic or Latino residents34.6 46.7
Owner/renter occupied households by race in Sky Lake
House owners and renters - White residents 701 59.8% Owner occupied471 40.2% Renter occupiedHouse owners and renters - Black or African American residents 100 59.6% Owner occupied68 40.4% Renter occupiedHouse owners and renters - American Indian / Alaska Native residents 25 100.0% Renter occupiedHouse owners and renters - Asian residents 124 100.0% Owner occupiedHouse owners and renters - Other race residents 613 81.5% Owner occupied139 18.5% Renter occupiedHouse owners and renters - Two or more races residents 155 50.6% Owner occupied152 49.4% Renter occupiedHouse owners and renters - White alone residents 464 76.8% Owner occupied140 23.2% Renter occupiedHouse owners and renters - Hispanic or Latino residents 933 57.6% Owner occupied687 42.4% Renter occupied
Language usage in Sky Lake
English speakers - Total 35.8% of residents of Sky Lake speak English at home.
60.7% of residents speak Spanish at home 2,816 63.8% Speak English very well1,601 36.2% Speak English less than very well2.1% of residents speak other language at home 72 46.5% Speak English very well83 53.5% Speak English less than very well
English speakers - Born in the United States 68.8% of residents of Sky Lake speak English at home.
31.8% of residents speak Spanish at home 551 91.7% Speak English very well50 8.3% Speak English less than very well
English speakers - Native, born elsewhere 7.5% of residents of Sky Lake speak English at home.
95.7% of residents speak Spanish at home 959 79.9% Speak English very well241 20.1% Speak English less than very well
English speakers - Foreign-born 12.0% of residents of Sky Lake speak English at home.
82.2% of residents speak Spanish at home 834 39.0% Speak English very well1,303 61.0% Speak English less than very well5.3% of residents speak other language at home 55 39.6% Speak English very well84 60.4% Speak English less than very well
White (Caucasian) - Speak only English Native:
66.2% (1,536)Foreign-born:
10.0% (75)
White (Caucasian) - Speak another language Native:
21.8% (507)Foreign-born:
88.1% (662)
Black or African American - Speak only English Native:
67.5% (303)Foreign-born:
14.5% (40)
Black or African American - Speak another language Native:
35.6% (159)Foreign-born:
81.1% (225)
Asian - Speak only English Native:
100.0% (22)Foreign-born:
91.8% (175)
Other race - Speak another language Native:
76.2% (982)Foreign-born:
100.0% (404)
Two or more races - Speak another language Native:
79.8% (690)Foreign-born:
100.0% (661)
White alone - Speak only English Native:
95.6% (1,395)Foreign-born:
12.6% (13)
White alone - Speak another language Native:
4.4% (64)Foreign-born:
90.8% (90)
Hispanic or Latino - Speak only English Native:
20.4% (561)Foreign-born:
4.1% (84)
Hispanic or Latino - Speak another language Native:
76.7% (2,112)Foreign-born:
96.0% (1,958)
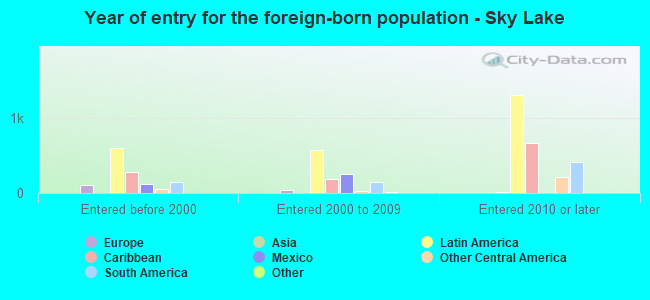
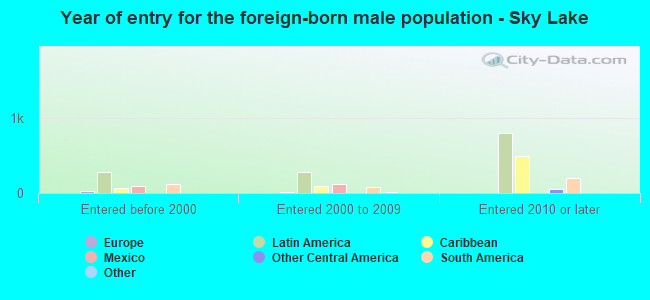
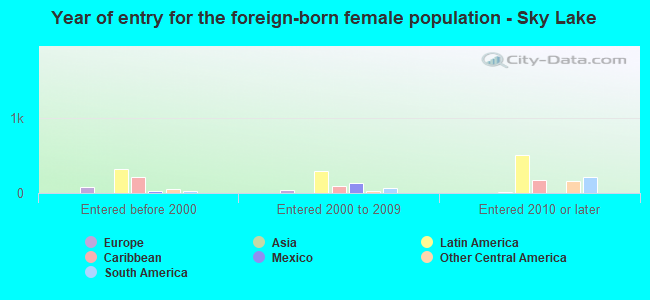
Foreign-born residents in Sky Lake 2,581 residents are foreign born (30.9% Latin America ).
This city:
34.2%Florida:
21.1%
Marital status for residents in Sky Lake Marital status - White (Caucasian) population 15 years and over
Males 40.2% Never married39.2% Now married0.4% Separated3.0% Widowed17.2% DivorcedFemales 29.1% Never married29.6% Now married6.3% Separated11.5% Widowed23.5% DivorcedWomen who gave birth in the past 12 months Now married:
100.0% (19)Unmarried:
0.0% (0)
Women who did not give birth in the past 12 months Now married:
39.0% (318)Unmarried:
61.0% (497)
Marital status - Black or African American population 15 years and over
Males 26.6% Never married30.4% Now married2.4% Separated0.0% Widowed40.6% DivorcedFemales 32.1% Never married22.3% Now married4.1% Separated21.2% Widowed20.2% DivorcedWomen who did not give birth in the past 12 months Now married:
11.4% (8)Unmarried:
88.6% (62)
Marital status - Asian population 15 years and over
Males 24.8% Never married75.2% Now married0.0% Separated0.0% Widowed0.0% DivorcedFemales 0.0% Never married86.6% Now married0.0% Separated0.0% Widowed13.4% DivorcedWomen who did not give birth in the past 12 months Now married:
100.0% (17)Unmarried:
0.0% (0)
Marital status - Other race population 15 years and over
Males 27.8% Never married66.2% Now married0.0% Separated0.0% Widowed6.1% DivorcedFemales 29.3% Never married60.6% Now married2.1% Separated3.9% Widowed4.1% DivorcedWomen who did not give birth in the past 12 months Now married:
38.1% (115)Unmarried:
61.9% (186)
Marital status - Two or more races population 15 years and over
Males 79.3% Never married14.6% Now married0.0% Separated0.0% Widowed6.1% DivorcedFemales 43.9% Never married24.1% Now married0.0% Separated5.0% Widowed27.0% DivorcedWomen who did not give birth in the past 12 months Now married:
33.9% (80)Unmarried:
66.1% (156)
Marital status - White alone, not Hispanic / Latino population 15 years and over
Males 20.9% Never married29.2% Now married1.0% Separated4.8% Widowed44.2% DivorcedFemales 24.7% Never married33.3% Now married0.0% Separated7.9% Widowed34.1% DivorcedWomen who did not give birth in the past 12 months Now married:
41.9% (110)Unmarried:
58.1% (152)
Marital status - Hispanic or Latino population 15 years and over
Males 52.4% Never married44.0% Now married0.0% Separated0.9% Widowed2.6% DivorcedFemales 32.6% Never married36.4% Now married6.6% Separated9.6% Widowed14.8% DivorcedWomen who gave birth in the past 12 months Now married:
100.0% (24)Unmarried:
0.0% (0)
Women who did not give birth in the past 12 months Now married:
37.4% (424)Unmarried:
62.6% (711)
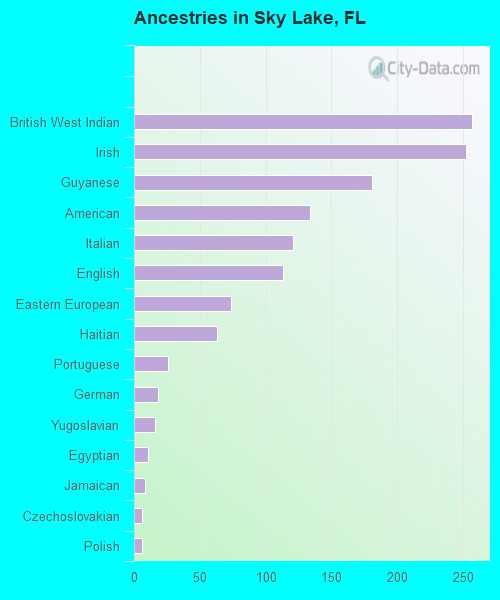
Ancestries in Sky Lake
257 5.1% British West Indian252 5.0% Irish181 3.6% Guyanese134 2.6% American121 2.4% Italian113 2.2% English74 1.5% Eastern European63 1.2% Haitian26 0.5% Portuguese18 0.4% German16 0.3% Yugoslavian11 0.2% Egyptian8 0.2% Jamaican6 0.1% Czechoslovakian6 0.1% Polish
Children Nativity (place of birth) in Sky Lake
Children under 6 years - Living with two parents Both parents native 11 100.0% NativeBoth parents foreign-born 105 100.0% NativeChildren under 6 years - Living with one parent Native parent 90 99.4% Native1 0.6% Foreign-bornForeign-born parent 39 70.3% Native16 29.7% Foreign-bornChildren 6 to 17 years - Living with two parents Both parents native 183 100.0% NativeBoth parents foreign-born 38 100.0% NativeChildren 6 to 17 years - Living with one parent Native parent 73 100.0% NativeForeign-born parent 336 66.6% Native168 33.4% Foreign-born
Grandparents responsible for own grandchildren in Sky Lake
Grandparents (30 to 59 years) White / Caucasian 10 19.7% Responsible for grandchildren39 80.3% Not responsible for grandchildrenWhite alone, not Hispanic / Latino 18 100.0% Not responsible for grandchildrenHispanic or Latino 18 25.9% Responsible for grandchildren52 74.1% Not responsible for grandchildren
Grandparents (60 years and over) White / Caucasian 58 100.0% Not responsible for grandchildrenWhite alone, not Hispanic / Latino 65 100.0% Not responsible for grandchildrenHispanic or Latino 412 100.0% Not responsible for grandchildren