Races in Sloatsburg, New York (NY) Detailed Stats
Ancestries, Foreign-born residents, place of birth
Settings
X


Recent posts about races in Sloatsburg, New York on our local forum with over 2,400,000 registered users:
 | Upper Middle class african-american communities in ny (2058 replies) |
| Property taxes: These places pay the most in New York (100 replies) |
| Left or planning to leave? (172 replies) |
| Yea that’s it, it must be the weather..... (10 replies) |
| Buffalo NY Mass exodus (31 replies) |
| Orange County to Midtown NYC Commute (3 replies) |
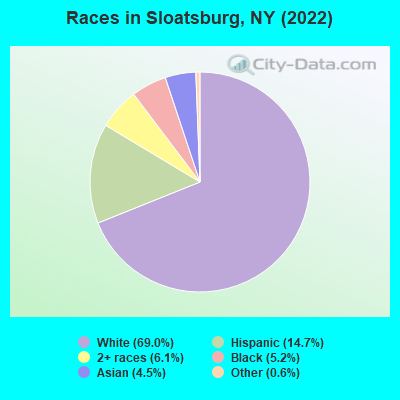
According to 2022 data, the most numerous races in Sloatsburg, NY are White alone (2,108 residents), Hispanic (448 residents), and Black alone (159 residents). 75.6% of Sloatsburg residents speak English at home. 22.2% of Sloatsburg, NY residents are foreign-born (10.5% born in Europe, 9.4% born in Latin America, 2.4% born in Asia), which is about the same as the foreign-born rate of 22.0% across the entire state of New York.
Race distribution in Sloatsburg
2000
2022

- 2,71987.2%White alone
- 1745.6%Hispanic
- 933.0%Black alone
- 772.5%Asian alone
- 371.2%Two or more races
- 120.4%American Indian alone
- 30.10%Native Hawaiian and Other
Pacific Islander alone - 20.06%Other race alone

-
- 2,10869.0%White alone
- 44814.7%Hispanic
- 1856.1%Two or more races
- 1595.2%Black alone
- 1374.5%Asian alone
- 180.6%Other race alone
2000
2022
-
- 11,760,98162.0%White alone
- 2,867,58315.1%Hispanic
- 2,812,62314.8%Black alone
- 1,035,9265.5%Asian alone
- 366,1161.9%Two or more races
- 75,4990.4%Other race alone
- 52,4990.3%American Indian alone
- 5,2300.03%Native Hawaiian and Other
Pacific Islander alone

-
- 10,408,93352.9%White alone
- 3,867,29919.7%Hispanic
- 2,633,84013.4%Black alone
- 1,776,2869.0%Asian alone
- 732,6703.7%Two or more races
- 216,1101.1%Other race alone
- 35,0820.2%American Indian alone
- 6,9310.04%Native Hawaiian and Other
Pacific Islander alone

Income and house value in Sloatsburg
- Median household income in 2022
- $101,908White non-Hispanic householders
- $89,437Asian householders
- $164,382Two or more races householders
- $107,637Hispanic or Latino race householders
- Median 2022 house value
- $414,610White Non-Hispanic householders
- $800,405Black or African American householders
- $74,323Asian householders
- $371,616Some other race householders
- $371,616Two or more races householders
- $428,788Hispanic or Latino householders
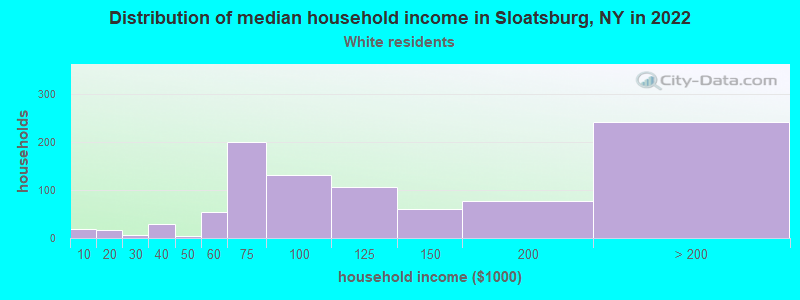
Household income for White non-Hispanic householders
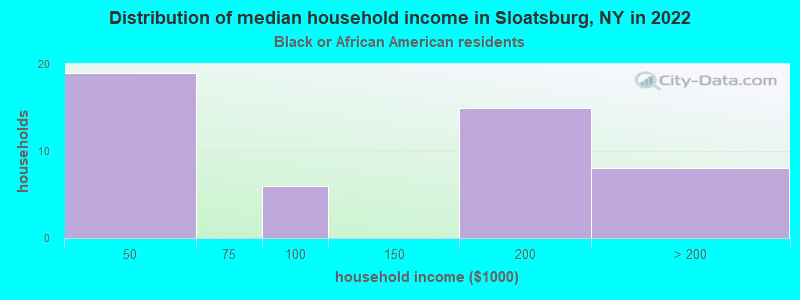
Household income for Black householders
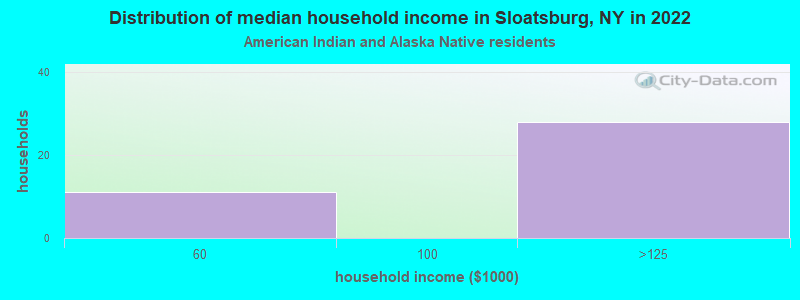
Household income for American Indian and Alaska Native householders
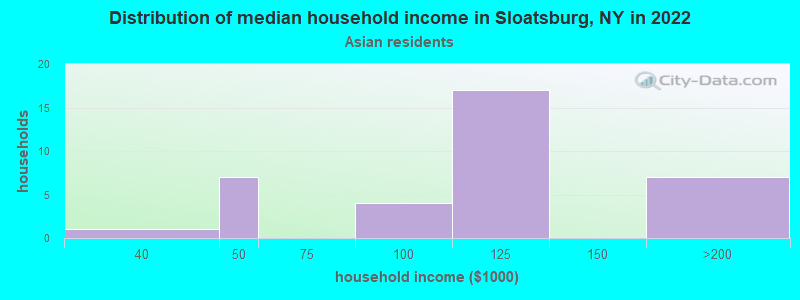
Household income for Asian householders
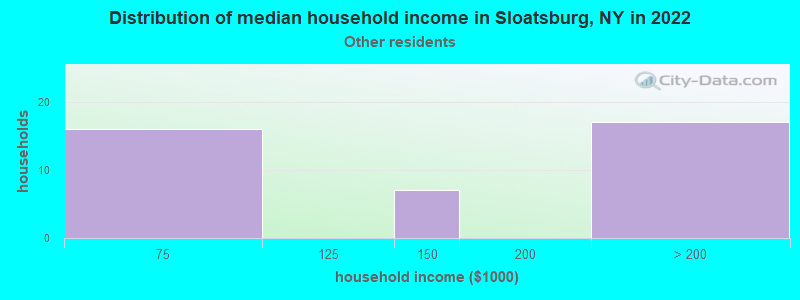
Household income for Some other race householders
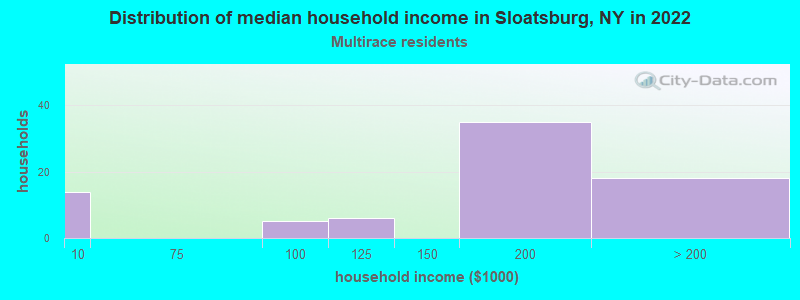
Household income for Two or more races householders
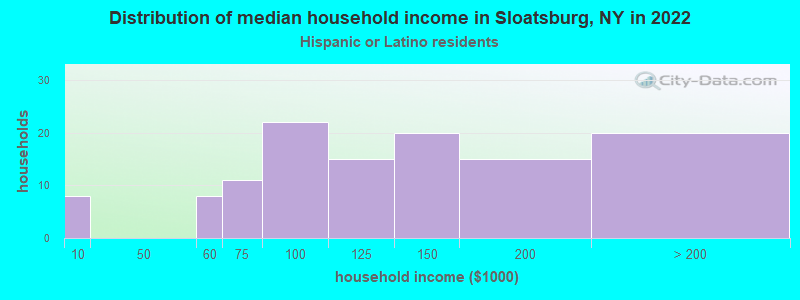
Household income for Hispanic or Latino race householders
Median age by race in Sloatsburg
- 51.7Median age for White residents
- 52.5Males
- 51.4Females
- 32.7Median age for Black or African American residents
- 37.2Males
- 18.5Females
- 3.9Median age for American Indian / Alaska Native residents
- 16.0Males
- -644,444,443.8Females
- 38.1Median age for Asian residents
- 35.3Males
- 41.9Females
- -463,937,621.4Median age for Native Hawaiian / Pacific Islander residents
- -649,572,648.9Males
- -666,666,666.0Females
- 22.1Median age for Other race residents
- 22.5Males
- 22.8Females
- 18.0Median age for Two or more races residents
- 11.5Males
- 39.3Females
- 51.1Median age for White alone residents
- 52.1Males
- 50.4Females
- 22.3Median age for Hispanic or Latino residents
- 19.3Males
- 25.4Females
Owner/renter occupied households by race in Sloatsburg
- House owners and renters - White residents
- 86591.3%Owner occupied
- 838.7%Renter occupied
- House owners and renters - Black or African American residents
- 3065.8%Owner occupied
- 1634.2%Renter occupied
- House owners and renters - American Indian / Alaska Native residents
- 3877.8%Owner occupied
- 1122.2%Renter occupied
- House owners and renters - Asian residents
- 2072.7%Owner occupied
- 727.3%Renter occupied
- House owners and renters - Other race residents
- 33100.0%Owner occupied
- House owners and renters - Two or more races residents
- 72100.0%Owner occupied
- House owners and renters - White alone residents
- 86291.4%Owner occupied
- 818.6%Renter occupied
- House owners and renters - Hispanic or Latino residents
- 10992.0%Owner occupied
- 98.0%Renter occupied
Language usage in Sloatsburg
- English speakers - Total
- 75.6% of residents of Sloatsburg speak English at home.
- 8.7% of residents speak Spanish at home
- 15863.7%Speak English very well
- 9036.3%Speak English less than very well
- 15.6% of residents speak other language at home
- 34177.0%Speak English very well
- 10223.0%Speak English less than very well
All residents speak only English at home
- English speakers - Native, born elsewhere
- 48.4% of residents of Sloatsburg speak English at home.
- 19.4% of residents speak Spanish at home
- 12100.0%Speak English less than very well
- 30.6% of residents speak other language at home
- 19100.0%Speak English very well
- English speakers - Foreign-born
- 15.9% of residents of Sloatsburg speak English at home.
- 22.4% of residents speak Spanish at home
- 6347.0%Speak English very well
- 7153.0%Speak English less than very well
- 59.5% of residents speak other language at home
- 26574.4%Speak English very well
- 9125.6%Speak English less than very well
White (Caucasian) - Speak only English
| Native: | 96.6% (1,705) |
| Foreign-born: | 27.4% (72) |
White (Caucasian) - Speak another language
| Native: | 5.3% (93) |
| Foreign-born: | 70.9% (187) |
Black or African American - Speak another language
| Native: | 19.7% (18) |
| Foreign-born: | 100.0% (47) |
Asian - Speak only English
| Native: | 100.0% (57) |
| Foreign-born: | 26.9% (20) |
Other race - Speak another language
| Native: | 60.3% (56) |
| Foreign-born: | 100.0% (13) |
Two or more races - Speak only English
| Native: | 73.0% (174) |
| Foreign-born: | 7.1% (8) |
Two or more races - Speak another language
| Native: | 29.0% (69) |
| Foreign-born: | 91.0% (102) |
White alone - Speak only English
| Native: | 95.9% (1,675) |
| Foreign-born: | 25.3% (72) |
White alone - Speak another language
| Native: | 3.9% (69) |
| Foreign-born: | 74.0% (211) |
Hispanic or Latino - Speak only English
| Native: | 37.2% (74) |
| Foreign-born: | 3.7% (5) |
Hispanic or Latino - Speak another language
| Native: | 57.3% (114) |
| Foreign-born: | 96.2% (143) |
Foreign-born residents in Sloatsburg
677 residents are foreign born (10.5% Europe, 9.4% Latin America, 2.4% Asia).
| This city: | 22.2% |
| New York: | 22.6% |


Marital status for residents in Sloatsburg
Marital status - White (Caucasian) population 15 years and over
- Males
- 30.6%Never married
- 49.7%Now married
- 0.9%Separated
- 2.3%Widowed
- 16.6%Divorced
- Females
- 20.6%Never married
- 50.0%Now married
- 0.8%Separated
- 13.3%Widowed
- 15.3%Divorced
Women who did not give birth in the past 12 months
| Now married: | 38.8% (136) |
| Unmarried: | 61.2% (214) |
Marital status - Black or African American population 15 years and over
- Males
- 25.9%Never married
- 74.1%Now married
- 0.0%Separated
- 0.0%Widowed
- 0.0%Divorced
- Females
- 53.1%Never married
- 28.6%Now married
- 0.0%Separated
- 18.4%Widowed
- 0.0%Divorced
Women who did not give birth in the past 12 months
| Now married: | 25.3% (17) |
| Unmarried: | 74.7% (49) |
Marital status - Asian population 15 years and over
- Males
- 69.1%Never married
- 30.9%Now married
- 0.0%Separated
- 0.0%Widowed
- 0.0%Divorced
- Females
- 48.6%Never married
- 51.4%Now married
- 0.0%Separated
- 0.0%Widowed
- 0.0%Divorced
Women who did not give birth in the past 12 months
| Now married: | 51.4% (18) |
| Unmarried: | 48.6% (17) |
Marital status - Other race population 15 years and over
- Males
- 34.5%Never married
- 65.5%Now married
- 0.0%Separated
- 0.0%Widowed
- 0.0%Divorced
- Females
- 74.2%Never married
- 25.8%Now married
- 0.0%Separated
- 0.0%Widowed
- 0.0%Divorced
Women who did not give birth in the past 12 months
| Now married: | 32.7% (16) |
| Unmarried: | 67.3% (34) |
Marital status - Two or more races population 15 years and over
- Males
- 83.1%Never married
- 16.9%Now married
- 0.0%Separated
- 0.0%Widowed
- 0.0%Divorced
- Females
- 33.7%Never married
- 63.0%Now married
- 0.0%Separated
- 0.0%Widowed
- 3.3%Divorced
Women who gave birth in the past 12 months
| Now married: | 100.0% (15) |
| Unmarried: | 0.0% (0) |
Women who did not give birth in the past 12 months
| Now married: | 52.3% (51) |
| Unmarried: | 47.7% (46) |
Marital status - White alone, not Hispanic / Latino population 15 years and over
- Males
- 30.0%Never married
- 49.8%Now married
- 0.9%Separated
- 2.4%Widowed
- 17.0%Divorced
- Females
- 20.8%Never married
- 49.2%Now married
- 0.8%Separated
- 13.0%Widowed
- 16.1%Divorced
Women who did not give birth in the past 12 months
| Now married: | 39.2% (138) |
| Unmarried: | 60.8% (214) |
Marital status - Hispanic or Latino population 15 years and over
- Males
- 49.2%Never married
- 50.8%Now married
- 0.0%Separated
- 0.0%Widowed
- 0.0%Divorced
- Females
- 42.1%Never married
- 50.6%Now married
- 0.0%Separated
- 5.5%Widowed
- 1.8%Divorced
Women who gave birth in the past 12 months
| Now married: | 100.0% (10) |
| Unmarried: | 0.0% (0) |
Women who did not give birth in the past 12 months
| Now married: | 38.5% (36) |
| Unmarried: | 61.5% (58) |
Ancestries in Sloatsburg

- 31522.7%Irish
- 21415.4%Polish
- 936.7%Italian
- 836.0%American
- 745.3%Russian
- 433.1%German
- 413.0%English
- 352.5%Brazilian
- 171.2%Hungarian
- 151.1%Haitian
- 80.6%Danish
- 60.4%Lebanese
- 60.4%Syrian
- 60.4%Austrian
- 60.4%European
- 60.4%Ukrainian
- 50.4%French Canadian
- 50.4%Portuguese
- 50.4%Welsh
- 40.3%Canadian
- 30.2%Slovak

Geographical mobility in Sloatsburg

- Same house 1 year ago
- 2,03696.5%White (Caucasian)
- 15497.7%Black or African American
- 104100.0%American Indian / Alaska Native
- 13399.1%Asian
- 160100.0%Other race
- 33692.0%Two or more races
- 2,03797.0%White alone, not Hispanic / Latino
- 416100.0%Hispanic or Latino

-
- Moved within same county
- 482.3%White / Caucasian
- 205.5%Two or more races
- 331.6%White alone, not Hispanic / Latino
- 164.0%Hispanic or Latino

-
- Moved within same state
- 70.4%White / Caucasian
- 70.3%White alone, not Hispanic / Latino

-
- Moved from different state
- 180.9%White / Caucasian
- 201.0%White alone, not Hispanic / Latino

-
- Moved from abroad
- 92.5%Two or more races
- 81.9%Hispanic or Latino

Children Nativity (place of birth) in Sloatsburg
Place of birth for residents in Sloatsburg
![Place of birth for the foreign-born population - Regions]()
- 315Europe
- 288Americas
- 282Latin America
- 242Eastern Europe
- 205South America
- 73Asia
- 67Caribbean
- 46Northern Europe
- 44South Eastern Asia
- 20South Central Asia
- 18Southern Europe
- 9Central America
- 7Western Europe
- 7Eastern Asia
- 7China
- 5Northern America

![Place of birth for the foreign-born population - Countries]()
- 157Poland
- 142Ecuador
- 61Russia
- 50Haiti
- 36Philippines
- 36Colombia
- 34Ireland
- 26Brazil
- 19India
- 16Dominican Republic
- 11England
- 9Italy
- 7Austria
- 7Belarus
- 7China
- 7Malaysia
- 6Mexico
- 5Portugal
- 5Ukraine
- 5Canada
- 2Spain
- 2Guatemala

Grandparents responsible for own grandchildren in Sloatsburg
Zip codes: 10974.