Races in Smithtown, New York (NY) Detailed Stats
Data:
Races - White alone (%)
Races - White alone (% change since 2000)
Races - Black alone (%)
Races - Black alone (% change since 2000)
Races - American Indian alone (%)
Races - American Indian alone (% change since 2000)
Races - Asian alone (%)
Races - Asian alone (% change since 2000)
Races - Hispanic (%)
Races - Hispanic (% change since 2000)
Races - Native Hawaiian and Other Pacific Islander alone (%)
Races - Native Hawaiian and Other Pacific Islander alone (% change since 2000)
Races - Two or more races(%)
Races - Two or more races(% change since 2000)
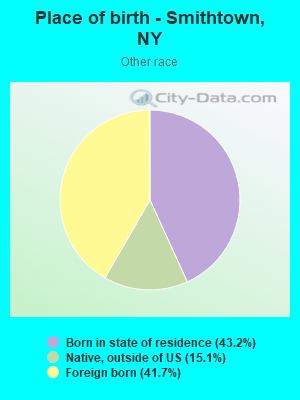
Races - Other race alone (%)
Races - Other race alone (% change since 2000)
Racial diversity
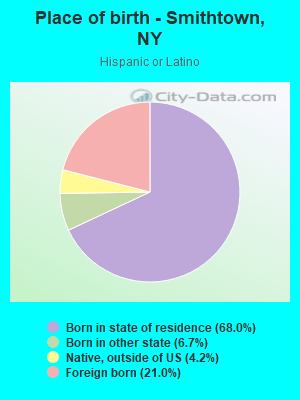
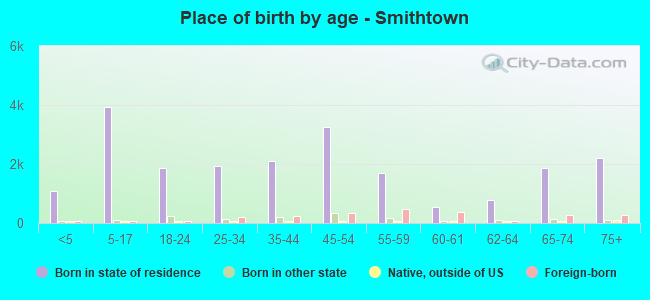
Place of birth - Born in state of residence (%)
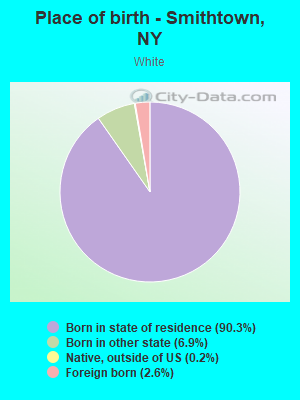
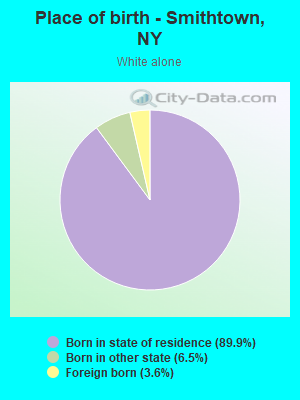
Place of birth - Born in state of residence (%) - White
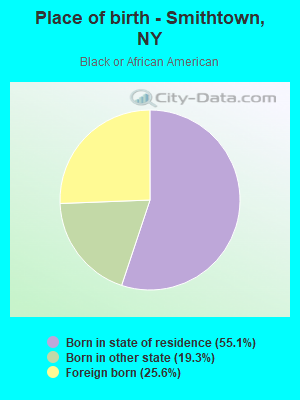
Place of birth - Born in state of residence (%) - Black or African American
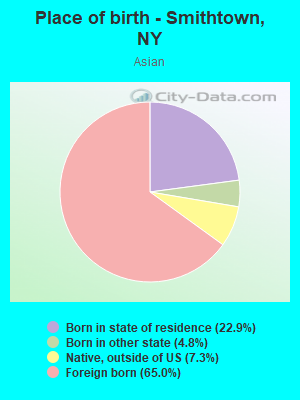
Place of birth - Born in state of residence (%) - Asian
Place of birth - Born in state of residence (%) - Hispanic or Latino
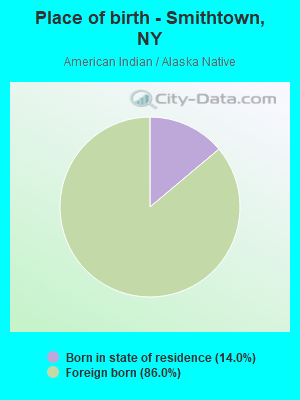
Place of birth - Born in state of residence (%) - American Indian and Alaska Native
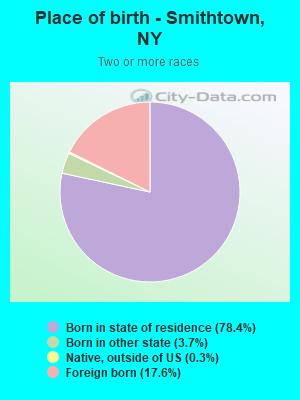
Place of birth - Born in state of residence (%) - Multirace
Place of birth - Born in state of residence (%) - Other Race
Place of birth - Born in other state (%)
Place of birth - Born in other state (%) - White
Place of birth - Born in other state (%) - Black or African American
Place of birth - Born in other state (%) - Asian
Place of birth - Born in other state (%) - Hispanic or Latino
Place of birth - Born in other state (%) - American Indian and Alaska Native
Place of birth - Born in other state (%) - Multirace
Place of birth - Born in other state (%) - Other Race
Place of birth - Native, outside of US (%)
Place of birth - Native, outside of US (%) - White
Place of birth - Native, outside of US (%) - Black or African American
Place of birth - Native, outside of US (%) - Asian
Place of birth - Native, outside of US (%) - Hispanic or Latino
Place of birth - Native, outside of US (%) - American Indian and Alaska Native
Place of birth - Native, outside of US (%) - Multirace
Place of birth - Native, outside of US (%) - Other Race
Place of birth - Foreign born (%)
Place of birth - Foreign born (%) - White
Place of birth - Foreign born (%) - Black or African American
Place of birth - Foreign born (%) - Asian
Place of birth - Foreign born (%) - Hispanic or Latino
Place of birth - Foreign born (%) - American Indian and Alaska Native
Place of birth - Foreign born (%) - Multirace
Place of birth - Foreign born (%) - Other Race
Residents speaking English at home (%)
Residents speaking English at home - Born in the United States (%)
Residents speaking English at home - Native, born elsewhere (%)
Residents speaking English at home - Foreign born (%)
Residents speaking Spanish at home (%)
Residents speaking Spanish at home - Born in the United States (%)
Residents speaking Spanish at home - Native, born elsewhere (%)
Residents speaking Spanish at home - Foreign born (%)
Residents speaking other language at home (%)
Residents speaking other language at home - Born in the United States (%)
Residents speaking other language at home - Native, born elsewhere (%)
Residents speaking other language at home - Foreign born (%)
Marital status - Never married (%)
Marital status - Now married (%)
Marital status - Separated (%)
Marital status - Widowed (%)
Marital status - Divorced (%)
Ancestries Reported - Arab (%)
Ancestries Reported - Czech (%)
Ancestries Reported - Danish (%)
Ancestries Reported - Dutch (%)
Ancestries Reported - English (%)
Ancestries Reported - French (%)
Ancestries Reported - French Canadian (%)
Ancestries Reported - German (%)
Ancestries Reported - Greek (%)
Ancestries Reported - Hungarian (%)
Ancestries Reported - Irish (%)
Ancestries Reported - Italian (%)
Ancestries Reported - Lithuanian (%)
Ancestries Reported - Norwegian (%)
Ancestries Reported - Polish (%)
Ancestries Reported - Portuguese (%)
Ancestries Reported - Russian (%)
Ancestries Reported - Scotch-Irish (%)
Ancestries Reported - Scottish (%)
Ancestries Reported - Slovak (%)
Ancestries Reported - Subsaharan African (%)
Ancestries Reported - Swedish (%)
Ancestries Reported - Swiss (%)
Ancestries Reported - Ukrainian (%)
Ancestries Reported - United States (%)
Ancestries Reported - Welsh (%)
Ancestries Reported - West Indian (%)
Ancestries Reported - Other (%)
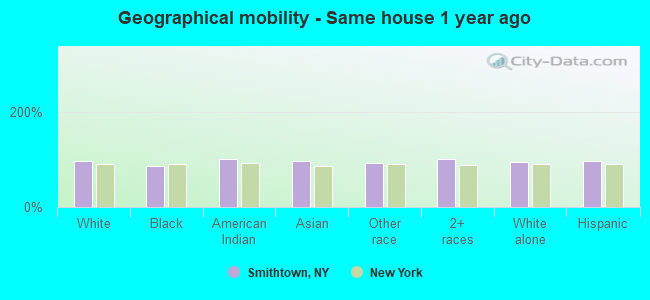
Geographical mobility - Same house 1 year ago (%)
Geographical mobility - Same house 1 year ago (%) - White
Geographical mobility - Same house 1 year ago (%) - Black or African American
Geographical mobility - Same house 1 year ago (%) - Asian
Geographical mobility - Same house 1 year ago (%) - Hispanic or Latino
Geographical mobility - Same house 1 year ago (%) - American Indian and Alaska Native
Geographical mobility - Same house 1 year ago (%) - Multirace
Geographical mobility - Same house 1 year ago (%) - Other Race
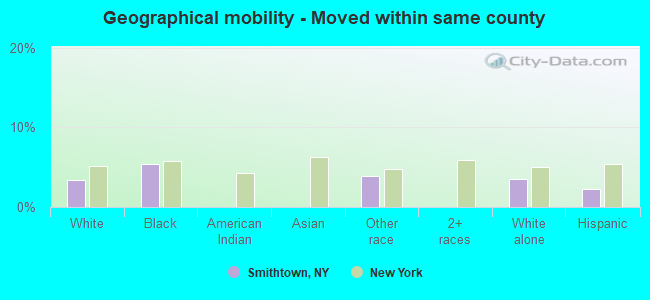
Geographical mobility - Moved within same county (%)
Geographical mobility - Moved within same county (%) - White
Geographical mobility - Moved within same county (%) - Black or African American
Geographical mobility - Moved within same county (%) - Asian
Geographical mobility - Moved within same county (%) - Hispanic or Latino
Geographical mobility - Moved within same county (%) - American Indian and Alaska Native
Geographical mobility - Moved within same county (%) - Multirace
Geographical mobility - Moved within same county (%) - Other Race
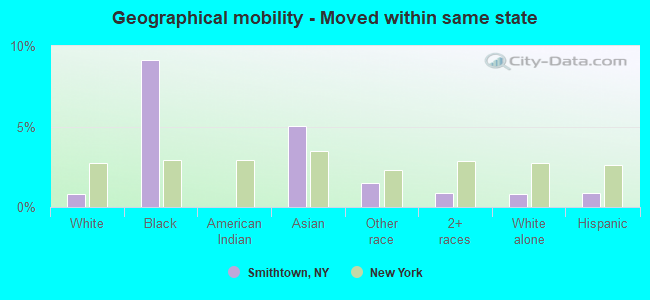
Geographical mobility - Moved from different county within same state (%)
Geographical mobility - Moved from different county within same state (%) - White
Geographical mobility - Moved from different county within same state (%) - Black or African American
Geographical mobility - Moved from different county within same state (%) - Asian
Geographical mobility - Moved from different county within same state (%) - Hispanic or Latino
Geographical mobility - Moved from different county within same state (%) - American Indian and Alaska Native
Geographical mobility - Moved from different county within same state (%) - Multirace
Geographical mobility - Moved from different county within same state (%) - Other Race
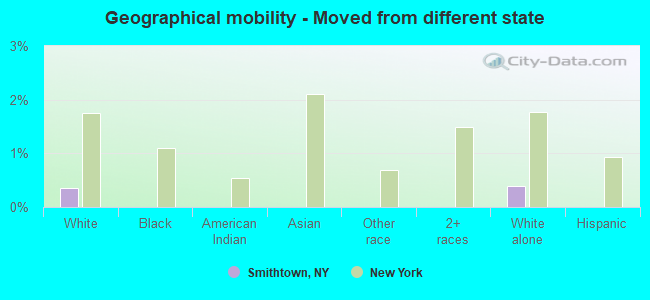
Geographical mobility - Moved from different state (%)
Geographical mobility - Moved from different state (%) - White
Geographical mobility - Moved from different state (%) - Black or African American
Geographical mobility - Moved from different state (%) - Asian
Geographical mobility - Moved from different state (%) - Hispanic or Latino
Geographical mobility - Moved from different state (%) - American Indian and Alaska Native
Geographical mobility - Moved from different state (%) - Multirace
Geographical mobility - Moved from different state (%) - Other Race
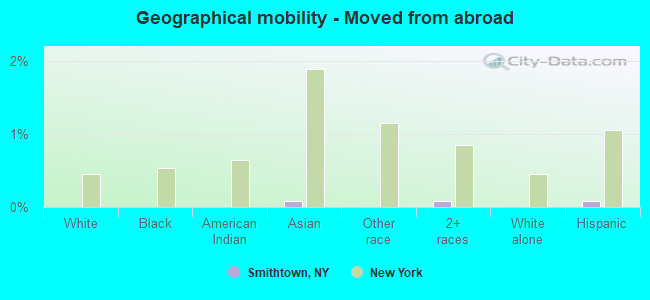
Geographical mobility - Moved from abroad (%)
Geographical mobility - Moved from abroad (%) - White
Geographical mobility - Moved from abroad (%) - Black or African American
Geographical mobility - Moved from abroad (%) - Asian
Geographical mobility - Moved from abroad (%) - Hispanic or Latino
Geographical mobility - Moved from abroad (%) - American Indian and Alaska Native
Geographical mobility - Moved from abroad (%) - Multirace
Geographical mobility - Moved from abroad (%) - Other Race
Place of birth for the foreign-born population - Ireland (%)
Place of birth for the foreign-born population - Denmark (%)
Place of birth for the foreign-born population - Norway (%)
Place of birth for the foreign-born population - Sweden (%)
Place of birth for the foreign-born population - United Kingdom (%)
Place of birth for the foreign-born population - England (%)
Place of birth for the foreign-born population - Scotland (%)
Place of birth for the foreign-born population - Other Northern Europe (%)
Place of birth for the foreign-born population - Austria (%)
Place of birth for the foreign-born population - Belgium (%)
Place of birth for the foreign-born population - France (%)
Place of birth for the foreign-born population - Germany (%)
Place of birth for the foreign-born population - Netherlands (%)
Place of birth for the foreign-born population - Switzerland (%)
Place of birth for the foreign-born population - Other Western Europe (%)
Place of birth for the foreign-born population - Greece (%)
Place of birth for the foreign-born population - Italy (%)
Place of birth for the foreign-born population - Portugal (%)
Place of birth for the foreign-born population - Spain (%)
Place of birth for the foreign-born population - Other Southern Europe (%)
Place of birth for the foreign-born population - Albania (%)
Place of birth for the foreign-born population - Belarus (%)
Place of birth for the foreign-born population - Bosnia and Herzegovina (%)
Place of birth for the foreign-born population - Bulgaria (%)
Place of birth for the foreign-born population - Croatia (%)
Place of birth for the foreign-born population - Czechoslovakia (%)
Place of birth for the foreign-born population - Hungary (%)
Place of birth for the foreign-born population - Latvia (%)
Place of birth for the foreign-born population - Lithuania (%)
Place of birth for the foreign-born population - North Macedonia (Macedonia) (%)
Place of birth for the foreign-born population - Moldova (%)
Place of birth for the foreign-born population - Poland (%)
Place of birth for the foreign-born population - Romania (%)
Place of birth for the foreign-born population - Russia (%)
Place of birth for the foreign-born population - Serbia (%)
Place of birth for the foreign-born population - Ukraine (%)
Place of birth for the foreign-born population - Other Eastern Europe (%)
Place of birth for the foreign-born population - China (%)
Place of birth for the foreign-born population - Hong Kong (%)
Place of birth for the foreign-born population - Taiwan (%)
Place of birth for the foreign-born population - Japan (%)
Place of birth for the foreign-born population - Korea (%)
Place of birth for the foreign-born population - Other Eastern Asia (%)
Place of birth for the foreign-born population - Afghanistan (%)
Place of birth for the foreign-born population - Bangladesh (%)
Place of birth for the foreign-born population - India (%)
Place of birth for the foreign-born population - Iran (%)
Place of birth for the foreign-born population - Kazakhstan (%)
Place of birth for the foreign-born population - Nepal (%)
Place of birth for the foreign-born population - Pakistan (%)
Place of birth for the foreign-born population - Sri Lanka (%)
Place of birth for the foreign-born population - Uzbekistan (%)
Place of birth for the foreign-born population - Other South Central Asia (%)
Place of birth for the foreign-born population - Burma (%)
Place of birth for the foreign-born population - Cambodia (%)
Place of birth for the foreign-born population - Indonesia (%)
Place of birth for the foreign-born population - Laos (%)
Place of birth for the foreign-born population - Malaysia (%)
Place of birth for the foreign-born population - Philippines (%)
Place of birth for the foreign-born population - Singapore (%)
Place of birth for the foreign-born population - Thailand (%)
Place of birth for the foreign-born population - Vietnam (%)
Place of birth for the foreign-born population - Other South Eastern Asia (%)
Place of birth for the foreign-born population - Armenia (%)
Place of birth for the foreign-born population - Iraq (%)
Place of birth for the foreign-born population - Israel (%)
Place of birth for the foreign-born population - Jordan (%)
Place of birth for the foreign-born population - Kuwait (%)
Place of birth for the foreign-born population - Lebanon (%)
Place of birth for the foreign-born population - Saudi Arabia (%)
Place of birth for the foreign-born population - Syria (%)
Place of birth for the foreign-born population - Turkey (%)
Place of birth for the foreign-born population - Yemen (%)
Place of birth for the foreign-born population - Other Western Asia (%)
Place of birth for the foreign-born population - Eritrea (%)
Place of birth for the foreign-born population - Ethiopia (%)
Place of birth for the foreign-born population - Kenya (%)
Place of birth for the foreign-born population - Somalia (%)
Place of birth for the foreign-born population - Uganda (%)
Place of birth for the foreign-born population - Zimbabwe (%)
Place of birth for the foreign-born population - Other Eastern Africa (%)
Place of birth for the foreign-born population - Cameroon (%)
Place of birth for the foreign-born population - Congo (%)
Place of birth for the foreign-born population - Democratic Republic of Congo (Zaire) (%)
Place of birth for the foreign-born population - Other Middle Africa (%)
Place of birth for the foreign-born population - Egypt (%)
Place of birth for the foreign-born population - Morocco (%)
Place of birth for the foreign-born population - Sudan (%)
Place of birth for the foreign-born population - Other Northern Africa (%)
Place of birth for the foreign-born population - South Africa (%)
Place of birth for the foreign-born population - Other Southern Africa (%)
Place of birth for the foreign-born population - Cabo Verde (%)
Place of birth for the foreign-born population - Ghana (%)
Place of birth for the foreign-born population - Liberia (%)
Place of birth for the foreign-born population - Nigeria (%)
Place of birth for the foreign-born population - Senegal (%)
Place of birth for the foreign-born population - Sierra Leone (%)
Place of birth for the foreign-born population - Other Western Africa (%)
Place of birth for the foreign-born population - Australia (%)
Place of birth for the foreign-born population - New Zealand (%)
Place of birth for the foreign-born population - Fiji (%)
Place of birth for the foreign-born population - Micronesia (%)
Place of birth for the foreign-born population - Bahamas (%)
Place of birth for the foreign-born population - Barbados (%)
Place of birth for the foreign-born population - Cuba (%)
Place of birth for the foreign-born population - Dominica (%)
Place of birth for the foreign-born population - Dominican Republic (%)
Place of birth for the foreign-born population - Grenada (%)
Place of birth for the foreign-born population - Haiti (%)
Place of birth for the foreign-born population - Jamaica (%)
Place of birth for the foreign-born population - St. Vincent and the Grenadines (%)
Place of birth for the foreign-born population - Trinidad and Tobago (%)
Place of birth for the foreign-born population - West Indies (%)
Place of birth for the foreign-born population - Other Caribbean (%)
Place of birth for the foreign-born population - Belize (%)
Place of birth for the foreign-born population - Costa Rica (%)
Place of birth for the foreign-born population - El Salvador (%)
Place of birth for the foreign-born population - Guatemala (%)
Place of birth for the foreign-born population - Honduras (%)
Place of birth for the foreign-born population - Mexico (%)
Place of birth for the foreign-born population - Nicaragua (%)
Place of birth for the foreign-born population - Panama (%)
Place of birth for the foreign-born population - Other Central America (%)
Place of birth for the foreign-born population - Argentina (%)
Place of birth for the foreign-born population - Bolivia (%)
Place of birth for the foreign-born population - Brazil (%)
Place of birth for the foreign-born population - Chile (%)
Place of birth for the foreign-born population - Colombia (%)
Place of birth for the foreign-born population - Ecuador (%)
Place of birth for the foreign-born population - Guyana (%)
Place of birth for the foreign-born population - Peru (%)
Place of birth for the foreign-born population - Uruguay (%)
Place of birth for the foreign-born population - Venezuela (%)
Place of birth for the foreign-born population - Other South America (%)
Place of birth for the foreign-born population - Canada (%)
Place of birth for the foreign-born population - Other Northern America (%)
Place of birth for the foreign-born population - Other (%)
Latest news about races in Smithtown, NY collected exclusively by city-data.com from local newspapers, TV, and radio stations
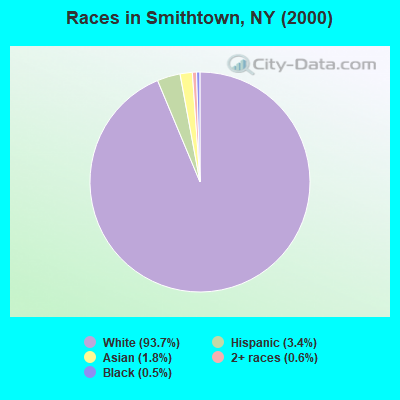
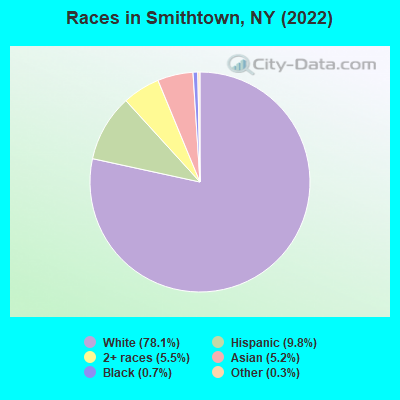
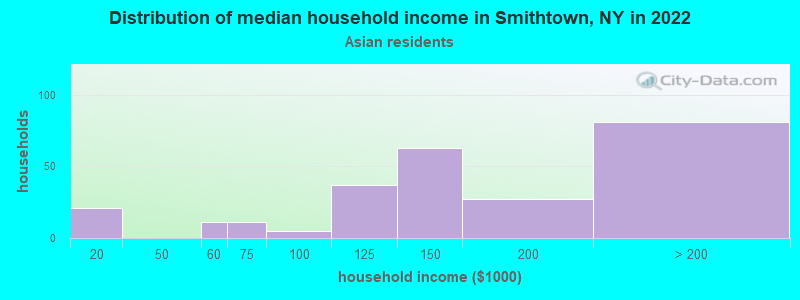
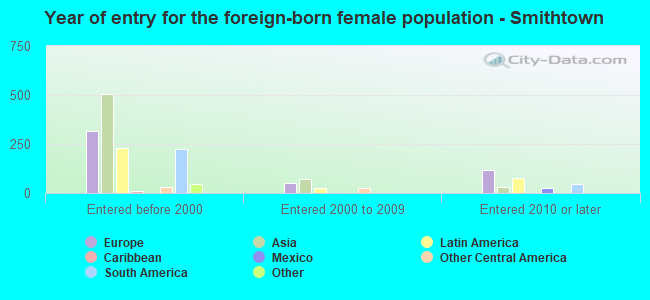
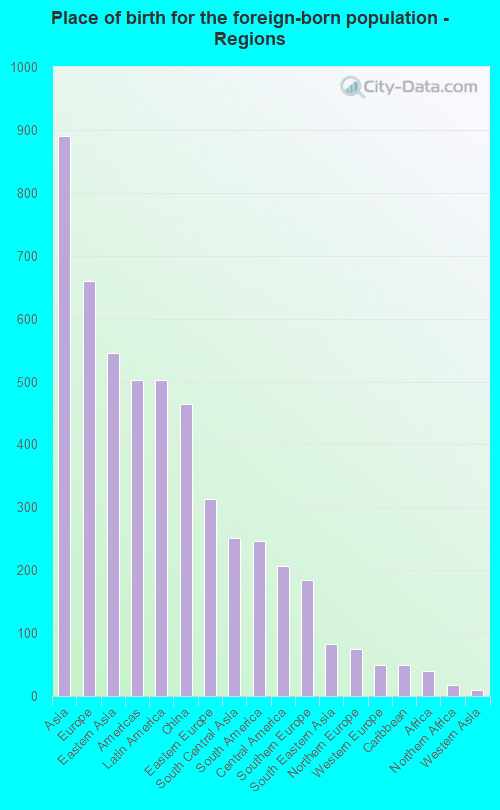
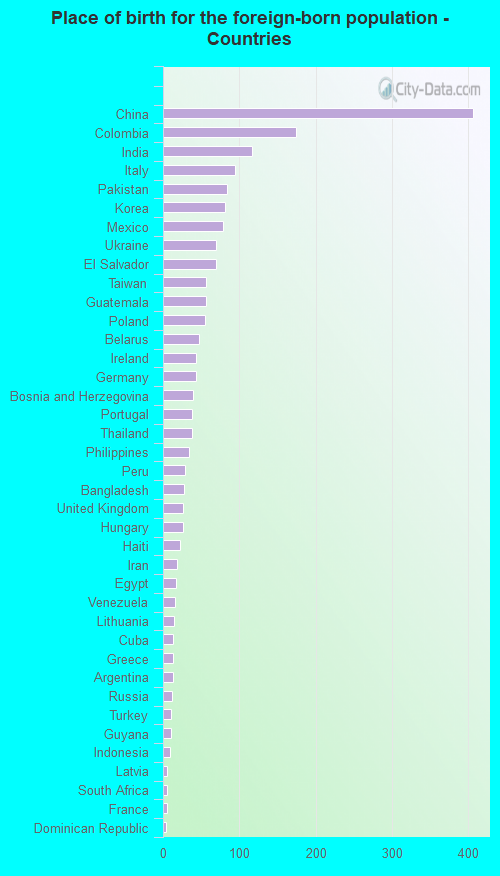
According to 2022 data, the most numerous races in Smithtown, NY are White alone (19,985 residents), Hispanic (2,518 residents), and Black alone (173 residents). 87.0% of Smithtown residents speak English at home. 8.2% of Smithtown, NY residents are foreign-born (3.5% born in Asia, 2.6% born in Europe, 2.0% born in Latin America), which is 169.0% less than the foreign-born rate of 22.0% across the entire state of New York.
Race distribution in Smithtown
2000 2022
11,760,981 62.0% White alone 2,867,583 15.1% Hispanic 2,812,623 14.8% Black alone 1,035,926 5.5% Asian alone 366,116 1.9% Two or more races 75,499 0.4% Other race alone 52,499 0.3% American Indian alone 5,230 0.03% Native Hawaiian and Other
10,408,933 52.9% White alone 3,867,299 19.7% Hispanic 2,633,840 13.4% Black alone 1,776,286 9.0% Asian alone 732,670 3.7% Two or more races 216,110 1.1% Other race alone 35,082 0.2% American Indian alone 6,931 0.04% Native Hawaiian and Other
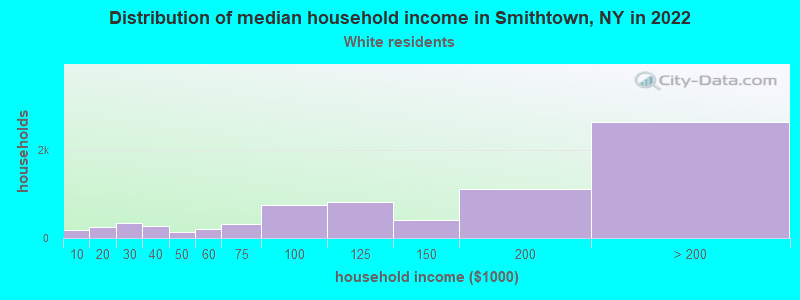
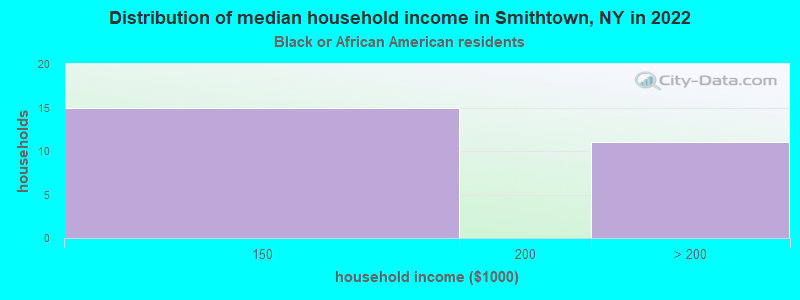
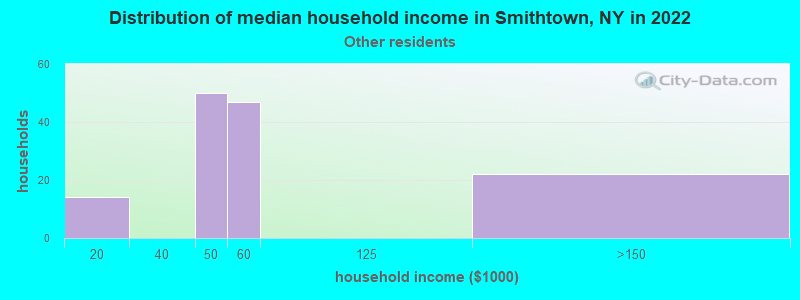
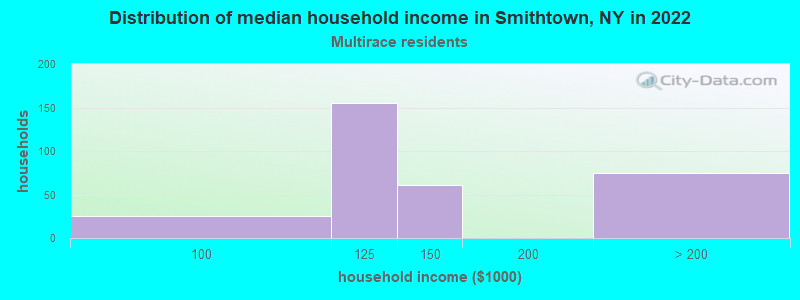
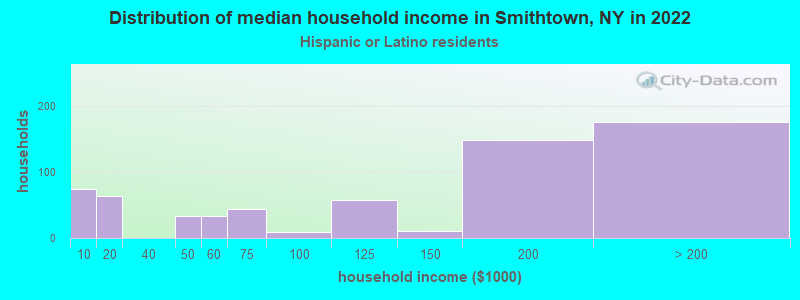
Income and house value in Smithtown Median household income in 2022 $146,318 White non-Hispanic householders$137,332 Asian householders$53,159 Some other race householders$130,931 Two or more races householders$157,465 Hispanic or Latino race householdersMedian 2022 house value $705,842 White Non-Hispanic householders$357,933 Black or African American householders$176,121 American Indian or Alaska Native householders $802,031 Asian householders$448,162 Some other race householders$521,591 Two or more races householders$642,709 Hispanic or Latino householders
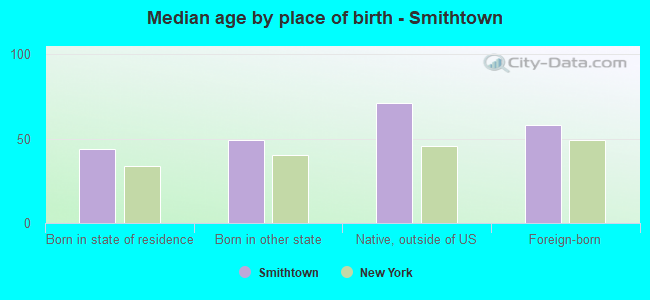
Median age by race in Smithtown
49.6 Median age for White residents47.0 51.6 59.9 Median age for Black or African American residents53.4 72.6 -748,832,865.7 Median age for American Indian / Alaska Native residents-807,017,543.1 -513,692,161.9 53.9 Median age for Asian residents34.0 61.1 -742,816,091.2 Median age for Native Hawaiian / Pacific Islander residents-831,187,409.8 -771,300,447.7 45.4 Median age for Other race residents39.8 47.5 26.3 Median age for Two or more races residents39.9 25.6 49.8 Median age for White alone residents48.2 51.2 28.9 Median age for Hispanic or Latino residents23.0 33.7
Owner/renter occupied households by race in Smithtown
House owners and renters - White residents 6,741 90.6% Owner occupied703 9.4% Renter occupiedHouse owners and renters - Black or African American residents 25 100.0% Owner occupiedHouse owners and renters - American Indian / Alaska Native residents 20 100.0% Owner occupiedHouse owners and renters - Asian residents 239 89.0% Owner occupied30 11.0% Renter occupiedHouse owners and renters - Other race residents 25 19.9% Owner occupied102 80.1% Renter occupiedHouse owners and renters - Two or more races residents 240 86.2% Owner occupied39 13.8% Renter occupiedHouse owners and renters - White alone residents 6,592 90.9% Owner occupied664 9.1% Renter occupiedHouse owners and renters - Hispanic or Latino residents 437 70.0% Owner occupied187 30.0% Renter occupied
Language usage in Smithtown
English speakers - Total 87.0% of residents of Smithtown speak English at home.
3.7% of residents speak Spanish at home 577 63.5% Speak English very well332 36.5% Speak English less than very well8.5% of residents speak other language at home 1,752 84.2% Speak English very well328 15.8% Speak English less than very well
English speakers - Born in the United States 95.7% of residents of Smithtown speak English at home.
1.0% of residents speak Spanish at home 16 100.0% Speak English very well4.0% of residents speak other language at home 63 100.0% Speak English very well
English speakers - Native, born elsewhere 33.3% of residents of Smithtown speak English at home.
47.3% of residents speak Spanish at home 3 3.4% Speak English very well85 96.6% Speak English less than very well15.6% of residents speak other language at home 29 100.0% Speak English very well
English speakers - Foreign-born 22.0% of residents of Smithtown speak English at home.
19.0% of residents speak Spanish at home 214 49.9% Speak English very well215 50.1% Speak English less than very well56.7% of residents speak other language at home 1,037 81.1% Speak English very well242 18.9% Speak English less than very well
White (Caucasian) - Speak only English Native:
98.1% (18,730)Foreign-born:
54.3% (289)
White (Caucasian) - Speak another language Native:
2.8% (528)Foreign-born:
53.2% (283)
Black or African American - Speak only English Native:
88.3% (117)Foreign-born:
21.7% (10)
Black or African American - Speak another language Native:
11.7% (15)Foreign-born:
71.8% (32)
American Indian / Alaska Native - Speak only English Native:
57.4% (3)Foreign-born:
48.4% (18)
Asian - Speak only English Native:
54.2% (203)Foreign-born:
9.0% (76)
Asian - Speak another language Native:
44.2% (166)Foreign-born:
92.7% (782)
Other race - Speak only English Native:
36.5% (109)Foreign-born:
4.0% (9)
Other race - Speak another language Native:
63.2% (188)Foreign-born:
96.8% (208)
Two or more races - Speak only English Native:
94.2% (1,482)Foreign-born:
5.5% (21)
Two or more races - Speak another language Native:
6.8% (107)Foreign-born:
95.4% (368)
White alone - Speak only English Native:
96.5% (17,956)Foreign-born:
40.6% (292)
White alone - Speak another language Native:
3.4% (640)Foreign-born:
59.4% (426)
Hispanic or Latino - Speak only English Native:
82.4% (1,415)Foreign-born:
12.8% (66)
Hispanic or Latino - Speak another language Native:
19.7% (338)Foreign-born:
86.7% (449)
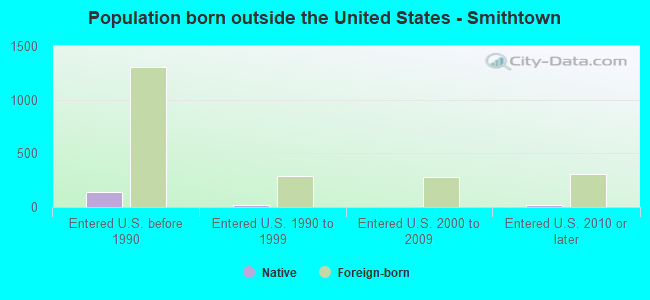
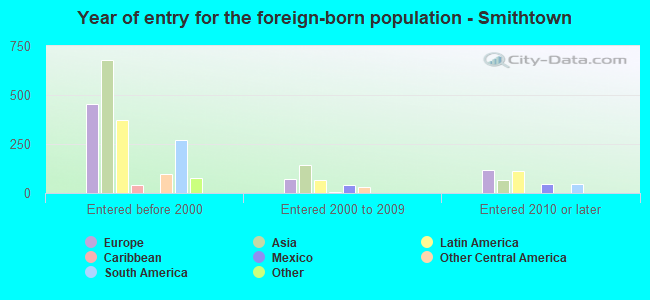
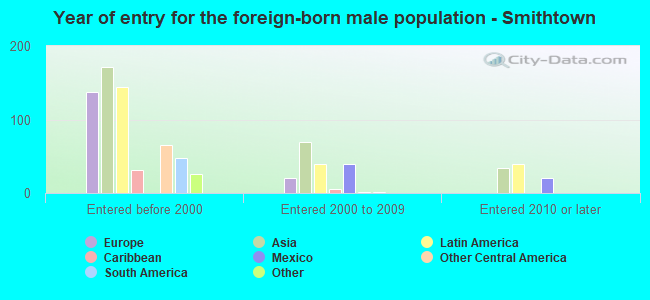
Foreign-born residents in Smithtown 2,094 residents are foreign born (3.5% Asia , 2.6% Europe , 2.0% Latin America ).
This city:
8.2%New York:
22.6%
Marital status for residents in Smithtown Marital status - White (Caucasian) population 15 years and over
Males 30.4% Never married60.5% Now married0.6% Separated3.9% Widowed4.6% DivorcedFemales 25.6% Never married56.0% Now married1.0% Separated9.1% Widowed8.2% DivorcedWomen who gave birth in the past 12 months Now married:
89.4% (117)Unmarried:
10.6% (14)
Women who did not give birth in the past 12 months Now married:
45.4% (1,597)Unmarried:
54.6% (1,922)
Marital status - Black or African American population 15 years and over
Males 61.2% Never married34.0% Now married0.0% Separated0.0% Widowed4.9% DivorcedFemales 33.8% Never married42.3% Now married0.0% Separated23.9% Widowed0.0% DivorcedWomen who did not give birth in the past 12 months Now married:
100.0% (14)Unmarried:
0.0% (0)
Marital status - American Indian / Alaska Native population 15 years and over
Males 100.0% Never married0.0% Now married0.0% Separated0.0% Widowed0.0% DivorcedFemales 0.0% Never married100.0% Now married0.0% Separated0.0% Widowed0.0% DivorcedWomen who did not give birth in the past 12 months Now married:
100.0% (26)Unmarried:
0.0% (0)
Marital status - Asian population 15 years and over
Males 42.9% Never married52.4% Now married4.7% Separated0.0% Widowed0.0% DivorcedFemales 11.4% Never married82.8% Now married1.4% Separated1.8% Widowed2.5% DivorcedWomen who gave birth in the past 12 months Now married:
100.0% (10)Unmarried:
0.0% (0)
Women who did not give birth in the past 12 months Now married:
56.1% (120)Unmarried:
43.9% (94)
Marital status - Other race population 15 years and over
Males 55.3% Never married22.0% Now married0.0% Separated0.0% Widowed22.8% DivorcedFemales 24.3% Never married19.9% Now married0.0% Separated38.1% Widowed17.7% DivorcedWomen who did not give birth in the past 12 months Now married:
28.3% (38)Unmarried:
71.7% (96)
Marital status - Two or more races population 15 years and over
Males 28.8% Never married63.0% Now married0.0% Separated6.2% Widowed2.0% DivorcedFemales 55.8% Never married42.4% Now married0.3% Separated0.0% Widowed1.5% DivorcedWomen who did not give birth in the past 12 months Now married:
16.9% (116)Unmarried:
83.1% (569)
Marital status - White alone, not Hispanic / Latino population 15 years and over
Males 29.9% Never married61.2% Now married0.6% Separated3.5% Widowed4.9% DivorcedFemales 24.9% Never married56.8% Now married1.1% Separated9.6% Widowed7.6% DivorcedWomen who gave birth in the past 12 months Now married:
89.4% (127)Unmarried:
10.6% (15)
Women who did not give birth in the past 12 months Now married:
46.7% (1,638)Unmarried:
53.3% (1,867)
Marital status - Hispanic or Latino population 15 years and over
Males 35.7% Never married49.6% Now married0.0% Separated11.1% Widowed3.5% DivorcedFemales 37.5% Never married45.3% Now married0.2% Separated4.8% Widowed12.2% DivorcedWomen who did not give birth in the past 12 months Now married:
28.3% (183)Unmarried:
71.7% (462)
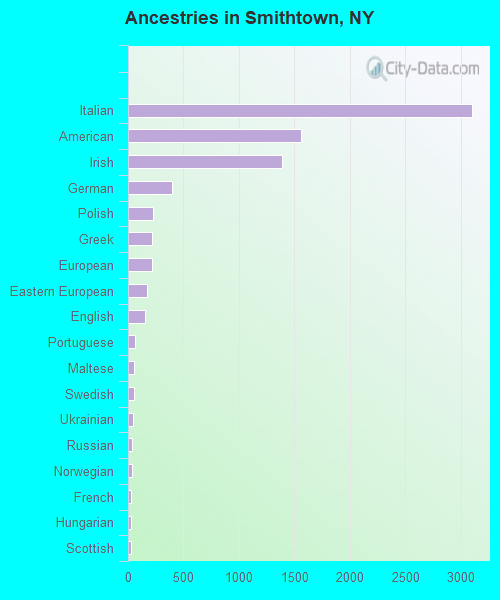
Ancestries in Smithtown
3,098 28.1% Italian1,557 14.1% American1,387 12.6% Irish398 3.6% German229 2.1% Polish218 2.0% Greek215 2.0% European174 1.6% Eastern European153 1.4% English67 0.6% Portuguese58 0.5% Maltese58 0.5% Swedish42 0.4% Ukrainian34 0.3% Russian33 0.3% Norwegian31 0.3% French31 0.3% Hungarian30 0.3% Scottish26 0.2% French Canadian25 0.2% Lithuanian25 0.2% Haitian23 0.2% Latvian18 0.2% Jamaican13 0.1% Egyptian13 0.1% Iranian11 0.10% Czech11 0.10% Czechoslovakian7 0.06% Austrian6 0.05% Armenian5 0.05% Scandinavian4 0.04% Turkish4 0.04% Trinidadian and Tobagonian3 0.03% Danish1 0.01% Afghan
Children Nativity (place of birth) in Smithtown
Children under 6 years - Living with two parents Both parents native 1,117 100.0% NativeBoth parents foreign-born 55 100.0% NativeOne native, one foreign-born parent 196 100.0% NativeChildren under 6 years - Living with one parent Native parent 78 89.5% Native9 10.5% Foreign-bornChildren 6 to 17 years - Living with two parents Both parents native 2,434 99.7% Native8 0.3% Foreign-bornBoth parents foreign-born 154 100.0% NativeOne native, one foreign-born parent 333 100.0% NativeChildren 6 to 17 years - Living with one parent Native parent 415 100.0% NativeForeign-born parent 108 60.9% Native69 39.1% Foreign-born
Grandparents responsible for own grandchildren in Smithtown
Grandparents (30 to 59 years) White / Caucasian 16 55.9% Responsible for grandchildren12 44.1% Not responsible for grandchildrenAsian 15 100.0% Not responsible for grandchildrenWhite alone, not Hispanic / Latino 15 52.0% Responsible for grandchildren14 48.0% Not responsible for grandchildrenGrandparents (60 years and over) White / Caucasian 35 51.5% Responsible for grandchildren33 48.5% Not responsible for grandchildrenAsian 42 100.0% Not responsible for grandchildrenWhite alone, not Hispanic / Latino 43 54.1% Responsible for grandchildren36 45.9% Not responsible for grandchildren