Races in Smithville, New York (NY) Detailed Stats
Ancestries, Foreign-born residents, place of birth

Recent posts about races in Smithville, New York on our local forum with over 2,400,000 registered users:
 | WBLI Morning Show (36 replies) |
1.1% of Smithville, NY residents are foreign-born , which is 1875.6% less than the foreign-born rate of 22.0% across the entire state of New York.
Race distribution in Smithville

- 1,30496.8%White alone
- 161.2%Two or more races
- 120.9%Hispanic
- 70.5%Black alone
- 40.3%Asian alone
- 40.3%American Indian alone

2000
2022
-
- 11,760,98162.0%White alone
- 2,867,58315.1%Hispanic
- 2,812,62314.8%Black alone
- 1,035,9265.5%Asian alone
- 366,1161.9%Two or more races
- 75,4990.4%Other race alone
- 52,4990.3%American Indian alone
- 5,2300.03%Native Hawaiian and Other
Pacific Islander alone

-
- 10,408,93352.9%White alone
- 3,867,29919.7%Hispanic
- 2,633,84013.4%Black alone
- 1,776,2869.0%Asian alone
- 732,6703.7%Two or more races
- 216,1101.1%Other race alone
- 35,0820.2%American Indian alone
- 6,9310.04%Native Hawaiian and Other
Pacific Islander alone

Income and house value in Smithville
- Median household income in 2022
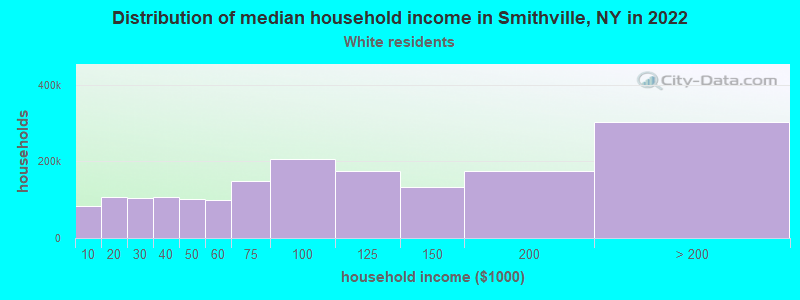
- $63,744White non-Hispanic householders
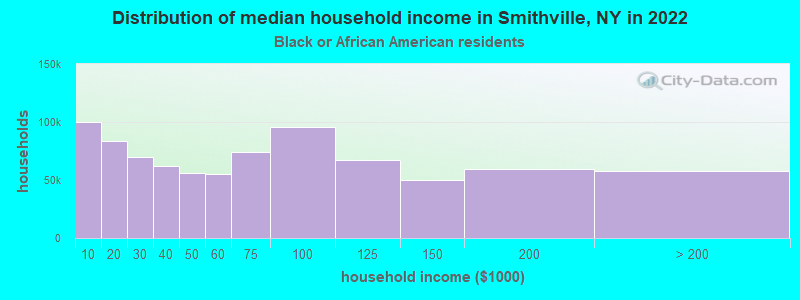
- $105,426Black householders
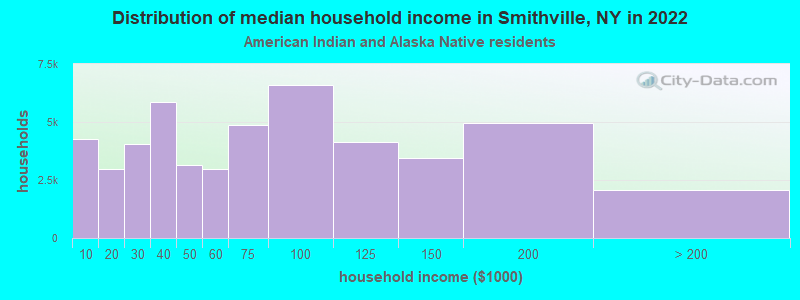
- $116,906American Indian and Alaska Native householders
- $94,452Some other race householders
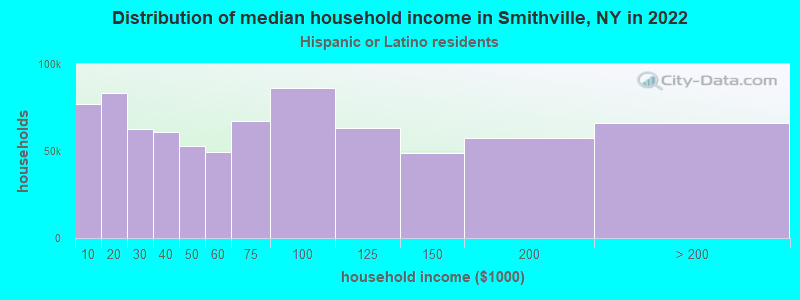
- $72,593Hispanic or Latino race householders
- Median 2022 house value
- $128,620White Non-Hispanic householders
- $119,093American Indian or Alaska Native householders
- $119,093Hispanic or Latino householders
Household income for White non-Hispanic householders
Household income for Black householders
Household income for American Indian and Alaska Native householders
Household income for Hispanic or Latino race householders
Foreign-born residents in Smithville
15 residents are foreign born
| This city: | 1.1% |
| New York: | 20.4% |
Ancestries in Smithville

- 26020.6%German
- 22517.9%English
- 18414.6%Irish
- 1007.9%Other
- 967.6%Dutch
- 776.1%United States
- 604.8%Italian
- 534.2%French
- 292.3%Polish
- 262.1%Scottish
- 231.8%Czech
- 191.5%Scotch-Irish
- 181.4%Hungarian
- 171.3%Ukrainian
- 131.0%Swiss
- 90.7%Norwegian
- 90.7%Subsaharan African
- 80.6%French Canadian
- 80.6%Slovak
- 80.6%Welsh
- 60.5%Swedish
- 50.4%Russian
- 30.2%Danish
- 20.2%Arab
- 20.2%Portuguese

Zip codes: 13778.