Races in Smyrna, Tennessee (TN) Detailed Stats
Data:
Races - White alone (%)
Races - White alone (% change since 2000)
Races - Black alone (%)
Races - Black alone (% change since 2000)
Races - American Indian alone (%)
Races - American Indian alone (% change since 2000)
Races - Asian alone (%)
Races - Asian alone (% change since 2000)
Races - Hispanic (%)
Races - Hispanic (% change since 2000)
Races - Native Hawaiian and Other Pacific Islander alone (%)
Races - Native Hawaiian and Other Pacific Islander alone (% change since 2000)
Races - Two or more races(%)
Races - Two or more races(% change since 2000)
Races - Other race alone (%)
Races - Other race alone (% change since 2000)
Racial diversity
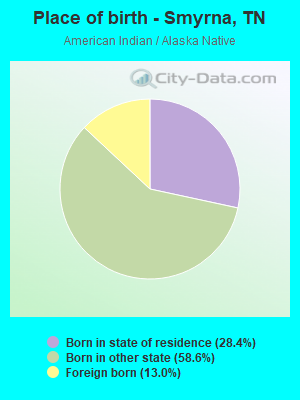
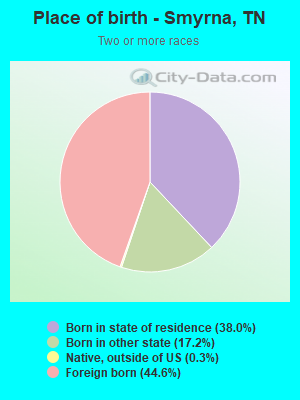
Place of birth - Born in state of residence (%)
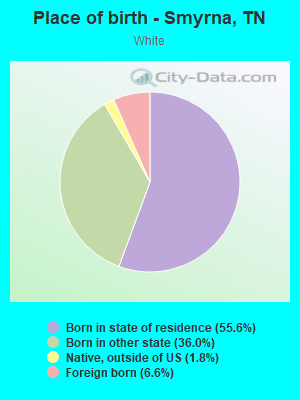
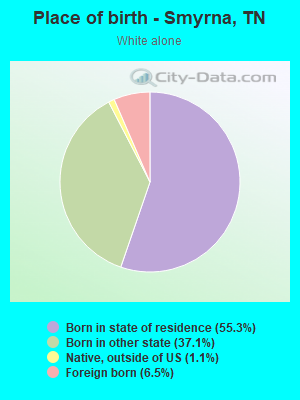
Place of birth - Born in state of residence (%) - White
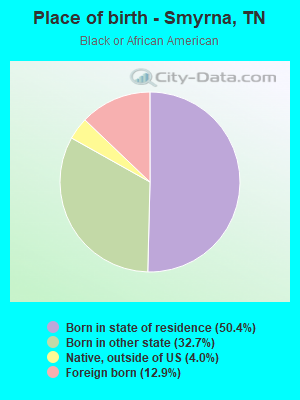
Place of birth - Born in state of residence (%) - Black or African American
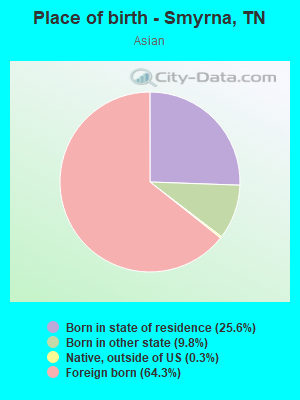
Place of birth - Born in state of residence (%) - Asian
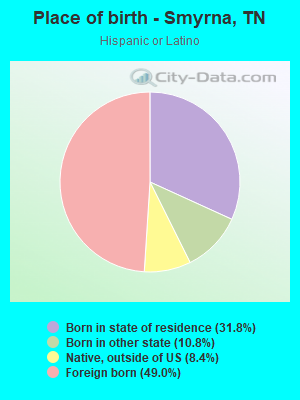
Place of birth - Born in state of residence (%) - Hispanic or Latino
Place of birth - Born in state of residence (%) - American Indian and Alaska Native
Place of birth - Born in state of residence (%) - Multirace
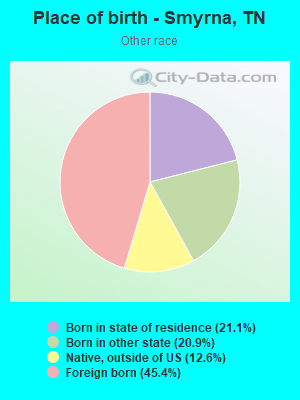
Place of birth - Born in state of residence (%) - Other Race
Place of birth - Born in other state (%)
Place of birth - Born in other state (%) - White
Place of birth - Born in other state (%) - Black or African American
Place of birth - Born in other state (%) - Asian
Place of birth - Born in other state (%) - Hispanic or Latino
Place of birth - Born in other state (%) - American Indian and Alaska Native
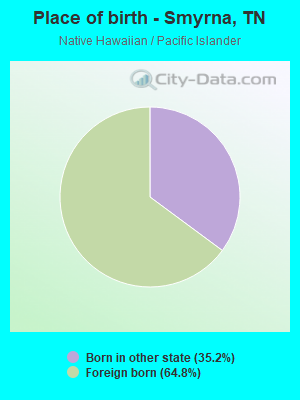
Place of birth - Born in other state (%) - Multirace
Place of birth - Born in other state (%) - Other Race
Place of birth - Native, outside of US (%)
Place of birth - Native, outside of US (%) - White
Place of birth - Native, outside of US (%) - Black or African American
Place of birth - Native, outside of US (%) - Asian
Place of birth - Native, outside of US (%) - Hispanic or Latino
Place of birth - Native, outside of US (%) - American Indian and Alaska Native
Place of birth - Native, outside of US (%) - Multirace
Place of birth - Native, outside of US (%) - Other Race
Place of birth - Foreign born (%)
Place of birth - Foreign born (%) - White
Place of birth - Foreign born (%) - Black or African American
Place of birth - Foreign born (%) - Asian
Place of birth - Foreign born (%) - Hispanic or Latino
Place of birth - Foreign born (%) - American Indian and Alaska Native
Place of birth - Foreign born (%) - Multirace
Place of birth - Foreign born (%) - Other Race
Residents speaking English at home (%)
Residents speaking English at home - Born in the United States (%)
Residents speaking English at home - Native, born elsewhere (%)
Residents speaking English at home - Foreign born (%)
Residents speaking Spanish at home (%)
Residents speaking Spanish at home - Born in the United States (%)
Residents speaking Spanish at home - Native, born elsewhere (%)
Residents speaking Spanish at home - Foreign born (%)
Residents speaking other language at home (%)
Residents speaking other language at home - Born in the United States (%)
Residents speaking other language at home - Native, born elsewhere (%)
Residents speaking other language at home - Foreign born (%)
Marital status - Never married (%)
Marital status - Now married (%)
Marital status - Separated (%)
Marital status - Widowed (%)
Marital status - Divorced (%)
Ancestries Reported - Arab (%)
Ancestries Reported - Czech (%)
Ancestries Reported - Danish (%)
Ancestries Reported - Dutch (%)
Ancestries Reported - English (%)
Ancestries Reported - French (%)
Ancestries Reported - French Canadian (%)
Ancestries Reported - German (%)
Ancestries Reported - Greek (%)
Ancestries Reported - Hungarian (%)
Ancestries Reported - Irish (%)
Ancestries Reported - Italian (%)
Ancestries Reported - Lithuanian (%)
Ancestries Reported - Norwegian (%)
Ancestries Reported - Polish (%)
Ancestries Reported - Portuguese (%)
Ancestries Reported - Russian (%)
Ancestries Reported - Scotch-Irish (%)
Ancestries Reported - Scottish (%)
Ancestries Reported - Slovak (%)
Ancestries Reported - Subsaharan African (%)
Ancestries Reported - Swedish (%)
Ancestries Reported - Swiss (%)
Ancestries Reported - Ukrainian (%)
Ancestries Reported - United States (%)
Ancestries Reported - Welsh (%)
Ancestries Reported - West Indian (%)
Ancestries Reported - Other (%)
Geographical mobility - Same house 1 year ago (%)
Geographical mobility - Same house 1 year ago (%) - White
Geographical mobility - Same house 1 year ago (%) - Black or African American
Geographical mobility - Same house 1 year ago (%) - Asian
Geographical mobility - Same house 1 year ago (%) - Hispanic or Latino
Geographical mobility - Same house 1 year ago (%) - American Indian and Alaska Native
Geographical mobility - Same house 1 year ago (%) - Multirace
Geographical mobility - Same house 1 year ago (%) - Other Race
Geographical mobility - Moved within same county (%)
Geographical mobility - Moved within same county (%) - White
Geographical mobility - Moved within same county (%) - Black or African American
Geographical mobility - Moved within same county (%) - Asian
Geographical mobility - Moved within same county (%) - Hispanic or Latino
Geographical mobility - Moved within same county (%) - American Indian and Alaska Native
Geographical mobility - Moved within same county (%) - Multirace
Geographical mobility - Moved within same county (%) - Other Race
Geographical mobility - Moved from different county within same state (%)
Geographical mobility - Moved from different county within same state (%) - White
Geographical mobility - Moved from different county within same state (%) - Black or African American
Geographical mobility - Moved from different county within same state (%) - Asian
Geographical mobility - Moved from different county within same state (%) - Hispanic or Latino
Geographical mobility - Moved from different county within same state (%) - American Indian and Alaska Native
Geographical mobility - Moved from different county within same state (%) - Multirace
Geographical mobility - Moved from different county within same state (%) - Other Race
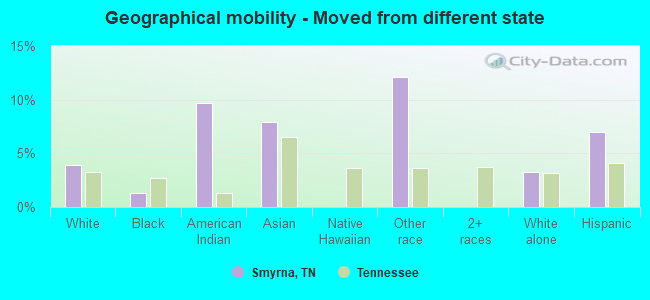
Geographical mobility - Moved from different state (%)
Geographical mobility - Moved from different state (%) - White
Geographical mobility - Moved from different state (%) - Black or African American
Geographical mobility - Moved from different state (%) - Asian
Geographical mobility - Moved from different state (%) - Hispanic or Latino
Geographical mobility - Moved from different state (%) - American Indian and Alaska Native
Geographical mobility - Moved from different state (%) - Multirace
Geographical mobility - Moved from different state (%) - Other Race
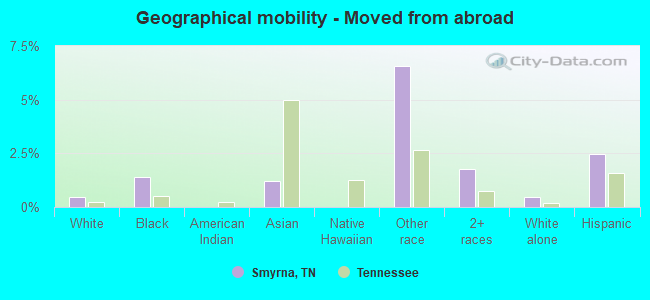
Geographical mobility - Moved from abroad (%)
Geographical mobility - Moved from abroad (%) - White
Geographical mobility - Moved from abroad (%) - Black or African American
Geographical mobility - Moved from abroad (%) - Asian
Geographical mobility - Moved from abroad (%) - Hispanic or Latino
Geographical mobility - Moved from abroad (%) - American Indian and Alaska Native
Geographical mobility - Moved from abroad (%) - Multirace
Geographical mobility - Moved from abroad (%) - Other Race
Place of birth for the foreign-born population - Ireland (%)
Place of birth for the foreign-born population - Denmark (%)
Place of birth for the foreign-born population - Norway (%)
Place of birth for the foreign-born population - Sweden (%)
Place of birth for the foreign-born population - United Kingdom (%)
Place of birth for the foreign-born population - England (%)
Place of birth for the foreign-born population - Scotland (%)
Place of birth for the foreign-born population - Other Northern Europe (%)
Place of birth for the foreign-born population - Austria (%)
Place of birth for the foreign-born population - Belgium (%)
Place of birth for the foreign-born population - France (%)
Place of birth for the foreign-born population - Germany (%)
Place of birth for the foreign-born population - Netherlands (%)
Place of birth for the foreign-born population - Switzerland (%)
Place of birth for the foreign-born population - Other Western Europe (%)
Place of birth for the foreign-born population - Greece (%)
Place of birth for the foreign-born population - Italy (%)
Place of birth for the foreign-born population - Portugal (%)
Place of birth for the foreign-born population - Spain (%)
Place of birth for the foreign-born population - Other Southern Europe (%)
Place of birth for the foreign-born population - Albania (%)
Place of birth for the foreign-born population - Belarus (%)
Place of birth for the foreign-born population - Bosnia and Herzegovina (%)
Place of birth for the foreign-born population - Bulgaria (%)
Place of birth for the foreign-born population - Croatia (%)
Place of birth for the foreign-born population - Czechoslovakia (%)
Place of birth for the foreign-born population - Hungary (%)
Place of birth for the foreign-born population - Latvia (%)
Place of birth for the foreign-born population - Lithuania (%)
Place of birth for the foreign-born population - North Macedonia (Macedonia) (%)
Place of birth for the foreign-born population - Moldova (%)
Place of birth for the foreign-born population - Poland (%)
Place of birth for the foreign-born population - Romania (%)
Place of birth for the foreign-born population - Russia (%)
Place of birth for the foreign-born population - Serbia (%)
Place of birth for the foreign-born population - Ukraine (%)
Place of birth for the foreign-born population - Other Eastern Europe (%)
Place of birth for the foreign-born population - China (%)
Place of birth for the foreign-born population - Hong Kong (%)
Place of birth for the foreign-born population - Taiwan (%)
Place of birth for the foreign-born population - Japan (%)
Place of birth for the foreign-born population - Korea (%)
Place of birth for the foreign-born population - Other Eastern Asia (%)
Place of birth for the foreign-born population - Afghanistan (%)
Place of birth for the foreign-born population - Bangladesh (%)
Place of birth for the foreign-born population - India (%)
Place of birth for the foreign-born population - Iran (%)
Place of birth for the foreign-born population - Kazakhstan (%)
Place of birth for the foreign-born population - Nepal (%)
Place of birth for the foreign-born population - Pakistan (%)
Place of birth for the foreign-born population - Sri Lanka (%)
Place of birth for the foreign-born population - Uzbekistan (%)
Place of birth for the foreign-born population - Other South Central Asia (%)
Place of birth for the foreign-born population - Burma (%)
Place of birth for the foreign-born population - Cambodia (%)
Place of birth for the foreign-born population - Indonesia (%)
Place of birth for the foreign-born population - Laos (%)
Place of birth for the foreign-born population - Malaysia (%)
Place of birth for the foreign-born population - Philippines (%)
Place of birth for the foreign-born population - Singapore (%)
Place of birth for the foreign-born population - Thailand (%)
Place of birth for the foreign-born population - Vietnam (%)
Place of birth for the foreign-born population - Other South Eastern Asia (%)
Place of birth for the foreign-born population - Armenia (%)
Place of birth for the foreign-born population - Iraq (%)
Place of birth for the foreign-born population - Israel (%)
Place of birth for the foreign-born population - Jordan (%)
Place of birth for the foreign-born population - Kuwait (%)
Place of birth for the foreign-born population - Lebanon (%)
Place of birth for the foreign-born population - Saudi Arabia (%)
Place of birth for the foreign-born population - Syria (%)
Place of birth for the foreign-born population - Turkey (%)
Place of birth for the foreign-born population - Yemen (%)
Place of birth for the foreign-born population - Other Western Asia (%)
Place of birth for the foreign-born population - Eritrea (%)
Place of birth for the foreign-born population - Ethiopia (%)
Place of birth for the foreign-born population - Kenya (%)
Place of birth for the foreign-born population - Somalia (%)
Place of birth for the foreign-born population - Uganda (%)
Place of birth for the foreign-born population - Zimbabwe (%)
Place of birth for the foreign-born population - Other Eastern Africa (%)
Place of birth for the foreign-born population - Cameroon (%)
Place of birth for the foreign-born population - Congo (%)
Place of birth for the foreign-born population - Democratic Republic of Congo (Zaire) (%)
Place of birth for the foreign-born population - Other Middle Africa (%)
Place of birth for the foreign-born population - Egypt (%)
Place of birth for the foreign-born population - Morocco (%)
Place of birth for the foreign-born population - Sudan (%)
Place of birth for the foreign-born population - Other Northern Africa (%)
Place of birth for the foreign-born population - South Africa (%)
Place of birth for the foreign-born population - Other Southern Africa (%)
Place of birth for the foreign-born population - Cabo Verde (%)
Place of birth for the foreign-born population - Ghana (%)
Place of birth for the foreign-born population - Liberia (%)
Place of birth for the foreign-born population - Nigeria (%)
Place of birth for the foreign-born population - Senegal (%)
Place of birth for the foreign-born population - Sierra Leone (%)
Place of birth for the foreign-born population - Other Western Africa (%)
Place of birth for the foreign-born population - Australia (%)
Place of birth for the foreign-born population - New Zealand (%)
Place of birth for the foreign-born population - Fiji (%)
Place of birth for the foreign-born population - Micronesia (%)
Place of birth for the foreign-born population - Bahamas (%)
Place of birth for the foreign-born population - Barbados (%)
Place of birth for the foreign-born population - Cuba (%)
Place of birth for the foreign-born population - Dominica (%)
Place of birth for the foreign-born population - Dominican Republic (%)
Place of birth for the foreign-born population - Grenada (%)
Place of birth for the foreign-born population - Haiti (%)
Place of birth for the foreign-born population - Jamaica (%)
Place of birth for the foreign-born population - St. Vincent and the Grenadines (%)
Place of birth for the foreign-born population - Trinidad and Tobago (%)
Place of birth for the foreign-born population - West Indies (%)
Place of birth for the foreign-born population - Other Caribbean (%)
Place of birth for the foreign-born population - Belize (%)
Place of birth for the foreign-born population - Costa Rica (%)
Place of birth for the foreign-born population - El Salvador (%)
Place of birth for the foreign-born population - Guatemala (%)
Place of birth for the foreign-born population - Honduras (%)
Place of birth for the foreign-born population - Mexico (%)
Place of birth for the foreign-born population - Nicaragua (%)
Place of birth for the foreign-born population - Panama (%)
Place of birth for the foreign-born population - Other Central America (%)
Place of birth for the foreign-born population - Argentina (%)
Place of birth for the foreign-born population - Bolivia (%)
Place of birth for the foreign-born population - Brazil (%)
Place of birth for the foreign-born population - Chile (%)
Place of birth for the foreign-born population - Colombia (%)
Place of birth for the foreign-born population - Ecuador (%)
Place of birth for the foreign-born population - Guyana (%)
Place of birth for the foreign-born population - Peru (%)
Place of birth for the foreign-born population - Uruguay (%)
Place of birth for the foreign-born population - Venezuela (%)
Place of birth for the foreign-born population - Other South America (%)
Place of birth for the foreign-born population - Canada (%)
Place of birth for the foreign-born population - Other Northern America (%)
Place of birth for the foreign-born population - Other (%)
Latest news about races in Smyrna, TN collected exclusively by city-data.com from local newspapers, TV, and radio stations
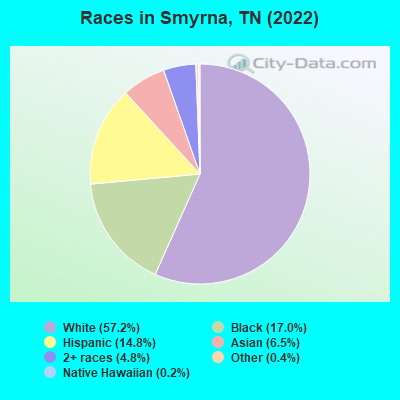
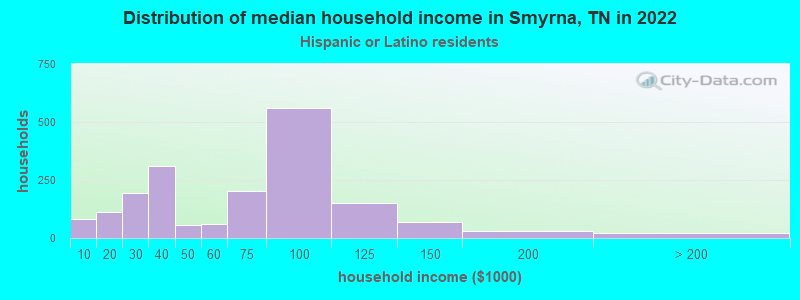
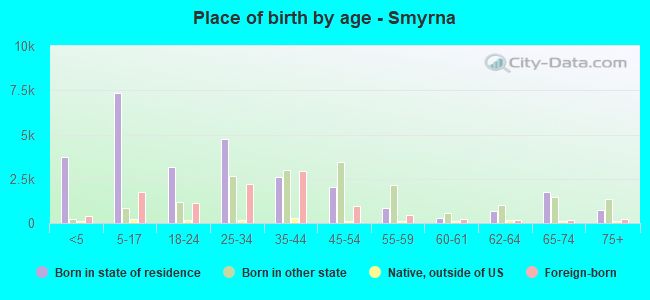
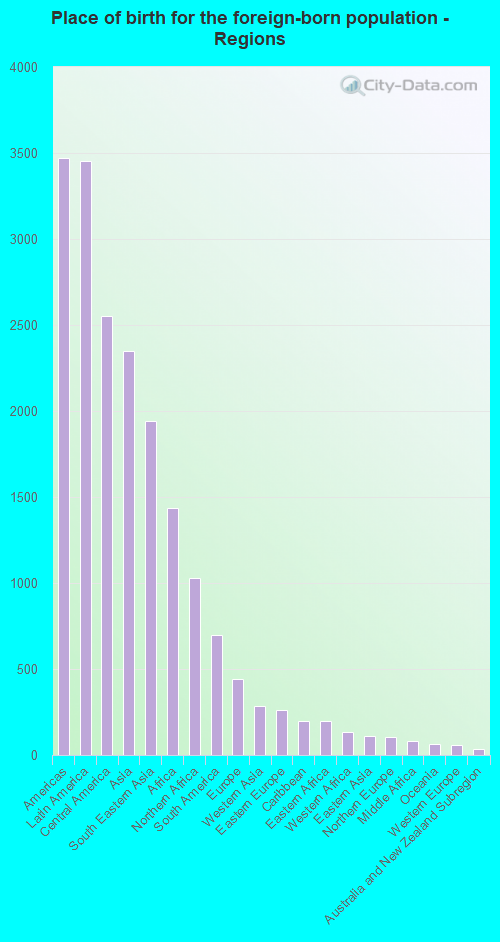
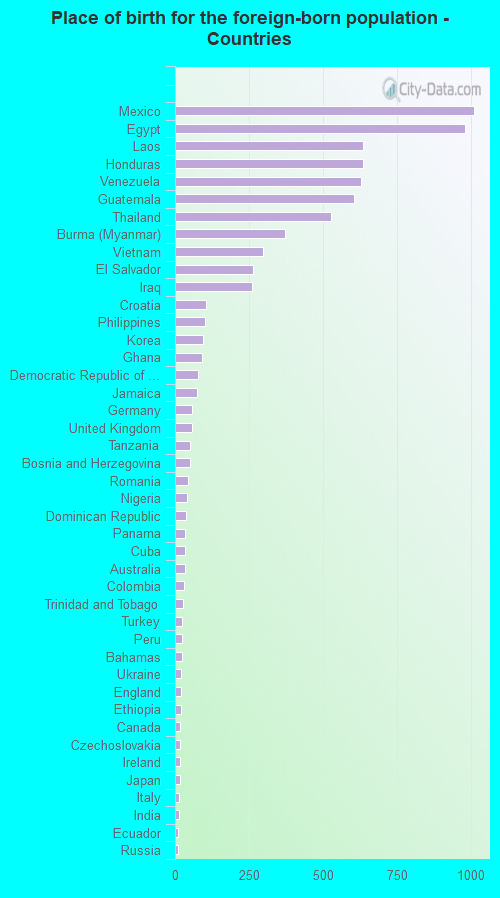
According to 2022 data, the most numerous races in Smyrna, TN are White alone (32,240 residents), Black alone (9,573 residents), and Hispanic (8,362 residents). 76.4% of Smyrna residents speak English at home. 13.8% of Smyrna, TN residents are foreign-born (6.1% born in Latin America, 4.2% born in Asia, 2.6% born in Africa), which is 63.7% greater than the foreign-born rate of 5.0% across the entire state of Tennessee.
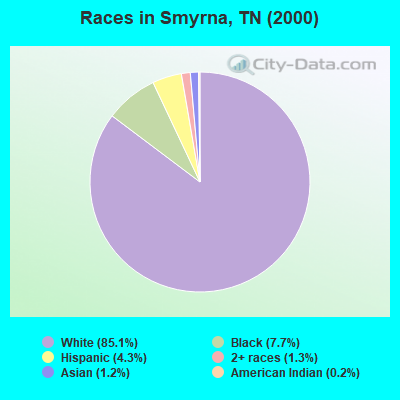
Race distribution in Smyrna
2000 2022
4,505,930 79.2% White alone 928,204 16.3% Black alone 123,838 2.2% Hispanic 54,824 1.0% Two or more races 56,077 1.0% Asian alone 13,820 0.2% American Indian alone 4,780 0.08% Other race alone 1,810 0.03% Native Hawaiian and Other
5,070,026 71.9% White alone 1,089,738 15.5% Black alone 442,629 6.3% Hispanic 279,381 4.0% Two or more races 131,817 1.9% Asian alone 26,972 0.4% Other race alone 6,387 0.09% American Indian alone 4,389 0.06% Native Hawaiian and Other
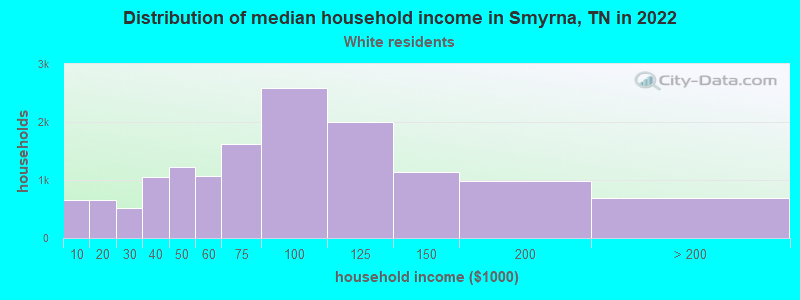
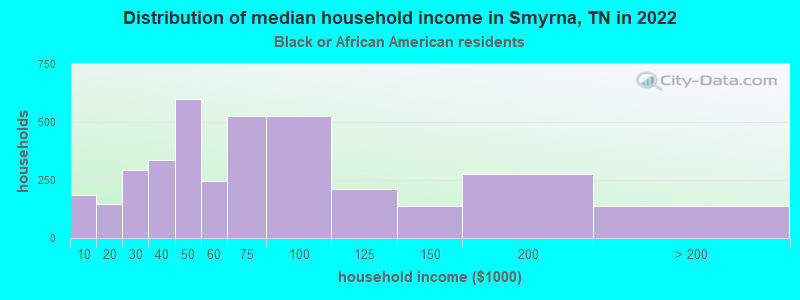
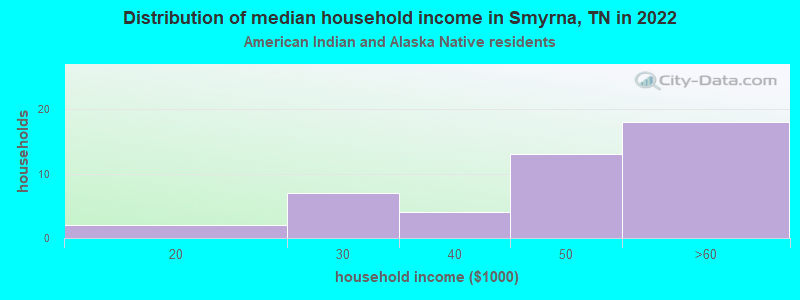
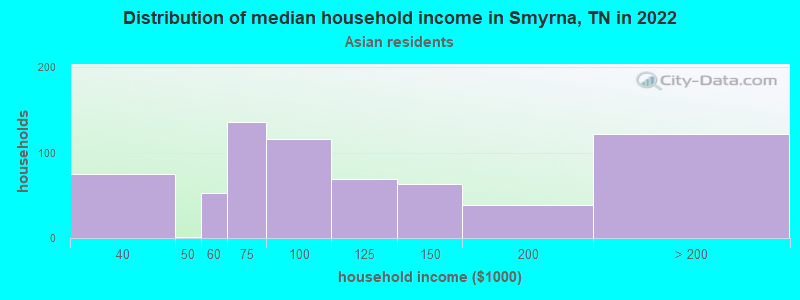
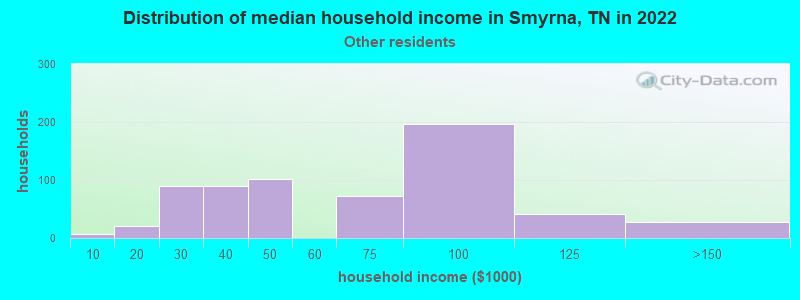
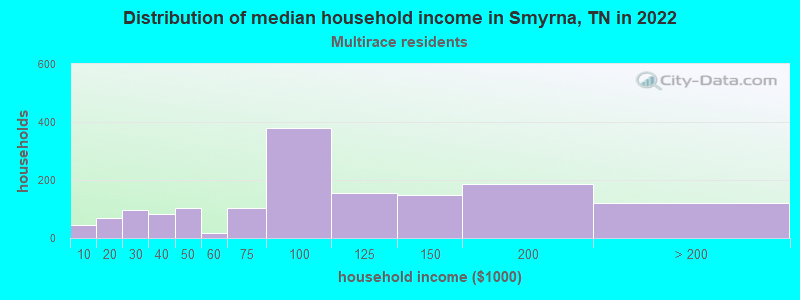
Income and house value in Smyrna Median household income in 2022 $77,339 White non-Hispanic householders$62,176 Black householders$40,345 American Indian and Alaska Native householders$111,153 Asian householders$54,759 Some other race householders$88,228 Two or more races householders$70,409 Hispanic or Latino race householdersMedian 2022 house value $369,892 White Non-Hispanic householders$406,882 Black or African American householders$406,560 American Indian or Alaska Native householders $453,520 Asian householders$251,205 Two or more races householders$364,746 Hispanic or Latino householders
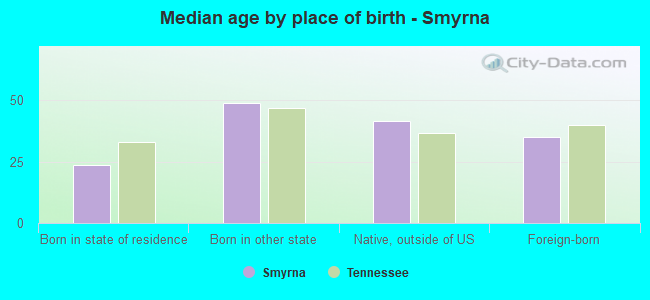
Median age by race in Smyrna
38.1 Median age for White residents36.4 39.8 32.2 Median age for Black or African American residents28.6 33.8 29.9 Median age for American Indian / Alaska Native residents28.1 28.5 29.3 Median age for Asian residents26.4 30.7 68.5 Median age for Native Hawaiian / Pacific Islander residents-951,707,890.7 67.0 24.7 Median age for Other race residents33.3 25.2 21.1 Median age for Two or more races residents23.3 20.4 39.4 Median age for White alone residents37.6 41.2 22.6 Median age for Hispanic or Latino residents23.9 21.4
Owner/renter occupied households by race in Smyrna
House owners and renters - White residents 8,959 63.1% Owner occupied5,238 36.9% Renter occupiedHouse owners and renters - Black or African American residents 1,434 38.7% Owner occupied2,267 61.3% Renter occupiedHouse owners and renters - American Indian / Alaska Native residents 22 70.9% Owner occupied9 29.1% Renter occupiedHouse owners and renters - Asian residents 717 86.1% Owner occupied116 13.9% Renter occupiedHouse owners and renters - Native Hawaiian / Pacific Islander residents 18 100.0% Renter occupiedHouse owners and renters - Other race residents 272 49.0% Owner occupied284 51.0% Renter occupiedHouse owners and renters - Two or more races residents 587 35.2% Owner occupied1,081 64.8% Renter occupiedHouse owners and renters - White alone residents 8,943 65.0% Owner occupied4,810 35.0% Renter occupiedHouse owners and renters - Hispanic or Latino residents 392 19.8% Owner occupied1,582 80.2% Renter occupied
Language usage in Smyrna
English speakers - Total 76.4% of residents of Smyrna speak English at home.
11.6% of residents speak Spanish at home 1,664 27.4% Speak English very well4,408 72.6% Speak English less than very well15.1% of residents speak other language at home 4,513 57.4% Speak English very well3,351 42.6% Speak English less than very well
English speakers - Born in the United States 93.0% of residents of Smyrna speak English at home.
2.9% of residents speak Spanish at home 379 75.6% Speak English very well122 24.4% Speak English less than very well4.5% of residents speak other language at home 708 90.3% Speak English very well76 9.7% Speak English less than very well
English speakers - Native, born elsewhere 64.0% of residents of Smyrna speak English at home.
52.2% of residents speak Spanish at home 278 38.6% Speak English very well443 61.4% Speak English less than very well13.3% of residents speak other language at home 173 94.0% Speak English very well11 6.0% Speak English less than very well
English speakers - Foreign-born 8.0% of residents of Smyrna speak English at home.
38.9% of residents speak Spanish at home 393 10.1% Speak English very well3,512 89.9% Speak English less than very well55.9% of residents speak other language at home 2,833 50.5% Speak English very well2,776 49.5% Speak English less than very well
White (Caucasian) - Speak only English Native:
94.5% (27,967)Foreign-born:
14.6% (324)
White (Caucasian) - Speak another language Native:
5.3% (1,561)Foreign-born:
83.8% (1,866)
Black or African American - Speak only English Native:
93.8% (7,512)Foreign-born:
19.0% (238)
Black or African American - Speak another language Native:
7.2% (580)Foreign-born:
32.4% (407)
Asian - Speak only English Native:
27.1% (276)Foreign-born:
3.1% (74)
Asian - Speak another language Native:
71.2% (723)Foreign-born:
97.8% (2,326)
Other race - Speak only English Native:
61.0% (790)Foreign-born:
10.1% (91)
Other race - Speak another language Native:
44.1% (570)Foreign-born:
92.7% (833)
Two or more races - Speak only English Native:
75.9% (2,428)Foreign-born:
1.7% (50)
Two or more races - Speak another language Native:
26.1% (833)Foreign-born:
99.7% (2,905)
White alone - Speak only English Native:
96.6% (27,518)Foreign-born:
13.7% (287)
White alone - Speak another language Native:
3.6% (1,029)Foreign-born:
86.2% (1,802)
Hispanic or Latino - Speak only English Native:
52.8% (1,901)Foreign-born:
4.4% (161)
Hispanic or Latino - Speak another language Native:
48.4% (1,743)Foreign-born:
98.7% (3,661)
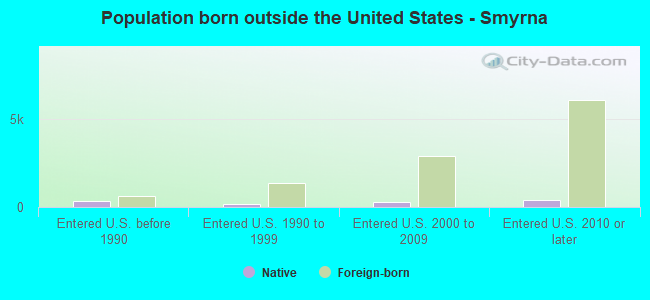
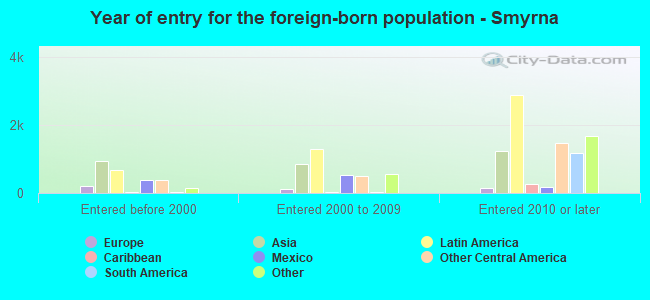
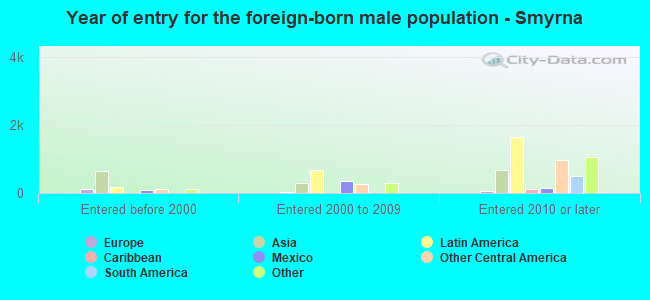
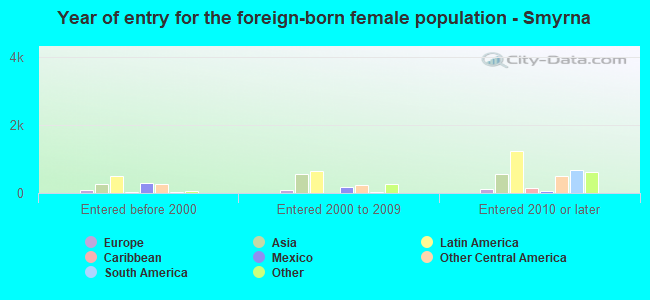
Foreign-born residents in Smyrna 7,764 residents are foreign born (6.1% Latin America , 4.2% Asia , 2.6% Africa ).
This city:
13.8%Tennessee:
5.4%
Marital status for residents in Smyrna Marital status - White (Caucasian) population 15 years and over
Males 32.8% Never married51.4% Now married0.5% Separated3.5% Widowed11.9% DivorcedFemales 23.9% Never married51.0% Now married1.1% Separated13.1% Widowed10.9% DivorcedWomen who gave birth in the past 12 months Now married:
77.5% (474)Unmarried:
22.5% (138)
Women who did not give birth in the past 12 months Now married:
50.7% (3,913)Unmarried:
49.3% (3,808)
Marital status - Black or African American population 15 years and over
Males 56.0% Never married32.3% Now married3.1% Separated2.2% Widowed6.3% DivorcedFemales 54.1% Never married26.5% Now married2.7% Separated2.7% Widowed14.1% DivorcedWomen who gave birth in the past 12 months Now married:
17.8% (50)Unmarried:
82.2% (232)
Women who did not give birth in the past 12 months Now married:
27.2% (709)Unmarried:
72.8% (1,895)
Marital status - American Indian / Alaska Native population 15 years and over
Males 69.2% Never married20.5% Now married0.0% Separated0.0% Widowed10.3% DivorcedFemales 67.6% Never married18.9% Now married0.0% Separated13.5% Widowed0.0% DivorcedWomen who did not give birth in the past 12 months Now married:
0.0% (0)Unmarried:
100.0% (29)
Marital status - Asian population 15 years and over
Males 48.1% Never married37.2% Now married0.0% Separated13.3% Widowed1.5% DivorcedFemales 32.3% Never married59.7% Now married0.0% Separated0.0% Widowed8.0% DivorcedWomen who gave birth in the past 12 months Now married:
100.0% (114)Unmarried:
0.0% (0)
Women who did not give birth in the past 12 months Now married:
35.9% (334)Unmarried:
64.1% (596)
Marital status - Other race population 15 years and over
Males 41.3% Never married44.9% Now married1.3% Separated0.0% Widowed12.4% DivorcedFemales 45.1% Never married41.6% Now married12.4% Separated0.0% Widowed1.0% DivorcedWomen who gave birth in the past 12 months Now married:
0.0% (0)Unmarried:
100.0% (8)
Women who did not give birth in the past 12 months Now married:
58.0% (337)Unmarried:
42.0% (244)
Marital status - Two or more races population 15 years and over
Males 50.8% Never married38.4% Now married0.0% Separated0.0% Widowed10.8% DivorcedFemales 57.2% Never married30.6% Now married3.1% Separated1.0% Widowed8.2% DivorcedWomen who gave birth in the past 12 months Now married:
81.0% (191)Unmarried:
19.0% (45)
Women who did not give birth in the past 12 months Now married:
21.3% (372)Unmarried:
78.7% (1,372)
Marital status - White alone, not Hispanic / Latino population 15 years and over
Males 33.2% Never married52.2% Now married0.3% Separated2.7% Widowed11.6% DivorcedFemales 23.0% Never married51.9% Now married1.1% Separated13.1% Widowed10.9% DivorcedWomen who gave birth in the past 12 months Now married:
73.8% (392)Unmarried:
26.2% (139)
Women who did not give birth in the past 12 months Now married:
51.3% (3,650)Unmarried:
48.7% (3,466)
Marital status - Hispanic or Latino population 15 years and over
Males 34.3% Never married47.8% Now married1.8% Separated5.6% Widowed10.4% DivorcedFemales 44.5% Never married41.3% Now married3.5% Separated5.7% Widowed5.0% DivorcedWomen who gave birth in the past 12 months Now married:
83.3% (217)Unmarried:
16.7% (44)
Women who did not give birth in the past 12 months Now married:
43.6% (991)Unmarried:
56.4% (1,282)
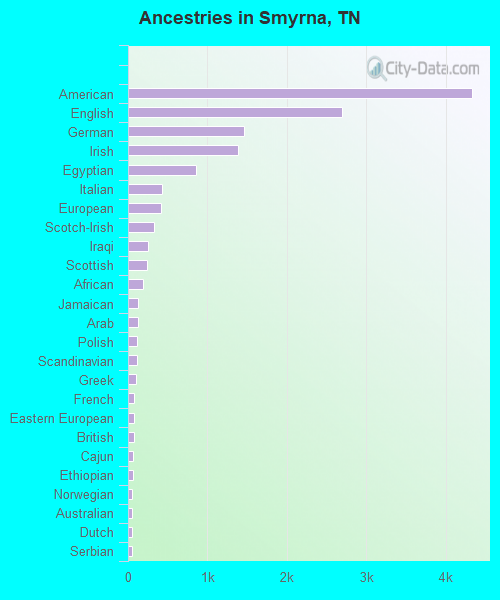
Ancestries in Smyrna
4,325 14.6% American2,691 9.1% English1,459 4.9% German1,385 4.7% Irish856 2.9% Egyptian423 1.4% Italian409 1.4% European332 1.1% Scotch-Irish256 0.9% Iraqi243 0.8% Scottish185 0.6% African131 0.4% Jamaican126 0.4% Arab118 0.4% Polish109 0.4% Scandinavian99 0.3% Greek81 0.3% French79 0.3% Eastern European76 0.3% British67 0.2% Cajun57 0.2% Ethiopian55 0.2% Norwegian52 0.2% Australian50 0.2% Dutch50 0.2% Serbian48 0.2% Swedish45 0.2% Hungarian42 0.1% Welsh41 0.1% Danish38 0.1% Ghanaian35 0.1% Trinidadian and Tobagonian31 0.1% Northern European27 0.09% Croatian21 0.07% Czech20 0.07% Ukrainian20 0.07% Slovak19 0.06% Armenian17 0.06% Russian17 0.06% Nigerian16 0.05% Romanian15 0.05% Palestinian8 0.03% Austrian7 0.02% Finnish6 0.02% Swiss
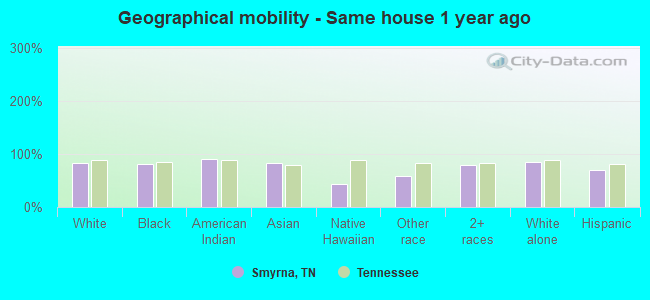
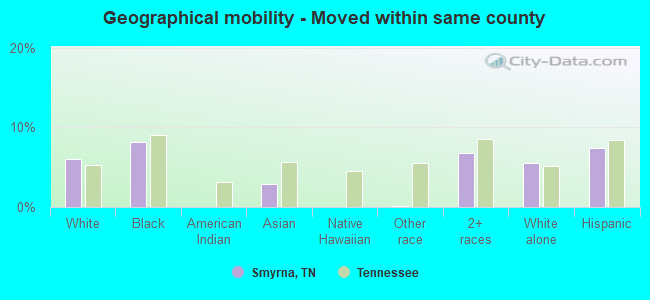
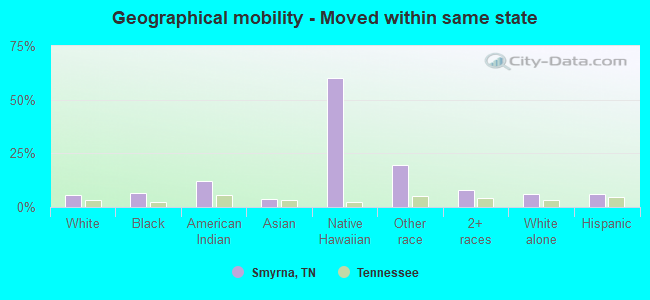
Geographical mobility in Smyrna Same house 1 year ago 28,388 83.5% White (Caucasian)7,920 82.0% Black or African American87 90.3% American Indian / Alaska Native2,792 83.6% Asian21 43.0% Native Hawaiian / Pacific Islander1,382 59.0% Other race5,187 79.7% Two or more races26,806 84.1% White alone, not Hispanic / Latino5,634 70.7% Hispanic or LatinoMoved within same county 2,063 6.1% White / Caucasian791 8.2% Black or African American98 2.9% Asian2 0.1% Other race441 6.8% Two or more races1,768 5.5% White alone, not Hispanic / Latino594 7.4% Hispanic or LatinoMoved within same state 1,899 5.6% White / Caucasian627 6.5% Black or African American12 12.3% American Indian / Alaska Native124 3.7% Asian30 60.2% Native Hawaiian / Pacific Islander453 19.3% Other race516 7.9% Two or more races1,990 6.2% White alone, not Hispanic / Latino478 6.0% Hispanic or LatinoMoved from different state 1,318 3.9% White / Caucasian129 1.3% Black or African American9 9.7% American Indian / Alaska Native265 7.9% Asian285 12.2% Other race1,029 3.2% White alone, not Hispanic / Latino556 7.0% Hispanic or LatinoMoved from abroad 151 0.4% White136 1.4% Black or African American41 1.2% Asian154 6.6% Other race114 1.8% Two or more races148 0.5% White alone, not Hispanic / Latino195 2.4% Hispanic or Latino
Children Nativity (place of birth) in Smyrna
Children under 6 years - Living with two parents Both parents native 1,467 99.4% Native8 0.6% Foreign-bornBoth parents foreign-born 540 57.6% Native397 42.4% Foreign-bornOne native, one foreign-born parent 827 100.0% NativeChildren under 6 years - Living with one parent Native parent 1,174 100.0% NativeForeign-born parent 774 100.0% NativeChildren 6 to 17 years - Living with two parents Both parents native 2,493 100.0% NativeBoth parents foreign-born 542 31.0% Native1,208 69.0% Foreign-bornOne native, one foreign-born parent 579 99.5% Native3 0.5% Foreign-bornChildren 6 to 17 years - Living with one parent Native parent 2,387 100.0% NativeForeign-born parent 1,963 58.2% Native1,410 41.8% Foreign-born
Grandparents responsible for own grandchildren in Smyrna
Grandparents (30 to 59 years) White / Caucasian 12 7.7% Responsible for grandchildren141 92.3% Not responsible for grandchildrenBlack or African American 33 26.3% Responsible for grandchildren91 73.7% Not responsible for grandchildrenAsian 118 100.0% Not responsible for grandchildrenNative Hawaiian / Pacific Islander 14 100.0% Not responsible for grandchildrenTwo or more races 65 100.0% Responsible for grandchildrenWhite alone, not Hispanic / Latino 12 8.6% Responsible for grandchildren128 91.4% Not responsible for grandchildrenGrandparents (60 years and over) White / Caucasian 64 18.4% Responsible for grandchildren286 81.6% Not responsible for grandchildrenBlack or African American 20 100.0% Not responsible for grandchildrenAsian 107 100.0% Not responsible for grandchildrenWhite alone, not Hispanic / Latino 65 22.5% Responsible for grandchildren225 77.5% Not responsible for grandchildren