Races in Soddy-Daisy, Tennessee (TN) Detailed Stats
Data:
Races - White alone (%)
Races - White alone (% change since 2000)
Races - Black alone (%)
Races - Black alone (% change since 2000)
Races - American Indian alone (%)
Races - American Indian alone (% change since 2000)
Races - Asian alone (%)
Races - Asian alone (% change since 2000)
Races - Hispanic (%)
Races - Hispanic (% change since 2000)
Races - Native Hawaiian and Other Pacific Islander alone (%)
Races - Native Hawaiian and Other Pacific Islander alone (% change since 2000)
Races - Two or more races(%)
Races - Two or more races(% change since 2000)
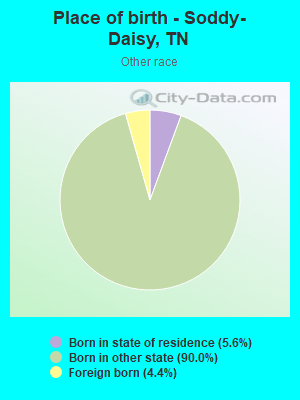
Races - Other race alone (%)
Races - Other race alone (% change since 2000)
Racial diversity
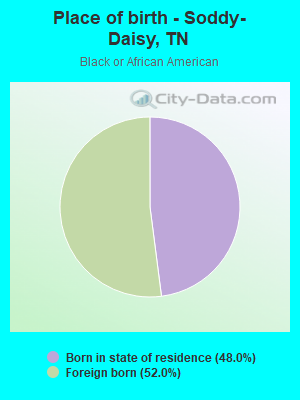
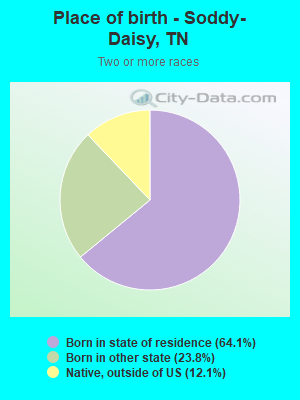
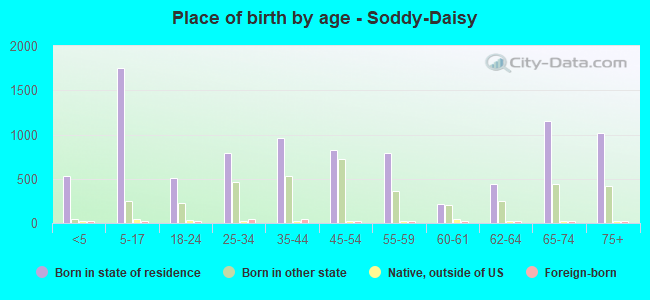
Place of birth - Born in state of residence (%)
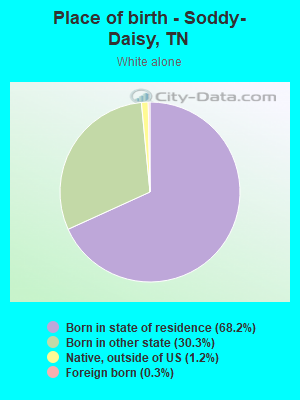
Place of birth - Born in state of residence (%) - White
Place of birth - Born in state of residence (%) - Black or African American
Place of birth - Born in state of residence (%) - Asian
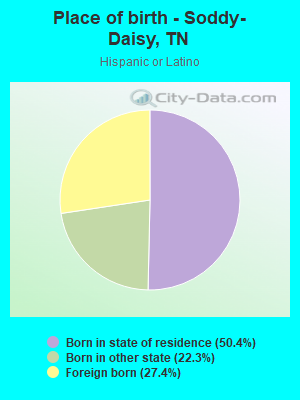
Place of birth - Born in state of residence (%) - Hispanic or Latino
Place of birth - Born in state of residence (%) - American Indian and Alaska Native
Place of birth - Born in state of residence (%) - Multirace
Place of birth - Born in state of residence (%) - Other Race
Place of birth - Born in other state (%)
Place of birth - Born in other state (%) - White
Place of birth - Born in other state (%) - Black or African American
Place of birth - Born in other state (%) - Asian
Place of birth - Born in other state (%) - Hispanic or Latino
Place of birth - Born in other state (%) - American Indian and Alaska Native
Place of birth - Born in other state (%) - Multirace
Place of birth - Born in other state (%) - Other Race
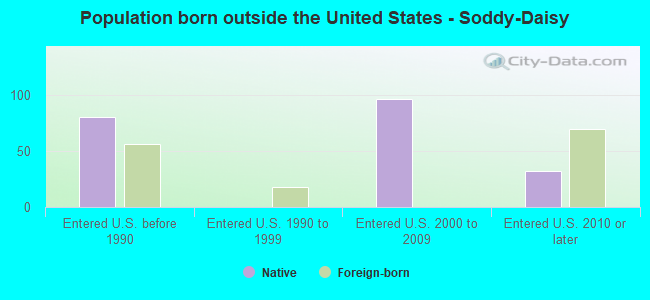
Place of birth - Native, outside of US (%)
Place of birth - Native, outside of US (%) - White
Place of birth - Native, outside of US (%) - Black or African American
Place of birth - Native, outside of US (%) - Asian
Place of birth - Native, outside of US (%) - Hispanic or Latino
Place of birth - Native, outside of US (%) - American Indian and Alaska Native
Place of birth - Native, outside of US (%) - Multirace
Place of birth - Native, outside of US (%) - Other Race
Place of birth - Foreign born (%)
Place of birth - Foreign born (%) - White
Place of birth - Foreign born (%) - Black or African American
Place of birth - Foreign born (%) - Asian
Place of birth - Foreign born (%) - Hispanic or Latino
Place of birth - Foreign born (%) - American Indian and Alaska Native
Place of birth - Foreign born (%) - Multirace
Place of birth - Foreign born (%) - Other Race
Residents speaking English at home (%)
Residents speaking English at home - Born in the United States (%)
Residents speaking English at home - Native, born elsewhere (%)
Residents speaking English at home - Foreign born (%)
Residents speaking Spanish at home (%)
Residents speaking Spanish at home - Born in the United States (%)
Residents speaking Spanish at home - Native, born elsewhere (%)
Residents speaking Spanish at home - Foreign born (%)
Residents speaking other language at home (%)
Residents speaking other language at home - Born in the United States (%)
Residents speaking other language at home - Native, born elsewhere (%)
Residents speaking other language at home - Foreign born (%)
Marital status - Never married (%)
Marital status - Now married (%)
Marital status - Separated (%)
Marital status - Widowed (%)
Marital status - Divorced (%)
Ancestries Reported - Arab (%)
Ancestries Reported - Czech (%)
Ancestries Reported - Danish (%)
Ancestries Reported - Dutch (%)
Ancestries Reported - English (%)
Ancestries Reported - French (%)
Ancestries Reported - French Canadian (%)
Ancestries Reported - German (%)
Ancestries Reported - Greek (%)
Ancestries Reported - Hungarian (%)
Ancestries Reported - Irish (%)
Ancestries Reported - Italian (%)
Ancestries Reported - Lithuanian (%)
Ancestries Reported - Norwegian (%)
Ancestries Reported - Polish (%)
Ancestries Reported - Portuguese (%)
Ancestries Reported - Russian (%)
Ancestries Reported - Scotch-Irish (%)
Ancestries Reported - Scottish (%)
Ancestries Reported - Slovak (%)
Ancestries Reported - Subsaharan African (%)
Ancestries Reported - Swedish (%)
Ancestries Reported - Swiss (%)
Ancestries Reported - Ukrainian (%)
Ancestries Reported - United States (%)
Ancestries Reported - Welsh (%)
Ancestries Reported - West Indian (%)
Ancestries Reported - Other (%)
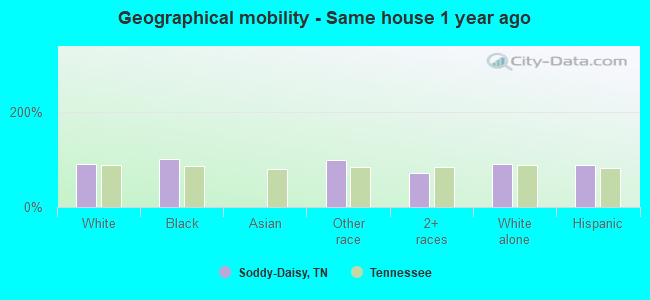
Geographical mobility - Same house 1 year ago (%)
Geographical mobility - Same house 1 year ago (%) - White
Geographical mobility - Same house 1 year ago (%) - Black or African American
Geographical mobility - Same house 1 year ago (%) - Asian
Geographical mobility - Same house 1 year ago (%) - Hispanic or Latino
Geographical mobility - Same house 1 year ago (%) - American Indian and Alaska Native
Geographical mobility - Same house 1 year ago (%) - Multirace
Geographical mobility - Same house 1 year ago (%) - Other Race
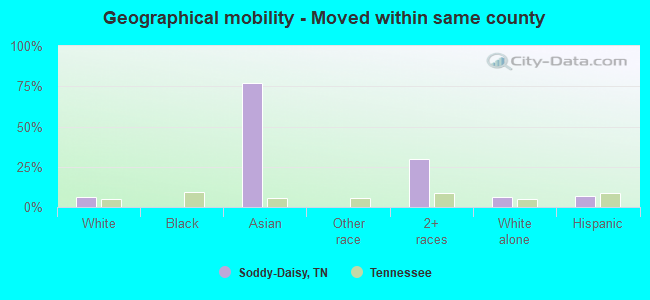
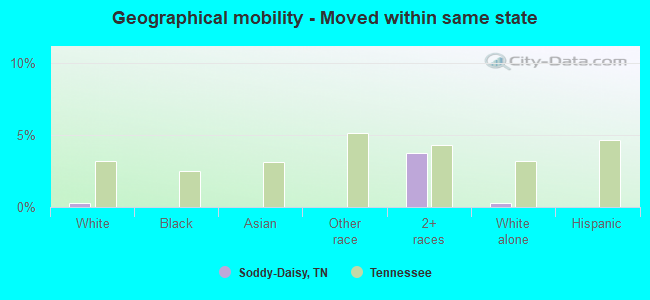
Geographical mobility - Moved within same county (%)
Geographical mobility - Moved within same county (%) - White
Geographical mobility - Moved within same county (%) - Black or African American
Geographical mobility - Moved within same county (%) - Asian
Geographical mobility - Moved within same county (%) - Hispanic or Latino
Geographical mobility - Moved within same county (%) - American Indian and Alaska Native
Geographical mobility - Moved within same county (%) - Multirace
Geographical mobility - Moved within same county (%) - Other Race
Geographical mobility - Moved from different county within same state (%)
Geographical mobility - Moved from different county within same state (%) - White
Geographical mobility - Moved from different county within same state (%) - Black or African American
Geographical mobility - Moved from different county within same state (%) - Asian
Geographical mobility - Moved from different county within same state (%) - Hispanic or Latino
Geographical mobility - Moved from different county within same state (%) - American Indian and Alaska Native
Geographical mobility - Moved from different county within same state (%) - Multirace
Geographical mobility - Moved from different county within same state (%) - Other Race
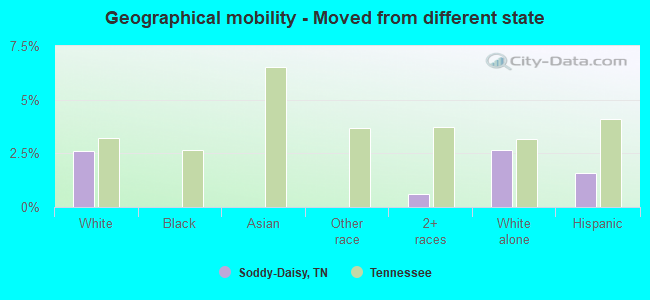
Geographical mobility - Moved from different state (%)
Geographical mobility - Moved from different state (%) - White
Geographical mobility - Moved from different state (%) - Black or African American
Geographical mobility - Moved from different state (%) - Asian
Geographical mobility - Moved from different state (%) - Hispanic or Latino
Geographical mobility - Moved from different state (%) - American Indian and Alaska Native
Geographical mobility - Moved from different state (%) - Multirace
Geographical mobility - Moved from different state (%) - Other Race
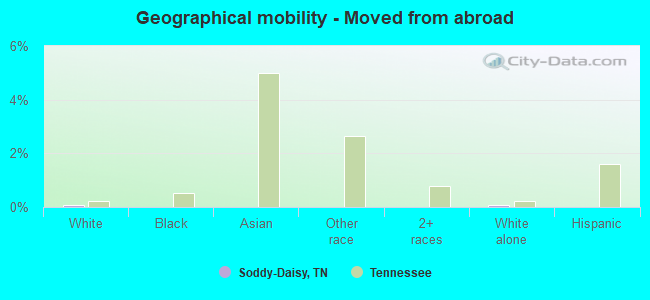
Geographical mobility - Moved from abroad (%)
Geographical mobility - Moved from abroad (%) - White
Geographical mobility - Moved from abroad (%) - Black or African American
Geographical mobility - Moved from abroad (%) - Asian
Geographical mobility - Moved from abroad (%) - Hispanic or Latino
Geographical mobility - Moved from abroad (%) - American Indian and Alaska Native
Geographical mobility - Moved from abroad (%) - Multirace
Geographical mobility - Moved from abroad (%) - Other Race
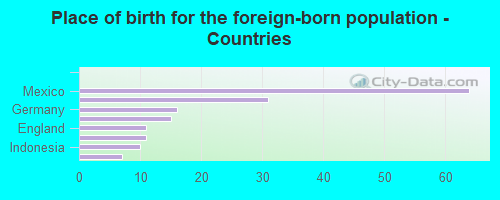
Place of birth for the foreign-born population - Ireland (%)
Place of birth for the foreign-born population - Denmark (%)
Place of birth for the foreign-born population - Norway (%)
Place of birth for the foreign-born population - Sweden (%)
Place of birth for the foreign-born population - United Kingdom (%)
Place of birth for the foreign-born population - England (%)
Place of birth for the foreign-born population - Scotland (%)
Place of birth for the foreign-born population - Other Northern Europe (%)
Place of birth for the foreign-born population - Austria (%)
Place of birth for the foreign-born population - Belgium (%)
Place of birth for the foreign-born population - France (%)
Place of birth for the foreign-born population - Germany (%)
Place of birth for the foreign-born population - Netherlands (%)
Place of birth for the foreign-born population - Switzerland (%)
Place of birth for the foreign-born population - Other Western Europe (%)
Place of birth for the foreign-born population - Greece (%)
Place of birth for the foreign-born population - Italy (%)
Place of birth for the foreign-born population - Portugal (%)
Place of birth for the foreign-born population - Spain (%)
Place of birth for the foreign-born population - Other Southern Europe (%)
Place of birth for the foreign-born population - Albania (%)
Place of birth for the foreign-born population - Belarus (%)
Place of birth for the foreign-born population - Bosnia and Herzegovina (%)
Place of birth for the foreign-born population - Bulgaria (%)
Place of birth for the foreign-born population - Croatia (%)
Place of birth for the foreign-born population - Czechoslovakia (%)
Place of birth for the foreign-born population - Hungary (%)
Place of birth for the foreign-born population - Latvia (%)
Place of birth for the foreign-born population - Lithuania (%)
Place of birth for the foreign-born population - North Macedonia (Macedonia) (%)
Place of birth for the foreign-born population - Moldova (%)
Place of birth for the foreign-born population - Poland (%)
Place of birth for the foreign-born population - Romania (%)
Place of birth for the foreign-born population - Russia (%)
Place of birth for the foreign-born population - Serbia (%)
Place of birth for the foreign-born population - Ukraine (%)
Place of birth for the foreign-born population - Other Eastern Europe (%)
Place of birth for the foreign-born population - China (%)
Place of birth for the foreign-born population - Hong Kong (%)
Place of birth for the foreign-born population - Taiwan (%)
Place of birth for the foreign-born population - Japan (%)
Place of birth for the foreign-born population - Korea (%)
Place of birth for the foreign-born population - Other Eastern Asia (%)
Place of birth for the foreign-born population - Afghanistan (%)
Place of birth for the foreign-born population - Bangladesh (%)
Place of birth for the foreign-born population - India (%)
Place of birth for the foreign-born population - Iran (%)
Place of birth for the foreign-born population - Kazakhstan (%)
Place of birth for the foreign-born population - Nepal (%)
Place of birth for the foreign-born population - Pakistan (%)
Place of birth for the foreign-born population - Sri Lanka (%)
Place of birth for the foreign-born population - Uzbekistan (%)
Place of birth for the foreign-born population - Other South Central Asia (%)
Place of birth for the foreign-born population - Burma (%)
Place of birth for the foreign-born population - Cambodia (%)
Place of birth for the foreign-born population - Indonesia (%)
Place of birth for the foreign-born population - Laos (%)
Place of birth for the foreign-born population - Malaysia (%)
Place of birth for the foreign-born population - Philippines (%)
Place of birth for the foreign-born population - Singapore (%)
Place of birth for the foreign-born population - Thailand (%)
Place of birth for the foreign-born population - Vietnam (%)
Place of birth for the foreign-born population - Other South Eastern Asia (%)
Place of birth for the foreign-born population - Armenia (%)
Place of birth for the foreign-born population - Iraq (%)
Place of birth for the foreign-born population - Israel (%)
Place of birth for the foreign-born population - Jordan (%)
Place of birth for the foreign-born population - Kuwait (%)
Place of birth for the foreign-born population - Lebanon (%)
Place of birth for the foreign-born population - Saudi Arabia (%)
Place of birth for the foreign-born population - Syria (%)
Place of birth for the foreign-born population - Turkey (%)
Place of birth for the foreign-born population - Yemen (%)
Place of birth for the foreign-born population - Other Western Asia (%)
Place of birth for the foreign-born population - Eritrea (%)
Place of birth for the foreign-born population - Ethiopia (%)
Place of birth for the foreign-born population - Kenya (%)
Place of birth for the foreign-born population - Somalia (%)
Place of birth for the foreign-born population - Uganda (%)
Place of birth for the foreign-born population - Zimbabwe (%)
Place of birth for the foreign-born population - Other Eastern Africa (%)
Place of birth for the foreign-born population - Cameroon (%)
Place of birth for the foreign-born population - Congo (%)
Place of birth for the foreign-born population - Democratic Republic of Congo (Zaire) (%)
Place of birth for the foreign-born population - Other Middle Africa (%)
Place of birth for the foreign-born population - Egypt (%)
Place of birth for the foreign-born population - Morocco (%)
Place of birth for the foreign-born population - Sudan (%)
Place of birth for the foreign-born population - Other Northern Africa (%)
Place of birth for the foreign-born population - South Africa (%)
Place of birth for the foreign-born population - Other Southern Africa (%)
Place of birth for the foreign-born population - Cabo Verde (%)
Place of birth for the foreign-born population - Ghana (%)
Place of birth for the foreign-born population - Liberia (%)
Place of birth for the foreign-born population - Nigeria (%)
Place of birth for the foreign-born population - Senegal (%)
Place of birth for the foreign-born population - Sierra Leone (%)
Place of birth for the foreign-born population - Other Western Africa (%)
Place of birth for the foreign-born population - Australia (%)
Place of birth for the foreign-born population - New Zealand (%)
Place of birth for the foreign-born population - Fiji (%)
Place of birth for the foreign-born population - Micronesia (%)
Place of birth for the foreign-born population - Bahamas (%)
Place of birth for the foreign-born population - Barbados (%)
Place of birth for the foreign-born population - Cuba (%)
Place of birth for the foreign-born population - Dominica (%)
Place of birth for the foreign-born population - Dominican Republic (%)
Place of birth for the foreign-born population - Grenada (%)
Place of birth for the foreign-born population - Haiti (%)
Place of birth for the foreign-born population - Jamaica (%)
Place of birth for the foreign-born population - St. Vincent and the Grenadines (%)
Place of birth for the foreign-born population - Trinidad and Tobago (%)
Place of birth for the foreign-born population - West Indies (%)
Place of birth for the foreign-born population - Other Caribbean (%)
Place of birth for the foreign-born population - Belize (%)
Place of birth for the foreign-born population - Costa Rica (%)
Place of birth for the foreign-born population - El Salvador (%)
Place of birth for the foreign-born population - Guatemala (%)
Place of birth for the foreign-born population - Honduras (%)
Place of birth for the foreign-born population - Mexico (%)
Place of birth for the foreign-born population - Nicaragua (%)
Place of birth for the foreign-born population - Panama (%)
Place of birth for the foreign-born population - Other Central America (%)
Place of birth for the foreign-born population - Argentina (%)
Place of birth for the foreign-born population - Bolivia (%)
Place of birth for the foreign-born population - Brazil (%)
Place of birth for the foreign-born population - Chile (%)
Place of birth for the foreign-born population - Colombia (%)
Place of birth for the foreign-born population - Ecuador (%)
Place of birth for the foreign-born population - Guyana (%)
Place of birth for the foreign-born population - Peru (%)
Place of birth for the foreign-born population - Uruguay (%)
Place of birth for the foreign-born population - Venezuela (%)
Place of birth for the foreign-born population - Other South America (%)
Place of birth for the foreign-born population - Canada (%)
Place of birth for the foreign-born population - Other Northern America (%)
Place of birth for the foreign-born population - Other (%)
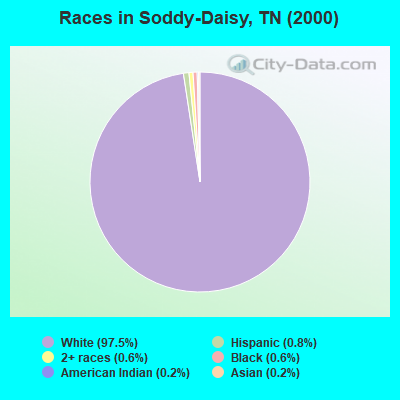
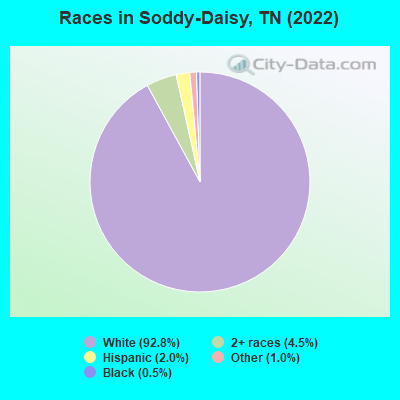
According to 2022 data, the most numerous races in Soddy-Daisy, TN are White alone (12,396 residents), Black alone (72 residents), and Hispanic (266 residents). 99.3% of Soddy-Daisy residents speak English at home. 1.3% of Soddy-Daisy, TN residents are foreign-born , which is 295.2% less than the foreign-born rate of 5.0% across the entire state of Tennessee.
Race distribution in Soddy-Daisy
2000 2022
4,505,930 79.2% White alone 928,204 16.3% Black alone 123,838 2.2% Hispanic 54,824 1.0% Two or more races 56,077 1.0% Asian alone 13,820 0.2% American Indian alone 4,780 0.08% Other race alone 1,810 0.03% Native Hawaiian and Other
5,070,026 71.9% White alone 1,089,738 15.5% Black alone 442,629 6.3% Hispanic 279,381 4.0% Two or more races 131,817 1.9% Asian alone 26,972 0.4% Other race alone 6,387 0.09% American Indian alone 4,389 0.06% Native Hawaiian and Other
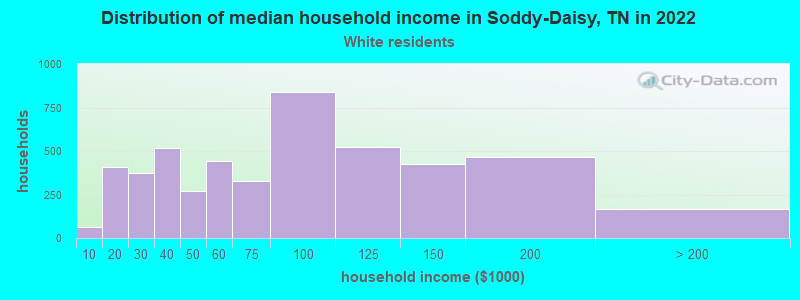
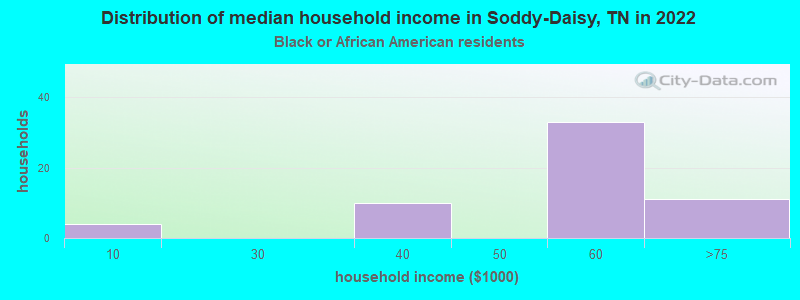
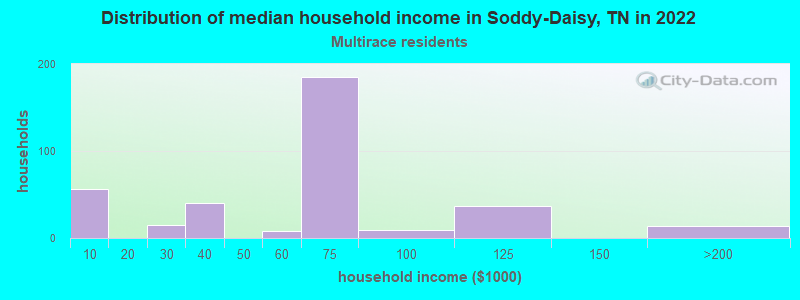
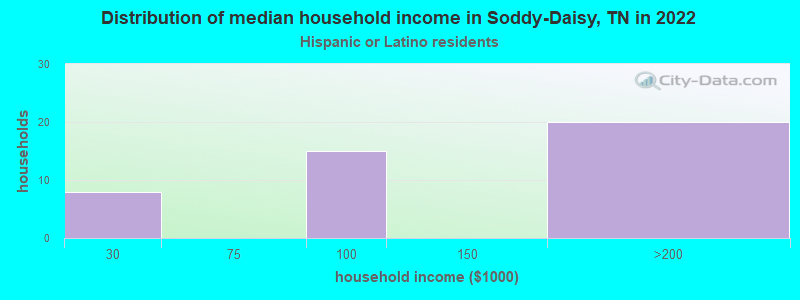
Income and house value in Soddy-Daisy Median household income in 2022 $71,573 White non-Hispanic householders$58,358 Black householders$79,234 Two or more races householdersMedian 2022 house value $271,420 White Non-Hispanic householders$244,376 Black or African American householders$366,564 American Indian or Alaska Native householders$211,792 Two or more races householders$448,023 Hispanic or Latino householders
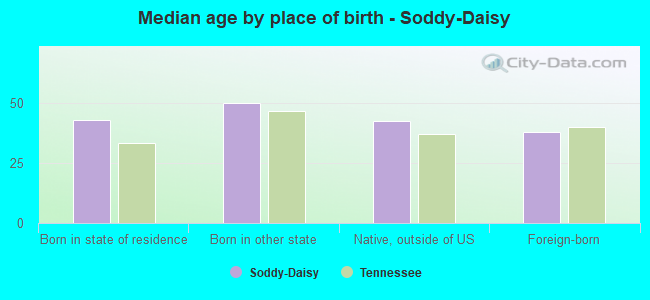
Median age by race in Soddy-Daisy
46.5 Median age for White residents46.2 46.8 75.3 Median age for Black or African American residents60.2 -710,875,330.9 -764,227,641.5 Median age for American Indian / Alaska Native residents-639,691,714.2 -773,049,644.6 -704,273,503.6 Median age for Asian residents-637,442,921.7 -780,284,042.7 -963,888,887.9 Median age for Native Hawaiian / Pacific Islander residents-951,707,890.7 -735,930,735.2 20.0 Median age for Other race residents15.9 62.7 34.6 Median age for Two or more races residents42.3 29.7 46.6 Median age for White alone residents46.1 46.7 20.7 Median age for Hispanic or Latino residents34.5 20.7
Owner/renter occupied households by race in Soddy-Daisy
House owners and renters - White residents 3,830 77.9% Owner occupied1,088 22.1% Renter occupiedHouse owners and renters - Black or African American residents 78 100.0% Owner occupiedHouse owners and renters - Asian residents 10 100.0% Owner occupiedHouse owners and renters - Other race residents 37 100.0% Owner occupiedHouse owners and renters - Two or more races residents 127 49.3% Owner occupied130 50.7% Renter occupiedHouse owners and renters - White alone residents 3,777 77.7% Owner occupied1,085 22.3% Renter occupiedHouse owners and renters - Hispanic or Latino residents 48 80.3% Owner occupied12 19.7% Renter occupied
Language usage in Soddy-Daisy
English speakers - Total 99.3% of residents of Soddy-Daisy speak English at home.
0.6% of residents speak Spanish at home 31 40.8% Speak English very well45 59.2% Speak English less than very well0.1% of residents speak other language at home 18 100.0% Speak English very well
English speakers - Born in the United States 99.9% of residents of Soddy-Daisy speak English at home.
0.3% of residents speak Spanish at home 6 46.2% Speak English very well7 53.8% Speak English less than very well
All residents speak only English at home
English speakers - Foreign-born 75.3% of residents of Soddy-Daisy speak English at home.
15.8% of residents speak Spanish at home 25 100.0% Speak English less than very well5.1% of residents speak other language at home 8 100.0% Speak English very well
White (Caucasian) - Speak only English Native:
100.0% (11,905)Foreign-born:
86.4% (80)
White (Caucasian) - Speak another language Native:
0.3% (38)Foreign-born:
16.8% (16)
Black or African American - Speak only English Native:
99.9% (31)Foreign-born:
100.0% (46)
Other race - Speak another language Native:
8.2% (15)Foreign-born:
100.0% (9)
White alone - Speak only English Native:
99.5% (11,796)Foreign-born:
100.0% (39)
Hispanic or Latino - Speak only English Native:
87.7% (134)Foreign-born:
29.9% (23)
Hispanic or Latino - Speak another language Native:
16.4% (25)Foreign-born:
36.2% (28)
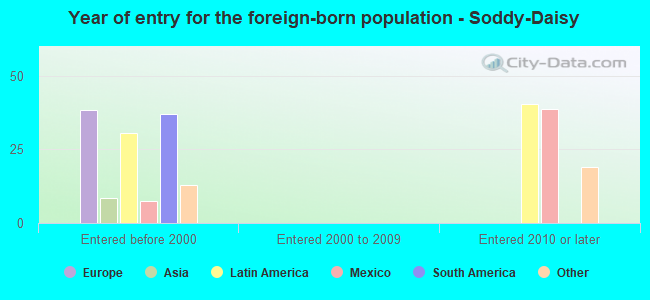
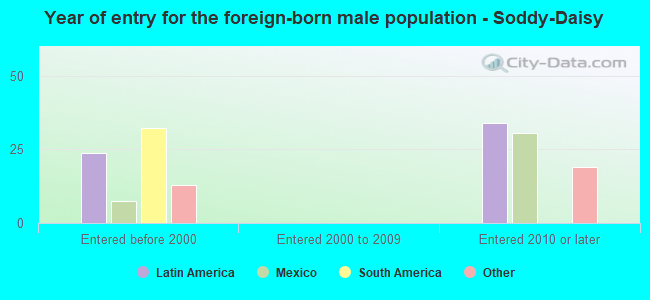
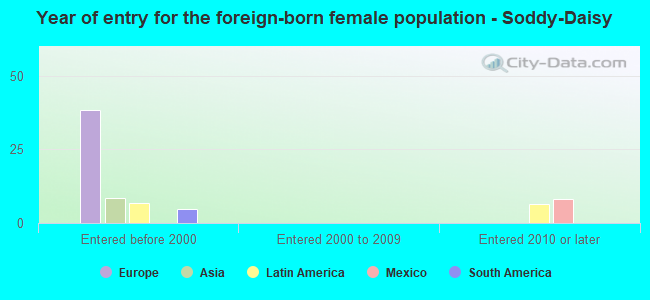
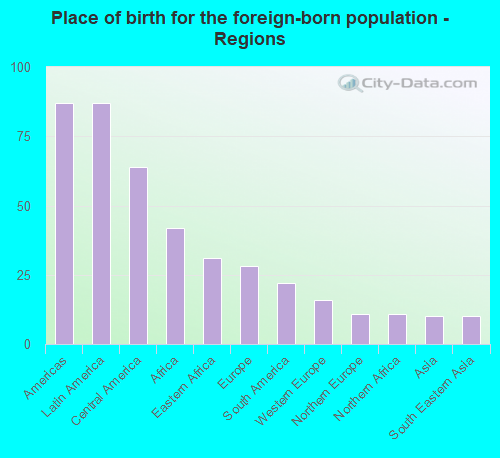
Foreign-born residents in Soddy-Daisy 169 residents are foreign born
This city:
1.3%Tennessee:
5.4%
Marital status for residents in Soddy-Daisy Marital status - White (Caucasian) population 15 years and over
Males 23.8% Never married51.2% Now married1.4% Separated5.8% Widowed17.7% DivorcedFemales 17.4% Never married51.5% Now married2.6% Separated14.1% Widowed14.4% DivorcedWomen who gave birth in the past 12 months Now married:
92.1% (234)Unmarried:
7.9% (20)
Women who did not give birth in the past 12 months Now married:
47.6% (1,116)Unmarried:
52.4% (1,228)
Marital status - Black or African American population 15 years and over
Males 0.0% Never married64.6% Now married0.0% Separated23.1% Widowed12.3% DivorcedFemales 0.0% Never married100.0% Now married0.0% Separated0.0% Widowed0.0% DivorcedMarital status - Other race population 15 years and over
Males 75.6% Never married24.4% Now married0.0% Separated0.0% Widowed0.0% DivorcedFemales 0.0% Never married74.1% Now married0.0% Separated0.0% Widowed25.9% DivorcedWomen who did not give birth in the past 12 months Now married:
74.1% (27)Unmarried:
25.9% (9)
Marital status - Two or more races population 15 years and over
Males 42.9% Never married31.0% Now married0.0% Separated0.0% Widowed26.2% DivorcedFemales 16.9% Never married50.0% Now married0.0% Separated7.7% Widowed25.4% DivorcedWomen who did not give birth in the past 12 months Now married:
18.3% (15)Unmarried:
81.7% (67)
Marital status - White alone, not Hispanic / Latino population 15 years and over
Males 24.0% Never married50.6% Now married1.4% Separated5.9% Widowed18.0% DivorcedFemales 17.0% Never married51.7% Now married2.7% Separated14.2% Widowed14.5% DivorcedWomen who gave birth in the past 12 months Now married:
92.1% (234)Unmarried:
7.9% (20)
Women who did not give birth in the past 12 months Now married:
47.9% (1,113)Unmarried:
52.1% (1,210)
Marital status - Hispanic or Latino population 15 years and over
Males 12.5% Never married87.5% Now married0.0% Separated0.0% Widowed0.0% DivorcedFemales 42.3% Never married44.2% Now married0.0% Separated0.0% Widowed13.5% DivorcedWomen who did not give birth in the past 12 months Now married:
19.4% (8)Unmarried:
80.6% (34)
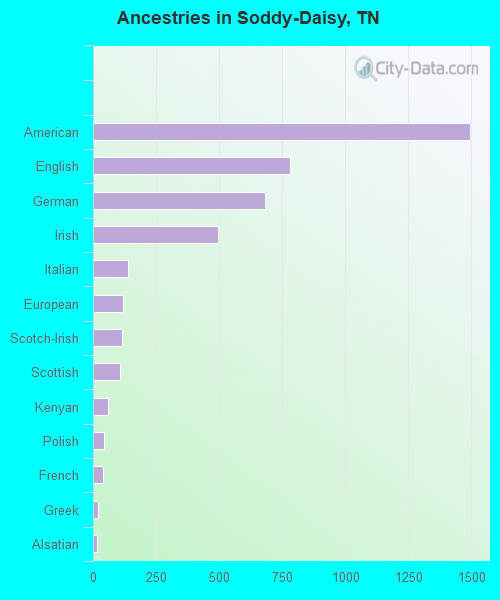
Ancestries in Soddy-Daisy
1,495 29.2% American782 15.3% English682 13.3% German497 9.7% Irish140 2.7% Italian120 2.3% European115 2.2% Scotch-Irish109 2.1% Scottish59 1.2% Kenyan42 0.8% Polish40 0.8% French19 0.4% Greek14 0.3% Alsatian11 0.2% Brazilian10 0.2% Dutch9 0.2% Egyptian9 0.2% Czech9 0.2% Swedish5 0.10% Welsh
Children Nativity (place of birth) in Soddy-Daisy
Children under 6 years - Living with two parents Both parents native 456 100.0% NativeBoth parents foreign-born 34 100.0% NativeOne native, one foreign-born parent 3 100.0% NativeChildren under 6 years - Living with one parent Native parent 134 100.0% Native
Children 6 to 17 years - Living with two parents Both parents native 1,102 100.0% NativeBoth parents foreign-born 11 100.0% NativeOne native, one foreign-born parent 115 100.0% NativeChildren 6 to 17 years - Living with one parent Native parent 616 100.0% Native
Grandparents responsible for own grandchildren in Soddy-Daisy
Grandparents (30 to 59 years) White / Caucasian 15 50.3% Responsible for grandchildren15 49.7% Not responsible for grandchildrenWhite alone, not Hispanic / Latino 13 49.2% Responsible for grandchildren14 50.8% Not responsible for grandchildrenHispanic or Latino 7 100.0% Not responsible for grandchildrenGrandparents (60 years and over) White / Caucasian 128 51.7% Responsible for grandchildren120 48.3% Not responsible for grandchildrenWhite alone, not Hispanic / Latino 128 51.7% Responsible for grandchildren120 48.3% Not responsible for grandchildren