Races in Solon, Ohio (OH) Detailed Stats
Data:
Races - White alone (%)
Races - White alone (% change since 2000)
Races - Black alone (%)
Races - Black alone (% change since 2000)
Races - American Indian alone (%)
Races - American Indian alone (% change since 2000)
Races - Asian alone (%)
Races - Asian alone (% change since 2000)
Races - Hispanic (%)
Races - Hispanic (% change since 2000)
Races - Native Hawaiian and Other Pacific Islander alone (%)
Races - Native Hawaiian and Other Pacific Islander alone (% change since 2000)
Races - Two or more races(%)
Races - Two or more races(% change since 2000)
Races - Other race alone (%)
Races - Other race alone (% change since 2000)
Racial diversity
Place of birth - Born in state of residence (%)
Place of birth - Born in state of residence (%) - White
Place of birth - Born in state of residence (%) - Black or African American
Place of birth - Born in state of residence (%) - Asian
Place of birth - Born in state of residence (%) - Hispanic or Latino
Place of birth - Born in state of residence (%) - American Indian and Alaska Native
Place of birth - Born in state of residence (%) - Multirace
Place of birth - Born in state of residence (%) - Other Race
Place of birth - Born in other state (%)
Place of birth - Born in other state (%) - White
Place of birth - Born in other state (%) - Black or African American
Place of birth - Born in other state (%) - Asian
Place of birth - Born in other state (%) - Hispanic or Latino
Place of birth - Born in other state (%) - American Indian and Alaska Native
Place of birth - Born in other state (%) - Multirace
Place of birth - Born in other state (%) - Other Race
Place of birth - Native, outside of US (%)
Place of birth - Native, outside of US (%) - White
Place of birth - Native, outside of US (%) - Black or African American
Place of birth - Native, outside of US (%) - Asian
Place of birth - Native, outside of US (%) - Hispanic or Latino
Place of birth - Native, outside of US (%) - American Indian and Alaska Native
Place of birth - Native, outside of US (%) - Multirace
Place of birth - Native, outside of US (%) - Other Race
Place of birth - Foreign born (%)
Place of birth - Foreign born (%) - White
Place of birth - Foreign born (%) - Black or African American
Place of birth - Foreign born (%) - Asian
Place of birth - Foreign born (%) - Hispanic or Latino
Place of birth - Foreign born (%) - American Indian and Alaska Native
Place of birth - Foreign born (%) - Multirace
Place of birth - Foreign born (%) - Other Race
Residents speaking English at home (%)
Residents speaking English at home - Born in the United States (%)
Residents speaking English at home - Native, born elsewhere (%)
Residents speaking English at home - Foreign born (%)
Residents speaking Spanish at home (%)
Residents speaking Spanish at home - Born in the United States (%)
Residents speaking Spanish at home - Native, born elsewhere (%)
Residents speaking Spanish at home - Foreign born (%)
Residents speaking other language at home (%)
Residents speaking other language at home - Born in the United States (%)
Residents speaking other language at home - Native, born elsewhere (%)
Residents speaking other language at home - Foreign born (%)
Marital status - Never married (%)
Marital status - Now married (%)
Marital status - Separated (%)
Marital status - Widowed (%)
Marital status - Divorced (%)
Ancestries Reported - Arab (%)
Ancestries Reported - Czech (%)
Ancestries Reported - Danish (%)
Ancestries Reported - Dutch (%)
Ancestries Reported - English (%)
Ancestries Reported - French (%)
Ancestries Reported - French Canadian (%)
Ancestries Reported - German (%)
Ancestries Reported - Greek (%)
Ancestries Reported - Hungarian (%)
Ancestries Reported - Irish (%)
Ancestries Reported - Italian (%)
Ancestries Reported - Lithuanian (%)
Ancestries Reported - Norwegian (%)
Ancestries Reported - Polish (%)
Ancestries Reported - Portuguese (%)
Ancestries Reported - Russian (%)
Ancestries Reported - Scotch-Irish (%)
Ancestries Reported - Scottish (%)
Ancestries Reported - Slovak (%)
Ancestries Reported - Subsaharan African (%)
Ancestries Reported - Swedish (%)
Ancestries Reported - Swiss (%)
Ancestries Reported - Ukrainian (%)
Ancestries Reported - United States (%)
Ancestries Reported - Welsh (%)
Ancestries Reported - West Indian (%)
Ancestries Reported - Other (%)
Geographical mobility - Same house 1 year ago (%)
Geographical mobility - Same house 1 year ago (%) - White
Geographical mobility - Same house 1 year ago (%) - Black or African American
Geographical mobility - Same house 1 year ago (%) - Asian
Geographical mobility - Same house 1 year ago (%) - Hispanic or Latino
Geographical mobility - Same house 1 year ago (%) - American Indian and Alaska Native
Geographical mobility - Same house 1 year ago (%) - Multirace
Geographical mobility - Same house 1 year ago (%) - Other Race
Geographical mobility - Moved within same county (%)
Geographical mobility - Moved within same county (%) - White
Geographical mobility - Moved within same county (%) - Black or African American
Geographical mobility - Moved within same county (%) - Asian
Geographical mobility - Moved within same county (%) - Hispanic or Latino
Geographical mobility - Moved within same county (%) - American Indian and Alaska Native
Geographical mobility - Moved within same county (%) - Multirace
Geographical mobility - Moved within same county (%) - Other Race
Geographical mobility - Moved from different county within same state (%)
Geographical mobility - Moved from different county within same state (%) - White
Geographical mobility - Moved from different county within same state (%) - Black or African American
Geographical mobility - Moved from different county within same state (%) - Asian
Geographical mobility - Moved from different county within same state (%) - Hispanic or Latino
Geographical mobility - Moved from different county within same state (%) - American Indian and Alaska Native
Geographical mobility - Moved from different county within same state (%) - Multirace
Geographical mobility - Moved from different county within same state (%) - Other Race
Geographical mobility - Moved from different state (%)
Geographical mobility - Moved from different state (%) - White
Geographical mobility - Moved from different state (%) - Black or African American
Geographical mobility - Moved from different state (%) - Asian
Geographical mobility - Moved from different state (%) - Hispanic or Latino
Geographical mobility - Moved from different state (%) - American Indian and Alaska Native
Geographical mobility - Moved from different state (%) - Multirace
Geographical mobility - Moved from different state (%) - Other Race
Geographical mobility - Moved from abroad (%)
Geographical mobility - Moved from abroad (%) - White
Geographical mobility - Moved from abroad (%) - Black or African American
Geographical mobility - Moved from abroad (%) - Asian
Geographical mobility - Moved from abroad (%) - Hispanic or Latino
Geographical mobility - Moved from abroad (%) - American Indian and Alaska Native
Geographical mobility - Moved from abroad (%) - Multirace
Geographical mobility - Moved from abroad (%) - Other Race
Place of birth for the foreign-born population - Ireland (%)
Place of birth for the foreign-born population - Denmark (%)
Place of birth for the foreign-born population - Norway (%)
Place of birth for the foreign-born population - Sweden (%)
Place of birth for the foreign-born population - United Kingdom (%)
Place of birth for the foreign-born population - England (%)
Place of birth for the foreign-born population - Scotland (%)
Place of birth for the foreign-born population - Other Northern Europe (%)
Place of birth for the foreign-born population - Austria (%)
Place of birth for the foreign-born population - Belgium (%)
Place of birth for the foreign-born population - France (%)
Place of birth for the foreign-born population - Germany (%)
Place of birth for the foreign-born population - Netherlands (%)
Place of birth for the foreign-born population - Switzerland (%)
Place of birth for the foreign-born population - Other Western Europe (%)
Place of birth for the foreign-born population - Greece (%)
Place of birth for the foreign-born population - Italy (%)
Place of birth for the foreign-born population - Portugal (%)
Place of birth for the foreign-born population - Spain (%)
Place of birth for the foreign-born population - Other Southern Europe (%)
Place of birth for the foreign-born population - Albania (%)
Place of birth for the foreign-born population - Belarus (%)
Place of birth for the foreign-born population - Bosnia and Herzegovina (%)
Place of birth for the foreign-born population - Bulgaria (%)
Place of birth for the foreign-born population - Croatia (%)
Place of birth for the foreign-born population - Czechoslovakia (%)
Place of birth for the foreign-born population - Hungary (%)
Place of birth for the foreign-born population - Latvia (%)
Place of birth for the foreign-born population - Lithuania (%)
Place of birth for the foreign-born population - North Macedonia (Macedonia) (%)
Place of birth for the foreign-born population - Moldova (%)
Place of birth for the foreign-born population - Poland (%)
Place of birth for the foreign-born population - Romania (%)
Place of birth for the foreign-born population - Russia (%)
Place of birth for the foreign-born population - Serbia (%)
Place of birth for the foreign-born population - Ukraine (%)
Place of birth for the foreign-born population - Other Eastern Europe (%)
Place of birth for the foreign-born population - China (%)
Place of birth for the foreign-born population - Hong Kong (%)
Place of birth for the foreign-born population - Taiwan (%)
Place of birth for the foreign-born population - Japan (%)
Place of birth for the foreign-born population - Korea (%)
Place of birth for the foreign-born population - Other Eastern Asia (%)
Place of birth for the foreign-born population - Afghanistan (%)
Place of birth for the foreign-born population - Bangladesh (%)
Place of birth for the foreign-born population - India (%)
Place of birth for the foreign-born population - Iran (%)
Place of birth for the foreign-born population - Kazakhstan (%)
Place of birth for the foreign-born population - Nepal (%)
Place of birth for the foreign-born population - Pakistan (%)
Place of birth for the foreign-born population - Sri Lanka (%)
Place of birth for the foreign-born population - Uzbekistan (%)
Place of birth for the foreign-born population - Other South Central Asia (%)
Place of birth for the foreign-born population - Burma (%)
Place of birth for the foreign-born population - Cambodia (%)
Place of birth for the foreign-born population - Indonesia (%)
Place of birth for the foreign-born population - Laos (%)
Place of birth for the foreign-born population - Malaysia (%)
Place of birth for the foreign-born population - Philippines (%)
Place of birth for the foreign-born population - Singapore (%)
Place of birth for the foreign-born population - Thailand (%)
Place of birth for the foreign-born population - Vietnam (%)
Place of birth for the foreign-born population - Other South Eastern Asia (%)
Place of birth for the foreign-born population - Armenia (%)
Place of birth for the foreign-born population - Iraq (%)
Place of birth for the foreign-born population - Israel (%)
Place of birth for the foreign-born population - Jordan (%)
Place of birth for the foreign-born population - Kuwait (%)
Place of birth for the foreign-born population - Lebanon (%)
Place of birth for the foreign-born population - Saudi Arabia (%)
Place of birth for the foreign-born population - Syria (%)
Place of birth for the foreign-born population - Turkey (%)
Place of birth for the foreign-born population - Yemen (%)
Place of birth for the foreign-born population - Other Western Asia (%)
Place of birth for the foreign-born population - Eritrea (%)
Place of birth for the foreign-born population - Ethiopia (%)
Place of birth for the foreign-born population - Kenya (%)
Place of birth for the foreign-born population - Somalia (%)
Place of birth for the foreign-born population - Uganda (%)
Place of birth for the foreign-born population - Zimbabwe (%)
Place of birth for the foreign-born population - Other Eastern Africa (%)
Place of birth for the foreign-born population - Cameroon (%)
Place of birth for the foreign-born population - Congo (%)
Place of birth for the foreign-born population - Democratic Republic of Congo (Zaire) (%)
Place of birth for the foreign-born population - Other Middle Africa (%)
Place of birth for the foreign-born population - Egypt (%)
Place of birth for the foreign-born population - Morocco (%)
Place of birth for the foreign-born population - Sudan (%)
Place of birth for the foreign-born population - Other Northern Africa (%)
Place of birth for the foreign-born population - South Africa (%)
Place of birth for the foreign-born population - Other Southern Africa (%)
Place of birth for the foreign-born population - Cabo Verde (%)
Place of birth for the foreign-born population - Ghana (%)
Place of birth for the foreign-born population - Liberia (%)
Place of birth for the foreign-born population - Nigeria (%)
Place of birth for the foreign-born population - Senegal (%)
Place of birth for the foreign-born population - Sierra Leone (%)
Place of birth for the foreign-born population - Other Western Africa (%)
Place of birth for the foreign-born population - Australia (%)
Place of birth for the foreign-born population - New Zealand (%)
Place of birth for the foreign-born population - Fiji (%)
Place of birth for the foreign-born population - Micronesia (%)
Place of birth for the foreign-born population - Bahamas (%)
Place of birth for the foreign-born population - Barbados (%)
Place of birth for the foreign-born population - Cuba (%)
Place of birth for the foreign-born population - Dominica (%)
Place of birth for the foreign-born population - Dominican Republic (%)
Place of birth for the foreign-born population - Grenada (%)
Place of birth for the foreign-born population - Haiti (%)
Place of birth for the foreign-born population - Jamaica (%)
Place of birth for the foreign-born population - St. Vincent and the Grenadines (%)
Place of birth for the foreign-born population - Trinidad and Tobago (%)
Place of birth for the foreign-born population - West Indies (%)
Place of birth for the foreign-born population - Other Caribbean (%)
Place of birth for the foreign-born population - Belize (%)
Place of birth for the foreign-born population - Costa Rica (%)
Place of birth for the foreign-born population - El Salvador (%)
Place of birth for the foreign-born population - Guatemala (%)
Place of birth for the foreign-born population - Honduras (%)
Place of birth for the foreign-born population - Mexico (%)
Place of birth for the foreign-born population - Nicaragua (%)
Place of birth for the foreign-born population - Panama (%)
Place of birth for the foreign-born population - Other Central America (%)
Place of birth for the foreign-born population - Argentina (%)
Place of birth for the foreign-born population - Bolivia (%)
Place of birth for the foreign-born population - Brazil (%)
Place of birth for the foreign-born population - Chile (%)
Place of birth for the foreign-born population - Colombia (%)
Place of birth for the foreign-born population - Ecuador (%)
Place of birth for the foreign-born population - Guyana (%)
Place of birth for the foreign-born population - Peru (%)
Place of birth for the foreign-born population - Uruguay (%)
Place of birth for the foreign-born population - Venezuela (%)
Place of birth for the foreign-born population - Other South America (%)
Place of birth for the foreign-born population - Canada (%)
Place of birth for the foreign-born population - Other Northern America (%)
Place of birth for the foreign-born population - Other (%)
Latest news about races in Solon, OH collected exclusively by city-data.com from local newspapers, TV, and radio stations
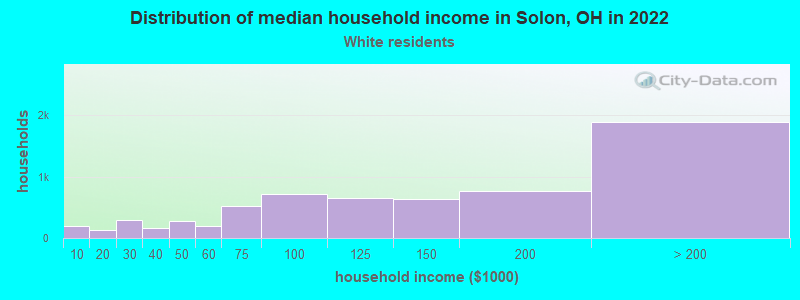
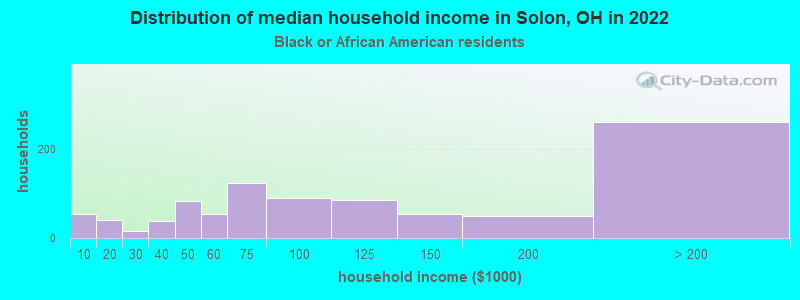
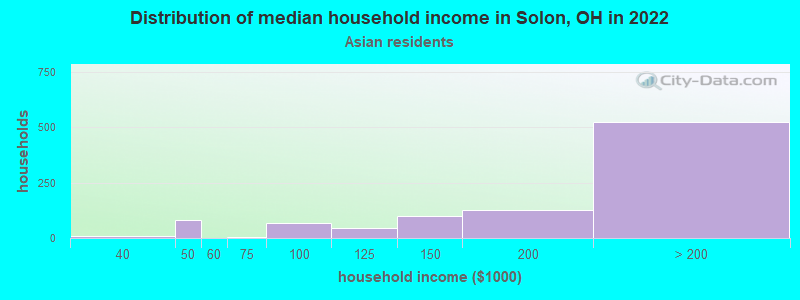
According to 2022 data, the most numerous races in Solon, OH are White alone (15,198 residents), Black alone (2,694 residents), and Two or more races (1,301 residents). 76.2% of Solon residents speak English at home. 19.4% of Solon, OH residents are foreign-born (11.9% born in Asia, 3.5% born in Europe), which is 79.4% greater than the foreign-born rate of 4.0% across the entire state of Ohio.
Race distribution in Solon
2000 2022
9,538,111 84.0% White alone 1,290,662 11.4% Black alone 217,123 1.9% Hispanic 137,770 1.2% Two or more races 131,670 1.2% Asian alone 21,985 0.2% American Indian alone 13,483 0.1% Other race alone 2,336 0.02% Native Hawaiian and Other
8,948,793 76.1% White alone 1,401,403 11.9% Black alone 529,291 4.5% Two or more races 517,232 4.4% Hispanic 293,387 2.5% Asian alone 52,805 0.4% Other race alone 9,785 0.08% American Indian alone 3,362 0.03% Native Hawaiian and Other
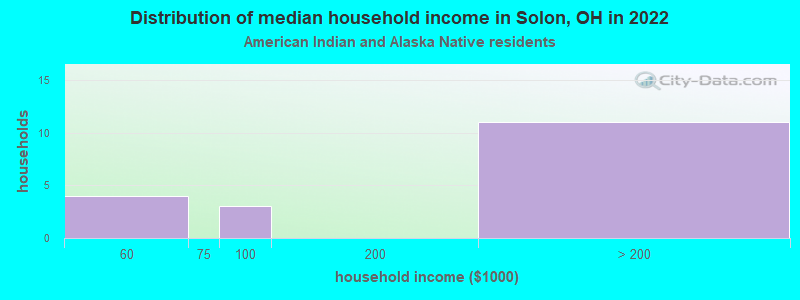
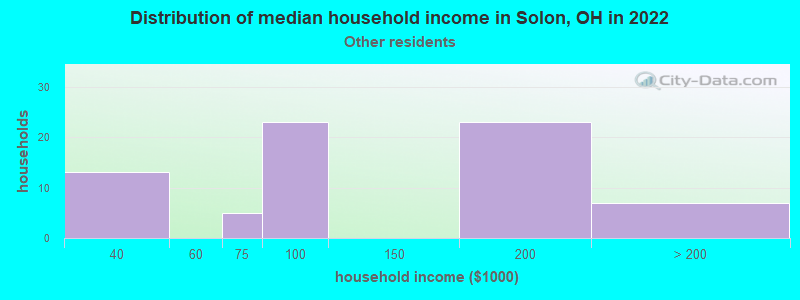
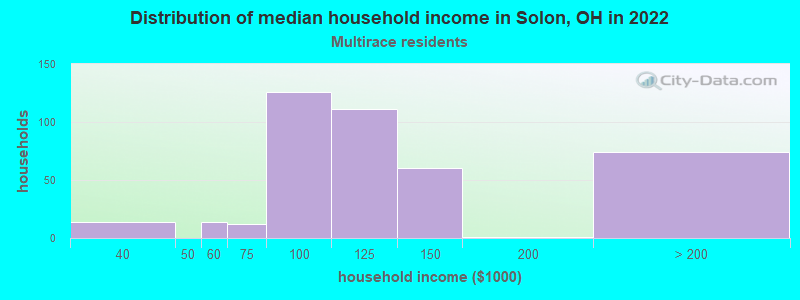
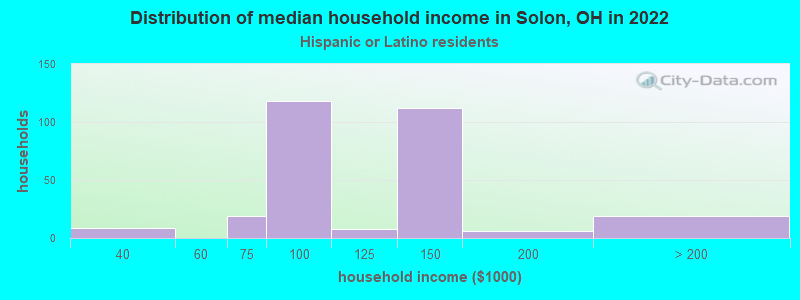
Income and house value in Solon Median household income in 2022 $124,071 White non-Hispanic householders$88,198 Black householdersover $200,000 Asian householders$116,801 Two or more races householders$121,577 Hispanic or Latino race householdersMedian 2022 house value $398,145 White Non-Hispanic householders$426,956 Black or African American householders$302,048 American Indian or Alaska Native householders $466,362 Asian householders$836,441 Some other race householders$573,055 Two or more races householders$564,318 Hispanic or Latino householders
Median age by race in Solon
49.6 Median age for White residents48.7 50.3 43.1 Median age for Black or African American residents47.8 41.1 8.9 Median age for American Indian / Alaska Native residents11.1 -499,999,999.5 43.1 Median age for Asian residents47.7 39.5 56.3 Median age for Native Hawaiian / Pacific Islander residents-750,242,953.6 -805,394,989.6 20.7 Median age for Other race residents18.3 15.6 22.9 Median age for Two or more races residents18.2 46.4 49.6 Median age for White alone residents48.8 50.3 24.8 Median age for Hispanic or Latino residents15.9 41.2
Owner/renter occupied households by race in Solon
House owners and renters - White residents 5,587 87.0% Owner occupied837 13.0% Renter occupiedHouse owners and renters - Black or African American residents 615 64.7% Owner occupied335 35.3% Renter occupiedHouse owners and renters - American Indian / Alaska Native residents 10 100.0% Owner occupiedHouse owners and renters - Asian residents 1,005 96.5% Owner occupied37 3.5% Renter occupiedHouse owners and renters - Native Hawaiian / Pacific Islander residents 29 100.0% Owner occupiedHouse owners and renters - Other race residents 28 41.4% Owner occupied40 58.6% Renter occupiedHouse owners and renters - Two or more races residents 408 95.0% Owner occupied21 5.0% Renter occupiedHouse owners and renters - White alone residents 5,591 87.0% Owner occupied832 13.0% Renter occupiedHouse owners and renters - Hispanic or Latino residents 202 73.5% Owner occupied73 26.5% Renter occupied
Language usage in Solon
English speakers - Total 76.2% of residents of Solon speak English at home.
2.7% of residents speak Spanish at home 429 70.0% Speak English very well184 30.0% Speak English less than very well21.6% of residents speak other language at home 3,277 67.9% Speak English very well1,549 32.1% Speak English less than very well
English speakers - Born in the United States 84.8% of residents of Solon speak English at home.
2.5% of residents speak Spanish at home 95 100.0% Speak English very well15.9% of residents speak other language at home 578 94.4% Speak English very well34 5.6% Speak English less than very well
English speakers - Native, born elsewhere 36.9% of residents of Solon speak English at home.
58.1% of residents speak Spanish at home 122 94.6% Speak English very well7 5.4% Speak English less than very well
English speakers - Foreign-born 13.3% of residents of Solon speak English at home.
7.7% of residents speak Spanish at home 150 44.1% Speak English very well190 55.9% Speak English less than very well78.6% of residents speak other language at home 2,077 59.9% Speak English very well1,388 40.1% Speak English less than very well
White (Caucasian) - Speak only English Native:
95.7% (12,756)Foreign-born:
26.9% (322)
White (Caucasian) - Speak another language Native:
4.3% (569)Foreign-born:
73.2% (874)
Black or African American - Speak only English Native:
98.3% (2,114)Foreign-born:
21.8% (88)
Black or African American - Speak another language Native:
1.7% (36)Foreign-born:
77.5% (313)
Asian - Speak only English Native:
35.4% (344)Foreign-born:
7.1% (155)
Asian - Speak another language Native:
66.2% (644)Foreign-born:
92.8% (2,020)
Other race - Speak another language Native:
20.1% (21)Foreign-born:
100.0% (98)
Two or more races - Speak only English Native:
79.5% (1,125)Foreign-born:
4.7% (33)
Two or more races - Speak another language Native:
19.9% (281)Foreign-born:
96.1% (668)
White alone - Speak only English Native:
95.3% (12,667)Foreign-born:
26.5% (315)
White alone - Speak another language Native:
4.8% (633)Foreign-born:
73.5% (873)
Hispanic or Latino - Speak only English Native:
49.4% (281)Foreign-born:
2.7% (10)
Hispanic or Latino - Speak another language Native:
50.6% (288)Foreign-born:
98.8% (366)
Foreign-born residents in Solon 4,588 residents are foreign born (11.9% Asia , 3.5% Europe ).
Marital status for residents in Solon Marital status - White (Caucasian) population 15 years and over
Males 22.7% Never married69.3% Now married0.8% Separated3.5% Widowed3.8% DivorcedFemales 16.5% Never married65.0% Now married0.3% Separated9.9% Widowed8.3% DivorcedWomen who gave birth in the past 12 months Now married:
91.5% (101)Unmarried:
8.5% (9)
Women who did not give birth in the past 12 months Now married:
59.1% (1,526)Unmarried:
40.9% (1,057)
Marital status - Black or African American population 15 years and over
Males 26.3% Never married56.2% Now married8.7% Separated4.1% Widowed4.7% DivorcedFemales 16.4% Never married54.0% Now married5.1% Separated8.2% Widowed16.2% DivorcedWomen who did not give birth in the past 12 months Now married:
59.8% (262)Unmarried:
40.2% (176)
Marital status - American Indian / Alaska Native population 15 years and over
Males 0.0% Never married100.0% Now married0.0% Separated0.0% Widowed0.0% DivorcedFemales 0.0% Never married100.0% Now married0.0% Separated0.0% Widowed0.0% DivorcedWomen who did not give birth in the past 12 months Now married:
100.0% (9)Unmarried:
0.0% (0)
Marital status - Asian population 15 years and over
Males 8.7% Never married80.3% Now married0.7% Separated8.2% Widowed2.1% DivorcedFemales 14.6% Never married81.8% Now married3.2% Separated0.4% Widowed0.0% DivorcedWomen who gave birth in the past 12 months Now married:
100.0% (77)Unmarried:
0.0% (0)
Women who did not give birth in the past 12 months Now married:
78.8% (665)Unmarried:
21.2% (179)
Marital status - Native Hawaiian / Pacific Islander population 15 years and over
Males 0.0% Never married100.0% Now married0.0% Separated0.0% Widowed0.0% DivorcedFemales 52.2% Never married47.8% Now married0.0% Separated0.0% Widowed0.0% DivorcedWomen who did not give birth in the past 12 months Now married:
100.0% (12)Unmarried:
0.0% (0)
Marital status - Other race population 15 years and over
Males 74.5% Never married25.5% Now married0.0% Separated0.0% Widowed0.0% DivorcedFemales 63.6% Never married36.4% Now married0.0% Separated0.0% Widowed0.0% DivorcedWomen who gave birth in the past 12 months Now married:
0.0% (0)Unmarried:
100.0% (7)
Women who did not give birth in the past 12 months Now married:
32.4% (16)Unmarried:
67.6% (33)
Marital status - Two or more races population 15 years and over
Males 44.0% Never married48.4% Now married0.0% Separated0.0% Widowed7.6% DivorcedFemales 13.9% Never married82.8% Now married0.0% Separated0.0% Widowed3.3% DivorcedWomen who did not give birth in the past 12 months Now married:
79.2% (375)Unmarried:
20.8% (98)
Marital status - White alone, not Hispanic / Latino population 15 years and over
Males 22.3% Never married69.5% Now married0.8% Separated3.5% Widowed3.9% DivorcedFemales 16.3% Never married65.0% Now married0.3% Separated10.1% Widowed8.2% DivorcedWomen who gave birth in the past 12 months Now married:
90.7% (94)Unmarried:
9.3% (10)
Women who did not give birth in the past 12 months Now married:
59.0% (1,524)Unmarried:
41.0% (1,059)
Marital status - Hispanic or Latino population 15 years and over
Males 39.3% Never married50.8% Now married0.0% Separated0.0% Widowed9.9% DivorcedFemales 21.7% Never married75.1% Now married0.0% Separated0.0% Widowed3.2% DivorcedWomen who gave birth in the past 12 months Now married:
68.8% (11)Unmarried:
31.2% (5)
Women who did not give birth in the past 12 months Now married:
65.6% (149)Unmarried:
34.4% (78)
Ancestries in Solon
839 6.3% Italian708 5.3% German520 3.9% American517 3.9% European468 3.5% Eastern European458 3.4% English410 3.1% Polish314 2.3% Irish259 1.9% Russian242 1.8% Hungarian193 1.4% Nigerian181 1.3% Lebanese179 1.3% African175 1.3% Iranian114 0.8% Ukrainian106 0.8% Slovak97 0.7% Welsh86 0.6% Czech64 0.5% Czechoslovakian51 0.4% Scottish49 0.4% Israeli47 0.4% South African47 0.4% Turkish43 0.3% Scotch-Irish39 0.3% Austrian38 0.3% Slovene37 0.3% Lithuanian33 0.2% Greek30 0.2% Sudanese24 0.2% Swiss20 0.1% British20 0.1% Latvian19 0.1% Northern European14 0.1% Croatian14 0.1% Trinidadian and Tobagonian14 0.1% Armenian13 0.10% Moroccan13 0.10% Swedish12 0.09% French Canadian12 0.09% Ethiopian9 0.07% French7 0.05% Pennsylvania German6 0.04% Dutch5 0.04% Slavic4 0.03% Finnish4 0.03% Canadian4 0.03% Macedonian3 0.02% Syrian
Children Nativity (place of birth) in Solon
Children under 6 years - Living with two parents Both parents native 871 100.0% NativeBoth parents foreign-born 279 98.6% Native4 1.4% Foreign-bornOne native, one foreign-born parent 132 100.0% NativeChildren under 6 years - Living with one parent Native parent 134 99.6% Native1 0.4% Foreign-bornForeign-born parent 109 90.4% Native12 9.6% Foreign-bornChildren 6 to 17 years - Living with two parents Both parents native 2,211 100.0% NativeBoth parents foreign-born 1,279 92.8% Native99 7.2% Foreign-bornOne native, one foreign-born parent 218 100.0% NativeChildren 6 to 17 years - Living with one parent Native parent 228 72.9% Native85 27.1% Foreign-bornForeign-born parent 196 71.8% Native77 28.2% Foreign-born
Grandparents responsible for own grandchildren in Solon
Grandparents (30 to 59 years) White / Caucasian 3 100.0% Responsible for grandchildrenBlack or African American 11 42.4% Responsible for grandchildren15 57.6% Not responsible for grandchildrenOther race 12 100.0% Responsible for grandchildrenWhite alone, not Hispanic / Latino 3 100.0% Responsible for grandchildrenHispanic or Latino 14 100.0% Responsible for grandchildrenGrandparents (60 years and over) White / Caucasian 51 100.0% Not responsible for grandchildrenBlack or African American 3 4.5% Responsible for grandchildren72 95.5% Not responsible for grandchildrenWhite alone, not Hispanic / Latino 53 100.0% Not responsible for grandchildren