Races in Somerdale, New Jersey (NJ) Detailed Stats
Data:
Races - White alone (%)
Races - White alone (% change since 2000)
Races - Black alone (%)
Races - Black alone (% change since 2000)
Races - American Indian alone (%)
Races - American Indian alone (% change since 2000)
Races - Asian alone (%)
Races - Asian alone (% change since 2000)
Races - Hispanic (%)
Races - Hispanic (% change since 2000)
Races - Native Hawaiian and Other Pacific Islander alone (%)
Races - Native Hawaiian and Other Pacific Islander alone (% change since 2000)
Races - Two or more races(%)
Races - Two or more races(% change since 2000)
Races - Other race alone (%)
Races - Other race alone (% change since 2000)
Racial diversity
Place of birth - Born in state of residence (%)
Place of birth - Born in state of residence (%) - White
Place of birth - Born in state of residence (%) - Black or African American
Place of birth - Born in state of residence (%) - Asian
Place of birth - Born in state of residence (%) - Hispanic or Latino
Place of birth - Born in state of residence (%) - American Indian and Alaska Native
Place of birth - Born in state of residence (%) - Multirace
Place of birth - Born in state of residence (%) - Other Race
Place of birth - Born in other state (%)
Place of birth - Born in other state (%) - White
Place of birth - Born in other state (%) - Black or African American
Place of birth - Born in other state (%) - Asian
Place of birth - Born in other state (%) - Hispanic or Latino
Place of birth - Born in other state (%) - American Indian and Alaska Native
Place of birth - Born in other state (%) - Multirace
Place of birth - Born in other state (%) - Other Race
Place of birth - Native, outside of US (%)
Place of birth - Native, outside of US (%) - White
Place of birth - Native, outside of US (%) - Black or African American
Place of birth - Native, outside of US (%) - Asian
Place of birth - Native, outside of US (%) - Hispanic or Latino
Place of birth - Native, outside of US (%) - American Indian and Alaska Native
Place of birth - Native, outside of US (%) - Multirace
Place of birth - Native, outside of US (%) - Other Race
Place of birth - Foreign born (%)
Place of birth - Foreign born (%) - White
Place of birth - Foreign born (%) - Black or African American
Place of birth - Foreign born (%) - Asian
Place of birth - Foreign born (%) - Hispanic or Latino
Place of birth - Foreign born (%) - American Indian and Alaska Native
Place of birth - Foreign born (%) - Multirace
Place of birth - Foreign born (%) - Other Race
Residents speaking English at home (%)
Residents speaking English at home - Born in the United States (%)
Residents speaking English at home - Native, born elsewhere (%)
Residents speaking English at home - Foreign born (%)
Residents speaking Spanish at home (%)
Residents speaking Spanish at home - Born in the United States (%)
Residents speaking Spanish at home - Native, born elsewhere (%)
Residents speaking Spanish at home - Foreign born (%)
Residents speaking other language at home (%)
Residents speaking other language at home - Born in the United States (%)
Residents speaking other language at home - Native, born elsewhere (%)
Residents speaking other language at home - Foreign born (%)
Marital status - Never married (%)
Marital status - Now married (%)
Marital status - Separated (%)
Marital status - Widowed (%)
Marital status - Divorced (%)
Ancestries Reported - Arab (%)
Ancestries Reported - Czech (%)
Ancestries Reported - Danish (%)
Ancestries Reported - Dutch (%)
Ancestries Reported - English (%)
Ancestries Reported - French (%)
Ancestries Reported - French Canadian (%)
Ancestries Reported - German (%)
Ancestries Reported - Greek (%)
Ancestries Reported - Hungarian (%)
Ancestries Reported - Irish (%)
Ancestries Reported - Italian (%)
Ancestries Reported - Lithuanian (%)
Ancestries Reported - Norwegian (%)
Ancestries Reported - Polish (%)
Ancestries Reported - Portuguese (%)
Ancestries Reported - Russian (%)
Ancestries Reported - Scotch-Irish (%)
Ancestries Reported - Scottish (%)
Ancestries Reported - Slovak (%)
Ancestries Reported - Subsaharan African (%)
Ancestries Reported - Swedish (%)
Ancestries Reported - Swiss (%)
Ancestries Reported - Ukrainian (%)
Ancestries Reported - United States (%)
Ancestries Reported - Welsh (%)
Ancestries Reported - West Indian (%)
Ancestries Reported - Other (%)
Geographical mobility - Same house 1 year ago (%)
Geographical mobility - Same house 1 year ago (%) - White
Geographical mobility - Same house 1 year ago (%) - Black or African American
Geographical mobility - Same house 1 year ago (%) - Asian
Geographical mobility - Same house 1 year ago (%) - Hispanic or Latino
Geographical mobility - Same house 1 year ago (%) - American Indian and Alaska Native
Geographical mobility - Same house 1 year ago (%) - Multirace
Geographical mobility - Same house 1 year ago (%) - Other Race
Geographical mobility - Moved within same county (%)
Geographical mobility - Moved within same county (%) - White
Geographical mobility - Moved within same county (%) - Black or African American
Geographical mobility - Moved within same county (%) - Asian
Geographical mobility - Moved within same county (%) - Hispanic or Latino
Geographical mobility - Moved within same county (%) - American Indian and Alaska Native
Geographical mobility - Moved within same county (%) - Multirace
Geographical mobility - Moved within same county (%) - Other Race
Geographical mobility - Moved from different county within same state (%)
Geographical mobility - Moved from different county within same state (%) - White
Geographical mobility - Moved from different county within same state (%) - Black or African American
Geographical mobility - Moved from different county within same state (%) - Asian
Geographical mobility - Moved from different county within same state (%) - Hispanic or Latino
Geographical mobility - Moved from different county within same state (%) - American Indian and Alaska Native
Geographical mobility - Moved from different county within same state (%) - Multirace
Geographical mobility - Moved from different county within same state (%) - Other Race
Geographical mobility - Moved from different state (%)
Geographical mobility - Moved from different state (%) - White
Geographical mobility - Moved from different state (%) - Black or African American
Geographical mobility - Moved from different state (%) - Asian
Geographical mobility - Moved from different state (%) - Hispanic or Latino
Geographical mobility - Moved from different state (%) - American Indian and Alaska Native
Geographical mobility - Moved from different state (%) - Multirace
Geographical mobility - Moved from different state (%) - Other Race
Geographical mobility - Moved from abroad (%)
Geographical mobility - Moved from abroad (%) - White
Geographical mobility - Moved from abroad (%) - Black or African American
Geographical mobility - Moved from abroad (%) - Asian
Geographical mobility - Moved from abroad (%) - Hispanic or Latino
Geographical mobility - Moved from abroad (%) - American Indian and Alaska Native
Geographical mobility - Moved from abroad (%) - Multirace
Geographical mobility - Moved from abroad (%) - Other Race
Place of birth for the foreign-born population - Ireland (%)
Place of birth for the foreign-born population - Denmark (%)
Place of birth for the foreign-born population - Norway (%)
Place of birth for the foreign-born population - Sweden (%)
Place of birth for the foreign-born population - United Kingdom (%)
Place of birth for the foreign-born population - England (%)
Place of birth for the foreign-born population - Scotland (%)
Place of birth for the foreign-born population - Other Northern Europe (%)
Place of birth for the foreign-born population - Austria (%)
Place of birth for the foreign-born population - Belgium (%)
Place of birth for the foreign-born population - France (%)
Place of birth for the foreign-born population - Germany (%)
Place of birth for the foreign-born population - Netherlands (%)
Place of birth for the foreign-born population - Switzerland (%)
Place of birth for the foreign-born population - Other Western Europe (%)
Place of birth for the foreign-born population - Greece (%)
Place of birth for the foreign-born population - Italy (%)
Place of birth for the foreign-born population - Portugal (%)
Place of birth for the foreign-born population - Spain (%)
Place of birth for the foreign-born population - Other Southern Europe (%)
Place of birth for the foreign-born population - Albania (%)
Place of birth for the foreign-born population - Belarus (%)
Place of birth for the foreign-born population - Bosnia and Herzegovina (%)
Place of birth for the foreign-born population - Bulgaria (%)
Place of birth for the foreign-born population - Croatia (%)
Place of birth for the foreign-born population - Czechoslovakia (%)
Place of birth for the foreign-born population - Hungary (%)
Place of birth for the foreign-born population - Latvia (%)
Place of birth for the foreign-born population - Lithuania (%)
Place of birth for the foreign-born population - North Macedonia (Macedonia) (%)
Place of birth for the foreign-born population - Moldova (%)
Place of birth for the foreign-born population - Poland (%)
Place of birth for the foreign-born population - Romania (%)
Place of birth for the foreign-born population - Russia (%)
Place of birth for the foreign-born population - Serbia (%)
Place of birth for the foreign-born population - Ukraine (%)
Place of birth for the foreign-born population - Other Eastern Europe (%)
Place of birth for the foreign-born population - China (%)
Place of birth for the foreign-born population - Hong Kong (%)
Place of birth for the foreign-born population - Taiwan (%)
Place of birth for the foreign-born population - Japan (%)
Place of birth for the foreign-born population - Korea (%)
Place of birth for the foreign-born population - Other Eastern Asia (%)
Place of birth for the foreign-born population - Afghanistan (%)
Place of birth for the foreign-born population - Bangladesh (%)
Place of birth for the foreign-born population - India (%)
Place of birth for the foreign-born population - Iran (%)
Place of birth for the foreign-born population - Kazakhstan (%)
Place of birth for the foreign-born population - Nepal (%)
Place of birth for the foreign-born population - Pakistan (%)
Place of birth for the foreign-born population - Sri Lanka (%)
Place of birth for the foreign-born population - Uzbekistan (%)
Place of birth for the foreign-born population - Other South Central Asia (%)
Place of birth for the foreign-born population - Burma (%)
Place of birth for the foreign-born population - Cambodia (%)
Place of birth for the foreign-born population - Indonesia (%)
Place of birth for the foreign-born population - Laos (%)
Place of birth for the foreign-born population - Malaysia (%)
Place of birth for the foreign-born population - Philippines (%)
Place of birth for the foreign-born population - Singapore (%)
Place of birth for the foreign-born population - Thailand (%)
Place of birth for the foreign-born population - Vietnam (%)
Place of birth for the foreign-born population - Other South Eastern Asia (%)
Place of birth for the foreign-born population - Armenia (%)
Place of birth for the foreign-born population - Iraq (%)
Place of birth for the foreign-born population - Israel (%)
Place of birth for the foreign-born population - Jordan (%)
Place of birth for the foreign-born population - Kuwait (%)
Place of birth for the foreign-born population - Lebanon (%)
Place of birth for the foreign-born population - Saudi Arabia (%)
Place of birth for the foreign-born population - Syria (%)
Place of birth for the foreign-born population - Turkey (%)
Place of birth for the foreign-born population - Yemen (%)
Place of birth for the foreign-born population - Other Western Asia (%)
Place of birth for the foreign-born population - Eritrea (%)
Place of birth for the foreign-born population - Ethiopia (%)
Place of birth for the foreign-born population - Kenya (%)
Place of birth for the foreign-born population - Somalia (%)
Place of birth for the foreign-born population - Uganda (%)
Place of birth for the foreign-born population - Zimbabwe (%)
Place of birth for the foreign-born population - Other Eastern Africa (%)
Place of birth for the foreign-born population - Cameroon (%)
Place of birth for the foreign-born population - Congo (%)
Place of birth for the foreign-born population - Democratic Republic of Congo (Zaire) (%)
Place of birth for the foreign-born population - Other Middle Africa (%)
Place of birth for the foreign-born population - Egypt (%)
Place of birth for the foreign-born population - Morocco (%)
Place of birth for the foreign-born population - Sudan (%)
Place of birth for the foreign-born population - Other Northern Africa (%)
Place of birth for the foreign-born population - South Africa (%)
Place of birth for the foreign-born population - Other Southern Africa (%)
Place of birth for the foreign-born population - Cabo Verde (%)
Place of birth for the foreign-born population - Ghana (%)
Place of birth for the foreign-born population - Liberia (%)
Place of birth for the foreign-born population - Nigeria (%)
Place of birth for the foreign-born population - Senegal (%)
Place of birth for the foreign-born population - Sierra Leone (%)
Place of birth for the foreign-born population - Other Western Africa (%)
Place of birth for the foreign-born population - Australia (%)
Place of birth for the foreign-born population - New Zealand (%)
Place of birth for the foreign-born population - Fiji (%)
Place of birth for the foreign-born population - Micronesia (%)
Place of birth for the foreign-born population - Bahamas (%)
Place of birth for the foreign-born population - Barbados (%)
Place of birth for the foreign-born population - Cuba (%)
Place of birth for the foreign-born population - Dominica (%)
Place of birth for the foreign-born population - Dominican Republic (%)
Place of birth for the foreign-born population - Grenada (%)
Place of birth for the foreign-born population - Haiti (%)
Place of birth for the foreign-born population - Jamaica (%)
Place of birth for the foreign-born population - St. Vincent and the Grenadines (%)
Place of birth for the foreign-born population - Trinidad and Tobago (%)
Place of birth for the foreign-born population - West Indies (%)
Place of birth for the foreign-born population - Other Caribbean (%)
Place of birth for the foreign-born population - Belize (%)
Place of birth for the foreign-born population - Costa Rica (%)
Place of birth for the foreign-born population - El Salvador (%)
Place of birth for the foreign-born population - Guatemala (%)
Place of birth for the foreign-born population - Honduras (%)
Place of birth for the foreign-born population - Mexico (%)
Place of birth for the foreign-born population - Nicaragua (%)
Place of birth for the foreign-born population - Panama (%)
Place of birth for the foreign-born population - Other Central America (%)
Place of birth for the foreign-born population - Argentina (%)
Place of birth for the foreign-born population - Bolivia (%)
Place of birth for the foreign-born population - Brazil (%)
Place of birth for the foreign-born population - Chile (%)
Place of birth for the foreign-born population - Colombia (%)
Place of birth for the foreign-born population - Ecuador (%)
Place of birth for the foreign-born population - Guyana (%)
Place of birth for the foreign-born population - Peru (%)
Place of birth for the foreign-born population - Uruguay (%)
Place of birth for the foreign-born population - Venezuela (%)
Place of birth for the foreign-born population - Other South America (%)
Place of birth for the foreign-born population - Canada (%)
Place of birth for the foreign-born population - Other Northern America (%)
Place of birth for the foreign-born population - Other (%)
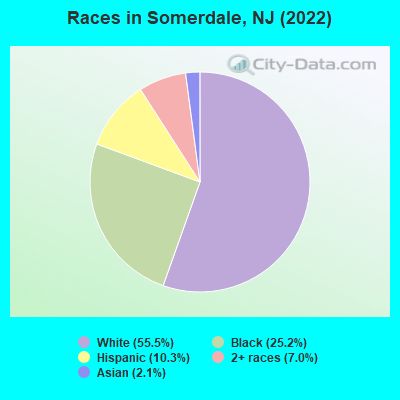
According to 2022 data, the most numerous races in Somerdale, NJ are White alone (3,081 residents), Hispanic (573 residents), and Black alone (1,399 residents). 85.6% of Somerdale residents speak English at home. 7.1% of Somerdale, NJ residents are foreign-born (2.1% born in Europe, 1.9% born in Asia, 1.6% born in Latin America, 1.4% born in Africa), which is 224.8% less than the foreign-born rate of 23.0% across the entire state of New Jersey.
Race distribution in Somerdale
2000 2022
5,557,209 66.0% White alone 1,117,191 13.3% Hispanic 1,096,171 13.0% Black alone 477,012 5.7% Asian alone 133,689 1.6% Two or more races 19,565 0.2% Other race alone 11,338 0.1% American Indian alone 2,175 0.03% Native Hawaiian and Other
4,766,476 51.5% White alone 2,028,470 21.9% Hispanic 1,111,632 12.0% Black alone 923,546 10.0% Asian alone 332,237 3.6% Two or more races 89,847 1.0% Other race alone 8,557 0.09% American Indian alone 934 0.01% Native Hawaiian and Other
Income and house value in Somerdale Median household income in 2022 $87,350 White non-Hispanic householders$72,406 Black householders$101,974 Asian householders$128,461 Two or more races householders$73,170 Hispanic or Latino race householdersMedian 2022 house value $229,974 White Non-Hispanic householders$237,839 Black or African American householders $272,395 Asian householders$245,703 Some other race householders$202,568 Two or more races householders$271,918 Hispanic or Latino householders
Median age by race in Somerdale
43.1 Median age for White residents45.6 42.2 38.6 Median age for Black or African American residents55.0 33.7 -676,272,813.9 Median age for American Indian / Alaska Native residents-670,465,336.5 -688,298,917.7 48.0 Median age for Asian residents37.9 49.0 -701,509,871.5 Median age for Native Hawaiian / Pacific Islander residents-860,335,194.7 -668,881,505.4 9.2 Median age for Other race residents43.5 8.4 30.1 Median age for Two or more races residents35.1 27.2 42.6 Median age for White alone residents45.0 41.9 35.2 Median age for Hispanic or Latino residents36.9 34.6
Owner/renter occupied households by race in Somerdale
House owners and renters - White residents 1,166 78.9% Owner occupied312 21.1% Renter occupiedHouse owners and renters - Black or African American residents 302 59.2% Owner occupied208 40.8% Renter occupiedHouse owners and renters - Asian residents 115 95.3% Owner occupied6 4.7% Renter occupiedHouse owners and renters - Native Hawaiian / Pacific Islander residents 39 100.0% Owner occupiedHouse owners and renters - Other race residents 37 100.0% Owner occupiedHouse owners and renters - Two or more races residents 100 90.0% Owner occupied11 10.0% Renter occupiedHouse owners and renters - White alone residents 1,128 77.4% Owner occupied329 22.6% Renter occupiedHouse owners and renters - Hispanic or Latino residents 186 97.9% Owner occupied4 2.1% Renter occupied
Language usage in Somerdale
English speakers - Total 85.6% of residents of Somerdale speak English at home.
6.5% of residents speak Spanish at home 308 92.2% Speak English very well26 7.8% Speak English less than very well6.7% of residents speak other language at home 292 84.9% Speak English very well52 15.1% Speak English less than very well
English speakers - Born in the United States 93.6% of residents of Somerdale speak English at home.
4.1% of residents speak Spanish at home 80 100.0% Speak English very well2.0% of residents speak other language at home 39 100.0% Speak English very well
English speakers - Native, born elsewhere 49.0% of residents of Somerdale speak English at home.
37.3% of residents speak Spanish at home 19 100.0% Speak English very well15.7% of residents speak other language at home 8 100.0% Speak English very well
English speakers - Foreign-born 20.7% of residents of Somerdale speak English at home.
20.2% of residents speak Spanish at home 51 63.8% Speak English very well29 36.2% Speak English less than very well48.7% of residents speak other language at home 167 86.5% Speak English very well26 13.5% Speak English less than very well
White (Caucasian) - Speak only English Native:
93.4% (2,690)Foreign-born:
4.6% (5)
White (Caucasian) - Speak another language Native:
6.4% (185)Foreign-born:
96.4% (112)
Black or African American - Speak only English Native:
89.7% (1,200)Foreign-born:
41.5% (25)
Black or African American - Speak another language Native:
8.5% (114)Foreign-born:
55.0% (33)
Asian - Speak only English Native:
100.0% (23)Foreign-born:
65.9% (63)
Other race - Speak another language Native:
50.4% (39)Foreign-born:
99.7% (54)
White alone - Speak only English Native:
92.9% (2,623)Foreign-born:
5.1% (6)
White alone - Speak another language Native:
8.0% (227)Foreign-born:
98.0% (118)
Hispanic or Latino - Speak another language Native:
35.6% (139)Foreign-born:
100.0% (82)
Foreign-born residents in Somerdale 393 residents are foreign born (2.1% Europe , 1.9% Asia , 1.6% Latin America , 1.4% Africa ).
This city:
7.1%New Jersey:
23.2%
Marital status for residents in Somerdale Marital status - White (Caucasian) population 15 years and over
Males 33.5% Never married49.5% Now married0.0% Separated3.5% Widowed13.4% DivorcedFemales 38.2% Never married41.8% Now married0.6% Separated5.0% Widowed14.4% DivorcedWomen who gave birth in the past 12 months Now married:
76.8% (40)Unmarried:
23.2% (12)
Women who did not give birth in the past 12 months Now married:
30.1% (237)Unmarried:
69.9% (552)
Marital status - Black or African American population 15 years and over
Males 18.0% Never married61.4% Now married0.0% Separated1.8% Widowed18.8% DivorcedFemales 42.3% Never married36.0% Now married8.1% Separated6.8% Widowed6.8% DivorcedWomen who gave birth in the past 12 months Now married:
66.7% (35)Unmarried:
33.3% (17)
Women who did not give birth in the past 12 months Now married:
25.5% (94)Unmarried:
74.5% (275)
Marital status - Asian population 15 years and over
Males 33.3% Never married66.7% Now married0.0% Separated0.0% Widowed0.0% DivorcedFemales 65.5% Never married12.6% Now married0.0% Separated13.8% Widowed8.0% DivorcedWomen who did not give birth in the past 12 months Now married:
11.3% (6)Unmarried:
88.7% (48)
Marital status - Other race population 15 years and over
Males 19.2% Never married80.8% Now married0.0% Separated0.0% Widowed0.0% DivorcedFemales 36.7% Never married63.3% Now married0.0% Separated0.0% Widowed0.0% DivorcedWomen who gave birth in the past 12 months Now married:
100.0% (11)Unmarried:
0.0% (0)
Women who did not give birth in the past 12 months Now married:
0.0% (0)Unmarried:
100.0% (19)
Marital status - Two or more races population 15 years and over
Males 23.1% Never married76.9% Now married0.0% Separated0.0% Widowed0.0% DivorcedFemales 77.9% Never married22.1% Now married0.0% Separated0.0% Widowed0.0% DivorcedWomen who gave birth in the past 12 months Now married:
0.0% (0)Unmarried:
100.0% (14)
Women who did not give birth in the past 12 months Now married:
0.0% (0)Unmarried:
100.0% (108)
Marital status - White alone, not Hispanic / Latino population 15 years and over
Males 32.9% Never married50.0% Now married0.0% Separated3.7% Widowed13.4% DivorcedFemales 38.9% Never married42.2% Now married0.4% Separated5.3% Widowed13.3% DivorcedWomen who gave birth in the past 12 months Now married:
76.8% (42)Unmarried:
23.2% (13)
Women who did not give birth in the past 12 months Now married:
31.2% (246)Unmarried:
68.8% (541)
Marital status - Hispanic or Latino population 15 years and over
Males 50.5% Never married41.9% Now married0.0% Separated0.0% Widowed7.6% DivorcedFemales 23.6% Never married48.6% Now married18.5% Separated0.0% Widowed9.3% DivorcedWomen who gave birth in the past 12 months Now married:
100.0% (10)Unmarried:
0.0% (0)
Women who did not give birth in the past 12 months Now married:
53.9% (99)Unmarried:
46.1% (84)
Ancestries in Somerdale
427 16.4% Irish402 15.5% Italian169 6.5% Polish116 4.5% American41 1.6% English31 1.2% Portuguese28 1.1% Greek27 1.0% Kenyan24 0.9% African20 0.8% German19 0.7% Albanian14 0.5% Scottish10 0.4% Hungarian10 0.4% Turkish9 0.3% European8 0.3% Syrian8 0.3% Russian7 0.3% Eastern European7 0.3% Scotch-Irish4 0.2% Jamaican
Children Nativity (place of birth) in Somerdale
Children under 6 years - Living with two parents Both parents native 152 100.0% NativeOne native, one foreign-born parent 62 100.0% NativeChildren under 6 years - Living with one parent Native parent 176 100.0% NativeForeign-born parent 8 100.0% Foreign-bornChildren 6 to 17 years - Living with two parents Both parents native 291 100.0% NativeBoth parents foreign-born 49 100.0% NativeOne native, one foreign-born parent 14 100.0% NativeChildren 6 to 17 years - Living with one parent Native parent 412 100.0% NativeForeign-born parent 31 61.5% Native20 38.5% Foreign-born
Grandparents responsible for own grandchildren in Somerdale
Grandparents (30 to 59 years) Black or African American 160 100.0% Responsible for grandchildrenTwo or more races 16 100.0% Not responsible for grandchildrenHispanic or Latino 62 100.0% Responsible for grandchildren
Grandparents (60 years and over) Two or more races 8 100.0% Responsible for grandchildren