Races in Somerset, New Jersey (NJ) Detailed Stats
Data:
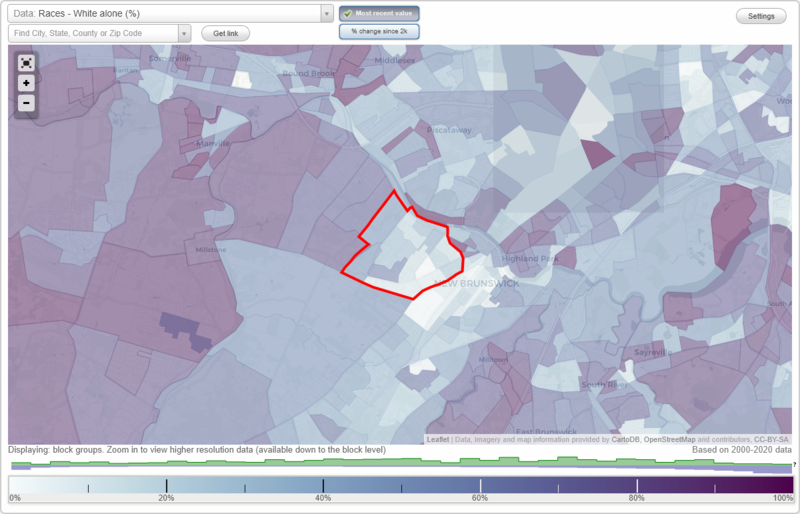
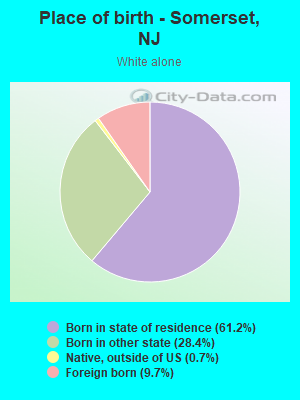
Races - White alone (%)
Races - White alone (% change since 2000)
Races - Black alone (%)
Races - Black alone (% change since 2000)
Races - American Indian alone (%)
Races - American Indian alone (% change since 2000)
Races - Asian alone (%)
Races - Asian alone (% change since 2000)
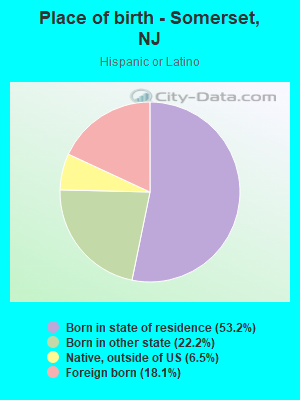
Races - Hispanic (%)
Races - Hispanic (% change since 2000)
Races - Native Hawaiian and Other Pacific Islander alone (%)
Races - Native Hawaiian and Other Pacific Islander alone (% change since 2000)
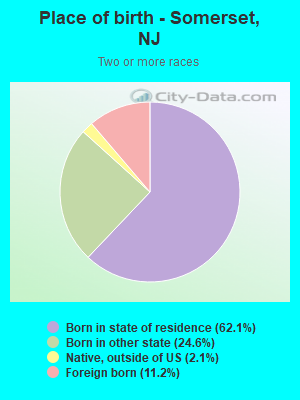
Races - Two or more races(%)
Races - Two or more races(% change since 2000)
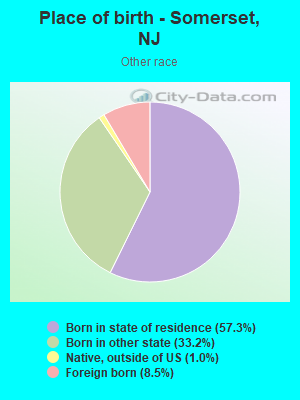
Races - Other race alone (%)
Races - Other race alone (% change since 2000)
Racial diversity
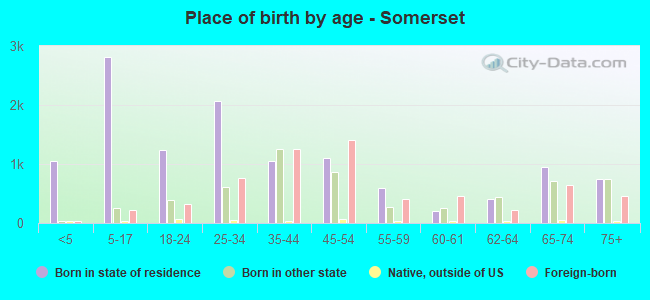
Place of birth - Born in state of residence (%)
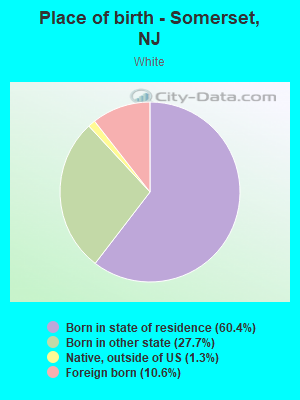
Place of birth - Born in state of residence (%) - White
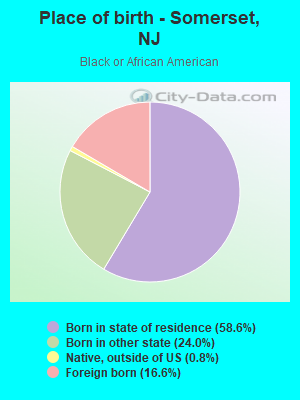
Place of birth - Born in state of residence (%) - Black or African American
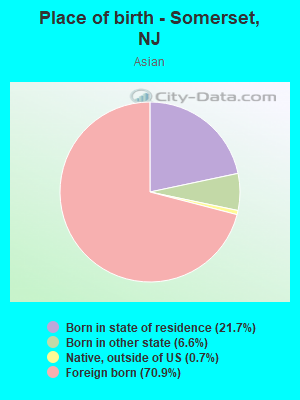
Place of birth - Born in state of residence (%) - Asian
Place of birth - Born in state of residence (%) - Hispanic or Latino
Place of birth - Born in state of residence (%) - American Indian and Alaska Native
Place of birth - Born in state of residence (%) - Multirace
Place of birth - Born in state of residence (%) - Other Race
Place of birth - Born in other state (%)
Place of birth - Born in other state (%) - White
Place of birth - Born in other state (%) - Black or African American
Place of birth - Born in other state (%) - Asian
Place of birth - Born in other state (%) - Hispanic or Latino
Place of birth - Born in other state (%) - American Indian and Alaska Native
Place of birth - Born in other state (%) - Multirace
Place of birth - Born in other state (%) - Other Race
Place of birth - Native, outside of US (%)
Place of birth - Native, outside of US (%) - White
Place of birth - Native, outside of US (%) - Black or African American
Place of birth - Native, outside of US (%) - Asian
Place of birth - Native, outside of US (%) - Hispanic or Latino
Place of birth - Native, outside of US (%) - American Indian and Alaska Native
Place of birth - Native, outside of US (%) - Multirace
Place of birth - Native, outside of US (%) - Other Race
Place of birth - Foreign born (%)
Place of birth - Foreign born (%) - White
Place of birth - Foreign born (%) - Black or African American
Place of birth - Foreign born (%) - Asian
Place of birth - Foreign born (%) - Hispanic or Latino
Place of birth - Foreign born (%) - American Indian and Alaska Native
Place of birth - Foreign born (%) - Multirace
Place of birth - Foreign born (%) - Other Race
Residents speaking English at home (%)
Residents speaking English at home - Born in the United States (%)
Residents speaking English at home - Native, born elsewhere (%)
Residents speaking English at home - Foreign born (%)
Residents speaking Spanish at home (%)
Residents speaking Spanish at home - Born in the United States (%)
Residents speaking Spanish at home - Native, born elsewhere (%)
Residents speaking Spanish at home - Foreign born (%)
Residents speaking other language at home (%)
Residents speaking other language at home - Born in the United States (%)
Residents speaking other language at home - Native, born elsewhere (%)
Residents speaking other language at home - Foreign born (%)
Marital status - Never married (%)
Marital status - Now married (%)
Marital status - Separated (%)
Marital status - Widowed (%)
Marital status - Divorced (%)
Ancestries Reported - Arab (%)
Ancestries Reported - Czech (%)
Ancestries Reported - Danish (%)
Ancestries Reported - Dutch (%)
Ancestries Reported - English (%)
Ancestries Reported - French (%)
Ancestries Reported - French Canadian (%)
Ancestries Reported - German (%)
Ancestries Reported - Greek (%)
Ancestries Reported - Hungarian (%)
Ancestries Reported - Irish (%)
Ancestries Reported - Italian (%)
Ancestries Reported - Lithuanian (%)
Ancestries Reported - Norwegian (%)
Ancestries Reported - Polish (%)
Ancestries Reported - Portuguese (%)
Ancestries Reported - Russian (%)
Ancestries Reported - Scotch-Irish (%)
Ancestries Reported - Scottish (%)
Ancestries Reported - Slovak (%)
Ancestries Reported - Subsaharan African (%)
Ancestries Reported - Swedish (%)
Ancestries Reported - Swiss (%)
Ancestries Reported - Ukrainian (%)
Ancestries Reported - United States (%)
Ancestries Reported - Welsh (%)
Ancestries Reported - West Indian (%)
Ancestries Reported - Other (%)
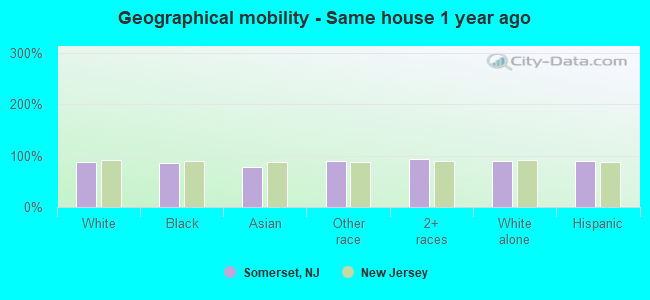
Geographical mobility - Same house 1 year ago (%)
Geographical mobility - Same house 1 year ago (%) - White
Geographical mobility - Same house 1 year ago (%) - Black or African American
Geographical mobility - Same house 1 year ago (%) - Asian
Geographical mobility - Same house 1 year ago (%) - Hispanic or Latino
Geographical mobility - Same house 1 year ago (%) - American Indian and Alaska Native
Geographical mobility - Same house 1 year ago (%) - Multirace
Geographical mobility - Same house 1 year ago (%) - Other Race
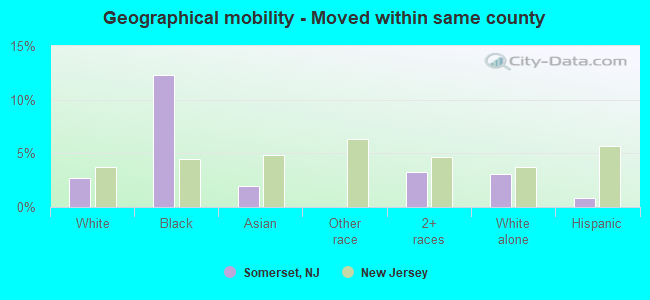
Geographical mobility - Moved within same county (%)
Geographical mobility - Moved within same county (%) - White
Geographical mobility - Moved within same county (%) - Black or African American
Geographical mobility - Moved within same county (%) - Asian
Geographical mobility - Moved within same county (%) - Hispanic or Latino
Geographical mobility - Moved within same county (%) - American Indian and Alaska Native
Geographical mobility - Moved within same county (%) - Multirace
Geographical mobility - Moved within same county (%) - Other Race
Geographical mobility - Moved from different county within same state (%)
Geographical mobility - Moved from different county within same state (%) - White
Geographical mobility - Moved from different county within same state (%) - Black or African American
Geographical mobility - Moved from different county within same state (%) - Asian
Geographical mobility - Moved from different county within same state (%) - Hispanic or Latino
Geographical mobility - Moved from different county within same state (%) - American Indian and Alaska Native
Geographical mobility - Moved from different county within same state (%) - Multirace
Geographical mobility - Moved from different county within same state (%) - Other Race
Geographical mobility - Moved from different state (%)
Geographical mobility - Moved from different state (%) - White
Geographical mobility - Moved from different state (%) - Black or African American
Geographical mobility - Moved from different state (%) - Asian
Geographical mobility - Moved from different state (%) - Hispanic or Latino
Geographical mobility - Moved from different state (%) - American Indian and Alaska Native
Geographical mobility - Moved from different state (%) - Multirace
Geographical mobility - Moved from different state (%) - Other Race
Geographical mobility - Moved from abroad (%)
Geographical mobility - Moved from abroad (%) - White
Geographical mobility - Moved from abroad (%) - Black or African American
Geographical mobility - Moved from abroad (%) - Asian
Geographical mobility - Moved from abroad (%) - Hispanic or Latino
Geographical mobility - Moved from abroad (%) - American Indian and Alaska Native
Geographical mobility - Moved from abroad (%) - Multirace
Geographical mobility - Moved from abroad (%) - Other Race
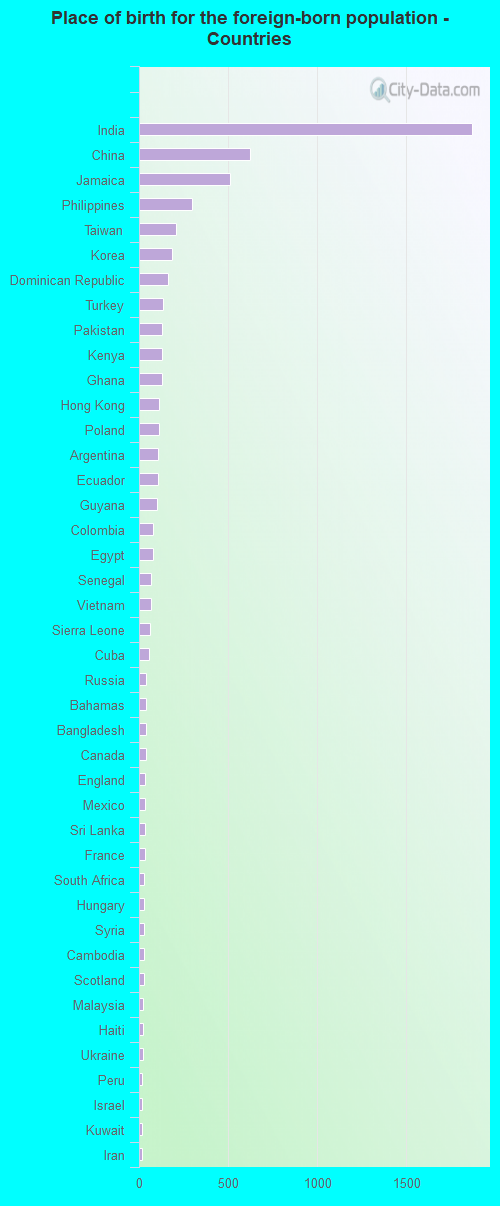
Place of birth for the foreign-born population - Ireland (%)
Place of birth for the foreign-born population - Denmark (%)
Place of birth for the foreign-born population - Norway (%)
Place of birth for the foreign-born population - Sweden (%)
Place of birth for the foreign-born population - United Kingdom (%)
Place of birth for the foreign-born population - England (%)
Place of birth for the foreign-born population - Scotland (%)
Place of birth for the foreign-born population - Other Northern Europe (%)
Place of birth for the foreign-born population - Austria (%)
Place of birth for the foreign-born population - Belgium (%)
Place of birth for the foreign-born population - France (%)
Place of birth for the foreign-born population - Germany (%)
Place of birth for the foreign-born population - Netherlands (%)
Place of birth for the foreign-born population - Switzerland (%)
Place of birth for the foreign-born population - Other Western Europe (%)
Place of birth for the foreign-born population - Greece (%)
Place of birth for the foreign-born population - Italy (%)
Place of birth for the foreign-born population - Portugal (%)
Place of birth for the foreign-born population - Spain (%)
Place of birth for the foreign-born population - Other Southern Europe (%)
Place of birth for the foreign-born population - Albania (%)
Place of birth for the foreign-born population - Belarus (%)
Place of birth for the foreign-born population - Bosnia and Herzegovina (%)
Place of birth for the foreign-born population - Bulgaria (%)
Place of birth for the foreign-born population - Croatia (%)
Place of birth for the foreign-born population - Czechoslovakia (%)
Place of birth for the foreign-born population - Hungary (%)
Place of birth for the foreign-born population - Latvia (%)
Place of birth for the foreign-born population - Lithuania (%)
Place of birth for the foreign-born population - North Macedonia (Macedonia) (%)
Place of birth for the foreign-born population - Moldova (%)
Place of birth for the foreign-born population - Poland (%)
Place of birth for the foreign-born population - Romania (%)
Place of birth for the foreign-born population - Russia (%)
Place of birth for the foreign-born population - Serbia (%)
Place of birth for the foreign-born population - Ukraine (%)
Place of birth for the foreign-born population - Other Eastern Europe (%)
Place of birth for the foreign-born population - China (%)
Place of birth for the foreign-born population - Hong Kong (%)
Place of birth for the foreign-born population - Taiwan (%)
Place of birth for the foreign-born population - Japan (%)
Place of birth for the foreign-born population - Korea (%)
Place of birth for the foreign-born population - Other Eastern Asia (%)
Place of birth for the foreign-born population - Afghanistan (%)
Place of birth for the foreign-born population - Bangladesh (%)
Place of birth for the foreign-born population - India (%)
Place of birth for the foreign-born population - Iran (%)
Place of birth for the foreign-born population - Kazakhstan (%)
Place of birth for the foreign-born population - Nepal (%)
Place of birth for the foreign-born population - Pakistan (%)
Place of birth for the foreign-born population - Sri Lanka (%)
Place of birth for the foreign-born population - Uzbekistan (%)
Place of birth for the foreign-born population - Other South Central Asia (%)
Place of birth for the foreign-born population - Burma (%)
Place of birth for the foreign-born population - Cambodia (%)
Place of birth for the foreign-born population - Indonesia (%)
Place of birth for the foreign-born population - Laos (%)
Place of birth for the foreign-born population - Malaysia (%)
Place of birth for the foreign-born population - Philippines (%)
Place of birth for the foreign-born population - Singapore (%)
Place of birth for the foreign-born population - Thailand (%)
Place of birth for the foreign-born population - Vietnam (%)
Place of birth for the foreign-born population - Other South Eastern Asia (%)
Place of birth for the foreign-born population - Armenia (%)
Place of birth for the foreign-born population - Iraq (%)
Place of birth for the foreign-born population - Israel (%)
Place of birth for the foreign-born population - Jordan (%)
Place of birth for the foreign-born population - Kuwait (%)
Place of birth for the foreign-born population - Lebanon (%)
Place of birth for the foreign-born population - Saudi Arabia (%)
Place of birth for the foreign-born population - Syria (%)
Place of birth for the foreign-born population - Turkey (%)
Place of birth for the foreign-born population - Yemen (%)
Place of birth for the foreign-born population - Other Western Asia (%)
Place of birth for the foreign-born population - Eritrea (%)
Place of birth for the foreign-born population - Ethiopia (%)
Place of birth for the foreign-born population - Kenya (%)
Place of birth for the foreign-born population - Somalia (%)
Place of birth for the foreign-born population - Uganda (%)
Place of birth for the foreign-born population - Zimbabwe (%)
Place of birth for the foreign-born population - Other Eastern Africa (%)
Place of birth for the foreign-born population - Cameroon (%)
Place of birth for the foreign-born population - Congo (%)
Place of birth for the foreign-born population - Democratic Republic of Congo (Zaire) (%)
Place of birth for the foreign-born population - Other Middle Africa (%)
Place of birth for the foreign-born population - Egypt (%)
Place of birth for the foreign-born population - Morocco (%)
Place of birth for the foreign-born population - Sudan (%)
Place of birth for the foreign-born population - Other Northern Africa (%)
Place of birth for the foreign-born population - South Africa (%)
Place of birth for the foreign-born population - Other Southern Africa (%)
Place of birth for the foreign-born population - Cabo Verde (%)
Place of birth for the foreign-born population - Ghana (%)
Place of birth for the foreign-born population - Liberia (%)
Place of birth for the foreign-born population - Nigeria (%)
Place of birth for the foreign-born population - Senegal (%)
Place of birth for the foreign-born population - Sierra Leone (%)
Place of birth for the foreign-born population - Other Western Africa (%)
Place of birth for the foreign-born population - Australia (%)
Place of birth for the foreign-born population - New Zealand (%)
Place of birth for the foreign-born population - Fiji (%)
Place of birth for the foreign-born population - Micronesia (%)
Place of birth for the foreign-born population - Bahamas (%)
Place of birth for the foreign-born population - Barbados (%)
Place of birth for the foreign-born population - Cuba (%)
Place of birth for the foreign-born population - Dominica (%)
Place of birth for the foreign-born population - Dominican Republic (%)
Place of birth for the foreign-born population - Grenada (%)
Place of birth for the foreign-born population - Haiti (%)
Place of birth for the foreign-born population - Jamaica (%)
Place of birth for the foreign-born population - St. Vincent and the Grenadines (%)
Place of birth for the foreign-born population - Trinidad and Tobago (%)
Place of birth for the foreign-born population - West Indies (%)
Place of birth for the foreign-born population - Other Caribbean (%)
Place of birth for the foreign-born population - Belize (%)
Place of birth for the foreign-born population - Costa Rica (%)
Place of birth for the foreign-born population - El Salvador (%)
Place of birth for the foreign-born population - Guatemala (%)
Place of birth for the foreign-born population - Honduras (%)
Place of birth for the foreign-born population - Mexico (%)
Place of birth for the foreign-born population - Nicaragua (%)
Place of birth for the foreign-born population - Panama (%)
Place of birth for the foreign-born population - Other Central America (%)
Place of birth for the foreign-born population - Argentina (%)
Place of birth for the foreign-born population - Bolivia (%)
Place of birth for the foreign-born population - Brazil (%)
Place of birth for the foreign-born population - Chile (%)
Place of birth for the foreign-born population - Colombia (%)
Place of birth for the foreign-born population - Ecuador (%)
Place of birth for the foreign-born population - Guyana (%)
Place of birth for the foreign-born population - Peru (%)
Place of birth for the foreign-born population - Uruguay (%)
Place of birth for the foreign-born population - Venezuela (%)
Place of birth for the foreign-born population - Other South America (%)
Place of birth for the foreign-born population - Canada (%)
Place of birth for the foreign-born population - Other Northern America (%)
Place of birth for the foreign-born population - Other (%)
Latest news about races in Somerset, NJ collected exclusively by city-data.com from local newspapers, TV, and radio stations
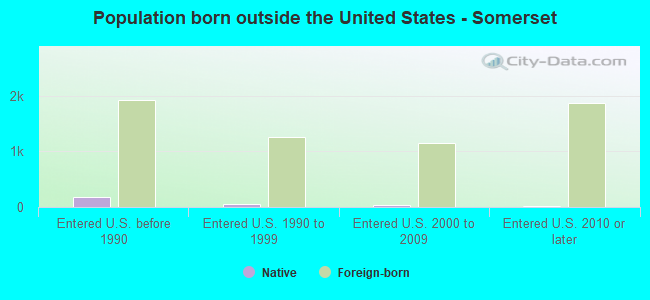
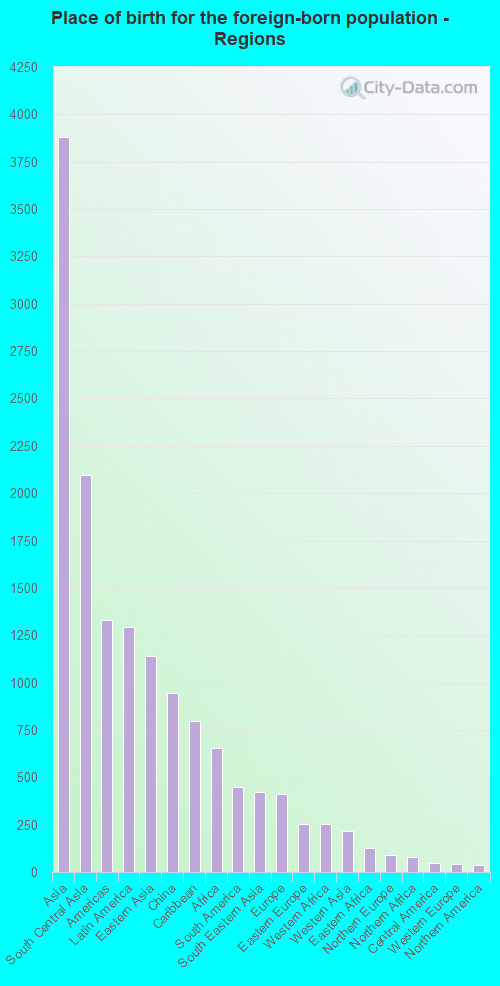
According to 2022 data, the most numerous races in Somerset, NJ are White alone (7,898 residents), Hispanic (2,757 residents), and Black alone (6,924 residents). 69.4% of Somerset residents speak English at home. 25.8% of Somerset, NJ residents are foreign-born (15.8% born in Asia, 5.3% born in Latin America, 2.7% born in Africa), which is 10.9% greater than the foreign-born rate of 23.0% across the entire state of New Jersey.
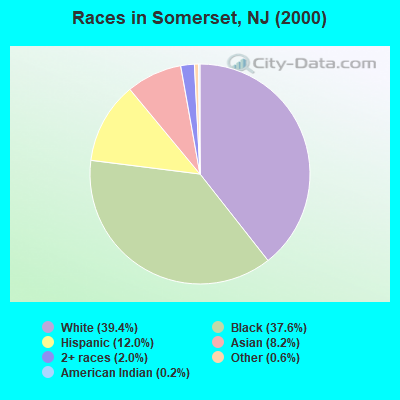
Race distribution in Somerset
2000 2022
5,557,209 66.0% White alone 1,117,191 13.3% Hispanic 1,096,171 13.0% Black alone 477,012 5.7% Asian alone 133,689 1.6% Two or more races 19,565 0.2% Other race alone 11,338 0.1% American Indian alone 2,175 0.03% Native Hawaiian and Other
4,766,476 51.5% White alone 2,028,470 21.9% Hispanic 1,111,632 12.0% Black alone 923,546 10.0% Asian alone 332,237 3.6% Two or more races 89,847 1.0% Other race alone 8,557 0.09% American Indian alone 934 0.01% Native Hawaiian and Other
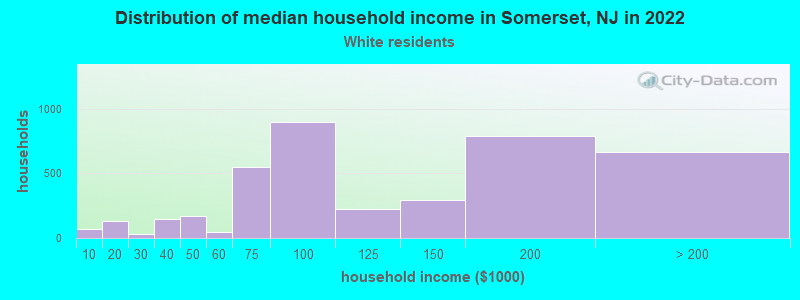
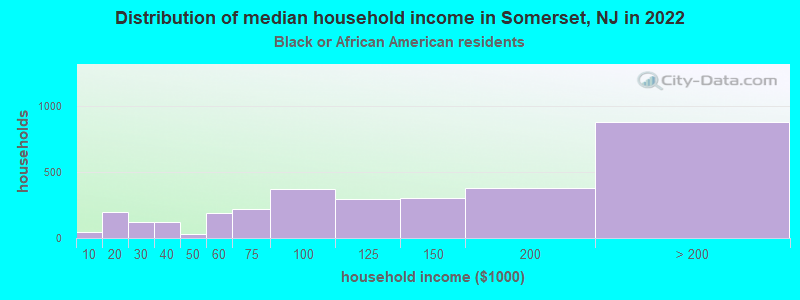
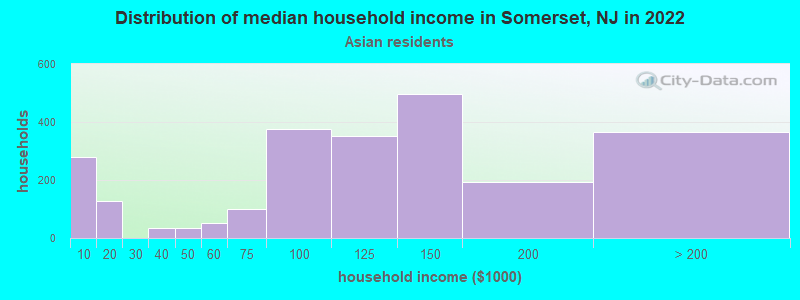
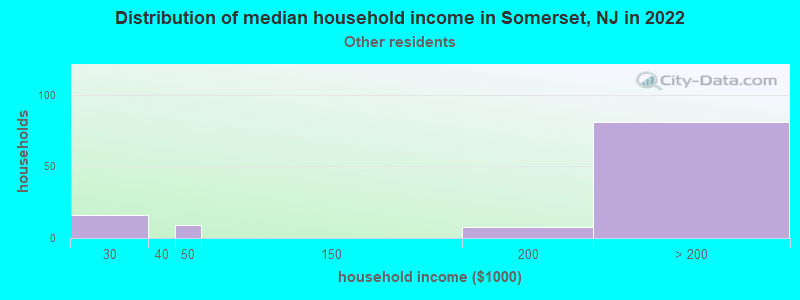
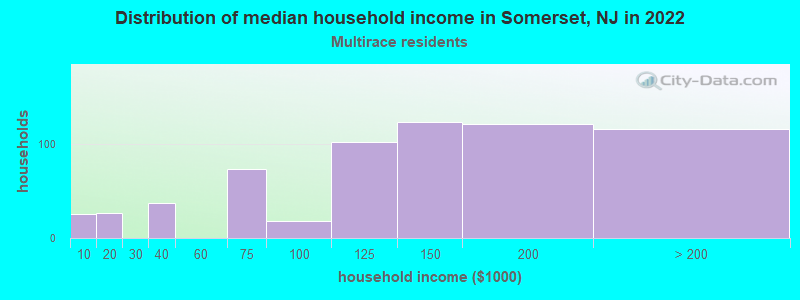
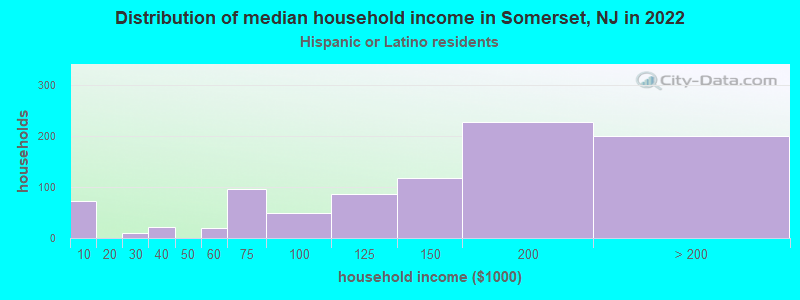
Income and house value in Somerset Median household income in 2022 $93,983 White non-Hispanic householders$119,232 Black householders$114,001 Asian householdersover $200,000 Some other race householders$151,913 Two or more races householders$171,563 Hispanic or Latino race householdersMedian 2022 house value $400,031 White Non-Hispanic householders$384,716 Black or African American householders $365,689 Asian householders$382,628 Some other race householders$358,264 Two or more races householders$366,385 Hispanic or Latino householders
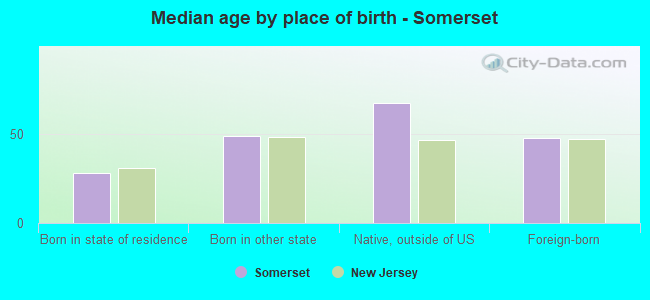
Median age by race in Somerset
46.2 Median age for White residents43.8 48.8 44.8 Median age for Black or African American residents43.3 45.5 -666,666,666.0 Median age for American Indian / Alaska Native residents-643,500,642.9 -1,220,338,981.8 37.1 Median age for Asian residents37.9 35.9 -804,177,544.9 Median age for Native Hawaiian / Pacific Islander residents-666,666,666.0 -713,070,378.3 38.6 Median age for Other race residents52.5 32.3 26.9 Median age for Two or more races residents25.7 33.1 48.2 Median age for White alone residents45.1 54.0 32.6 Median age for Hispanic or Latino residents34.9 28.9
Owner/renter occupied households by race in Somerset
House owners and renters - White residents 3,106 80.1% Owner occupied772 19.9% Renter occupiedHouse owners and renters - Black or African American residents 2,140 71.9% Owner occupied834 28.1% Renter occupiedHouse owners and renters - Asian residents 1,656 73.2% Owner occupied606 26.8% Renter occupiedHouse owners and renters - Other race residents 124 100.0% Owner occupiedHouse owners and renters - Two or more races residents 597 74.6% Owner occupied203 25.4% Renter occupiedHouse owners and renters - White alone residents 2,863 78.4% Owner occupied787 21.6% Renter occupiedHouse owners and renters - Hispanic or Latino residents 633 72.6% Owner occupied239 27.4% Renter occupied
Language usage in Somerset
English speakers - Total 69.4% of residents of Somerset speak English at home.
6.8% of residents speak Spanish at home 1,277 80.6% Speak English very well307 19.4% Speak English less than very well23.7% of residents speak other language at home 4,168 75.4% Speak English very well1,363 24.6% Speak English less than very well
English speakers - Born in the United States 81.9% of residents of Somerset speak English at home.
8.4% of residents speak Spanish at home 361 76.2% Speak English very well113 23.8% Speak English less than very well9.9% of residents speak other language at home 551 98.2% Speak English very well10 1.8% Speak English less than very well
English speakers - Native, born elsewhere 31.8% of residents of Somerset speak English at home.
55.8% of residents speak Spanish at home 140 85.9% Speak English very well23 14.1% Speak English less than very well7.9% of residents speak other language at home 23 100.0% Speak English very well
English speakers - Foreign-born 25.1% of residents of Somerset speak English at home.
7.7% of residents speak Spanish at home 307 64.6% Speak English very well168 35.4% Speak English less than very well68.8% of residents speak other language at home 2,967 70.1% Speak English very well1,265 29.9% Speak English less than very well
White (Caucasian) - Speak only English Native:
89.7% (6,698)Foreign-born:
22.3% (207)
White (Caucasian) - Speak another language Native:
10.3% (768)Foreign-born:
77.5% (719)
Black or African American - Speak only English Native:
94.6% (5,693)Foreign-born:
83.9% (974)
Black or African American - Speak another language Native:
4.5% (269)Foreign-born:
23.5% (273)
Asian - Speak only English Native:
60.9% (759)Foreign-born:
13.5% (499)
Asian - Speak another language Native:
35.2% (438)Foreign-born:
86.5% (3,206)
Other race - Speak only English Native:
14.3% (52)Foreign-born:
42.0% (16)
Other race - Speak another language Native:
89.5% (325)Foreign-born:
66.2% (26)
Two or more races - Speak only English Native:
86.1% (1,600)Foreign-born:
20.3% (57)
Two or more races - Speak another language Native:
14.8% (276)Foreign-born:
79.8% (225)
White alone - Speak only English Native:
92.5% (6,376)Foreign-born:
21.4% (165)
White alone - Speak another language Native:
7.8% (535)Foreign-born:
79.4% (610)
Hispanic or Latino - Speak only English Native:
50.6% (1,061)Foreign-born:
16.9% (86)
Hispanic or Latino - Speak another language Native:
49.1% (1,031)Foreign-born:
85.2% (436)
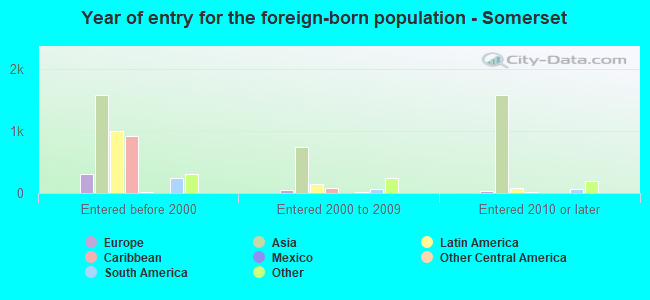
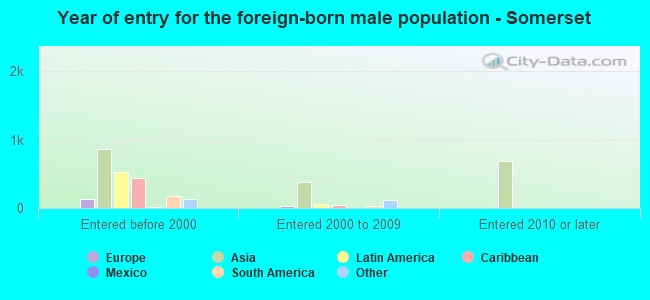
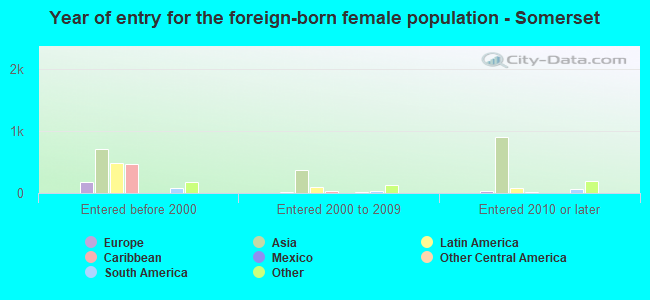
Foreign-born residents in Somerset 6,292 residents are foreign born (15.8% Asia , 5.3% Latin America , 2.7% Africa ).
This city:
25.8%New Jersey:
23.2%
Marital status for residents in Somerset Marital status - White (Caucasian) population 15 years and over
Males 35.0% Never married55.4% Now married0.4% Separated2.3% Widowed6.9% DivorcedFemales 24.1% Never married51.1% Now married0.7% Separated10.8% Widowed13.4% DivorcedWomen who gave birth in the past 12 months Now married:
100.0% (122)Unmarried:
0.0% (0)
Women who did not give birth in the past 12 months Now married:
52.0% (853)Unmarried:
48.0% (785)
Marital status - Black or African American population 15 years and over
Males 43.0% Never married45.1% Now married1.4% Separated6.8% Widowed3.7% DivorcedFemales 50.2% Never married26.4% Now married3.7% Separated9.5% Widowed10.2% DivorcedWomen who did not give birth in the past 12 months Now married:
18.2% (328)Unmarried:
81.8% (1,476)
Marital status - Asian population 15 years and over
Males 35.6% Never married60.3% Now married1.8% Separated1.5% Widowed0.9% DivorcedFemales 27.2% Never married61.6% Now married2.7% Separated2.4% Widowed6.1% DivorcedWomen who gave birth in the past 12 months Now married:
100.0% (138)Unmarried:
0.0% (0)
Women who did not give birth in the past 12 months Now married:
56.2% (740)Unmarried:
43.8% (577)
Marital status - Other race population 15 years and over
Males 0.0% Never married90.4% Now married0.0% Separated9.6% Widowed0.0% DivorcedFemales 42.9% Never married52.4% Now married0.0% Separated4.7% Widowed0.0% DivorcedWomen who did not give birth in the past 12 months Now married:
46.7% (59)Unmarried:
53.3% (67)
Marital status - Two or more races population 15 years and over
Males 54.7% Never married37.2% Now married0.0% Separated1.8% Widowed6.3% DivorcedFemales 20.1% Never married45.2% Now married0.0% Separated7.5% Widowed27.2% DivorcedWomen who gave birth in the past 12 months Now married:
0.0% (0)Unmarried:
100.0% (14)
Women who did not give birth in the past 12 months Now married:
53.6% (261)Unmarried:
46.4% (225)
Marital status - White alone, not Hispanic / Latino population 15 years and over
Males 36.8% Never married55.5% Now married0.1% Separated1.8% Widowed5.8% DivorcedFemales 25.0% Never married48.9% Now married0.6% Separated11.3% Widowed14.2% DivorcedWomen who gave birth in the past 12 months Now married:
100.0% (127)Unmarried:
0.0% (0)
Women who did not give birth in the past 12 months Now married:
47.1% (674)Unmarried:
52.9% (756)
Marital status - Hispanic or Latino population 15 years and over
Males 32.4% Never married49.6% Now married1.1% Separated4.7% Widowed12.2% DivorcedFemales 33.2% Never married51.4% Now married0.9% Separated5.7% Widowed8.9% DivorcedWomen who gave birth in the past 12 months Now married:
0.0% (0)Unmarried:
100.0% (9)
Women who did not give birth in the past 12 months Now married:
47.7% (330)Unmarried:
52.3% (361)
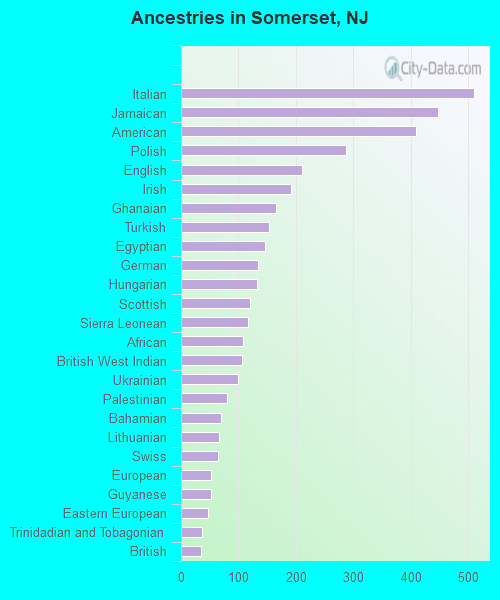
Ancestries in Somerset
511 3.7% Italian448 3.3% Jamaican409 3.0% American288 2.1% Polish211 1.5% English192 1.4% Irish166 1.2% Ghanaian154 1.1% Turkish146 1.1% Egyptian134 1.0% German133 1.0% Hungarian121 0.9% Scottish116 0.9% Sierra Leonean108 0.8% African106 0.8% British West Indian99 0.7% Ukrainian80 0.6% Palestinian70 0.5% Bahamian66 0.5% Lithuanian65 0.5% Swiss53 0.4% European52 0.4% Guyanese47 0.3% Eastern European37 0.3% Trinidadian and Tobagonian35 0.3% British23 0.2% Arab22 0.2% Slovene21 0.2% Russian21 0.2% Haitian20 0.1% Iranian19 0.1% Canadian19 0.1% Slovak18 0.1% Macedonian18 0.1% Brazilian16 0.1% Armenian13 0.10% Austrian13 0.10% Lebanese13 0.10% Latvian12 0.09% Syrian12 0.09% French8 0.06% Iraqi6 0.04% Northern European5 0.04% Croatian4 0.03% Scotch-Irish3 0.02% Dutch
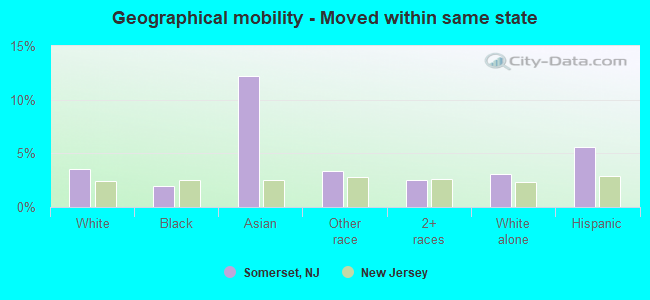
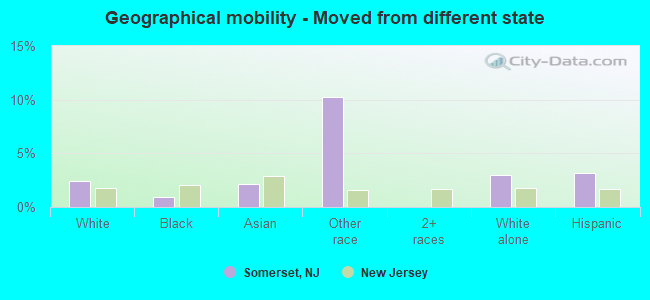
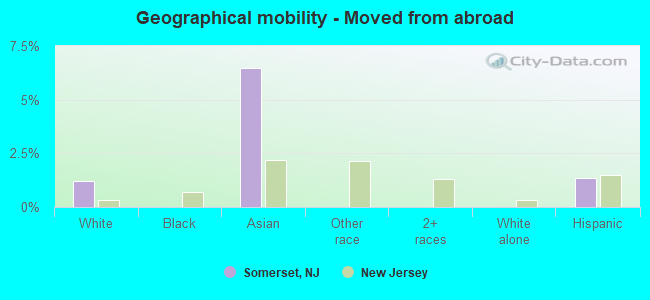
Geographical mobility in Somerset Same house 1 year ago 7,751 88.6% White (Caucasian)6,088 84.9% Black or African American4,017 77.3% Asian377 90.5% Other race2,293 93.9% Two or more races6,960 88.9% White alone, not Hispanic / Latino2,456 89.8% Hispanic or LatinoMoved within same county 233 2.7% White / Caucasian885 12.3% Black or African American103 2.0% Asian80 3.3% Two or more races244 3.1% White alone, not Hispanic / Latino23 0.8% Hispanic or LatinoMoved within same state 308 3.5% White / Caucasian142 2.0% Black or African American633 12.2% Asian14 3.3% Other race61 2.5% Two or more races240 3.1% White alone, not Hispanic / Latino152 5.6% Hispanic or LatinoMoved from different state 209 2.4% White / Caucasian64 0.9% Black or African American113 2.2% Asian42 10.2% Other race234 3.0% White alone, not Hispanic / Latino86 3.1% Hispanic or LatinoMoved from abroad 104 1.2% White336 6.5% Asian37 1.3% Hispanic or Latino
Children Nativity (place of birth) in Somerset
Children under 6 years - Living with two parents Both parents native 611 100.0% NativeBoth parents foreign-born 331 85.1% Native58 14.9% Foreign-bornOne native, one foreign-born parent 84 100.0% NativeChildren under 6 years - Living with one parent Native parent 237 100.0% NativeChildren 6 to 17 years - Living with two parents Both parents native 652 100.0% NativeBoth parents foreign-born 920 89.9% Native104 10.1% Foreign-bornOne native, one foreign-born parent 148 100.0% NativeChildren 6 to 17 years - Living with one parent Native parent 652 100.0% NativeForeign-born parent 274 56.0% Native215 44.0% Foreign-born
Grandparents responsible for own grandchildren in Somerset
Grandparents (30 to 59 years) White / Caucasian 11 100.0% Not responsible for grandchildrenAsian 31 100.0% Not responsible for grandchildrenWhite alone, not Hispanic / Latino 14 100.0% Not responsible for grandchildrenGrandparents (60 years and over) White / Caucasian 99 100.0% Not responsible for grandchildrenAsian 28 21.0% Responsible for grandchildren107 79.0% Not responsible for grandchildrenWhite alone, not Hispanic / Latino 102 100.0% Not responsible for grandchildren