Races in Somersworth, New Hampshire (NH) Detailed Stats
Ancestries, Foreign-born residents, place of birth
Settings
X


Recent posts about races in Somersworth, New Hampshire on our local forum with over 2,400,000 registered users:
 | Advice Needed: Selling a Home in Somersworth (45 replies) |
| Rochester and Somersworth Schools (12 replies) |
| Moving to New Hampshire (Lebanon, Hanover, Keene, Grantham, Plainfield, Enfield, Etna) (38 replies) |
| Thinking of moving to New Hampshire from WA (40 replies) |
| 10 worst places to live in New Hampshire (36 replies) |
| Moving from Florida to New Hampshire (44 replies) |
Latest news about races in Somersworth, NH collected exclusively by city-data.com from local newspapers, TV, and radio stations
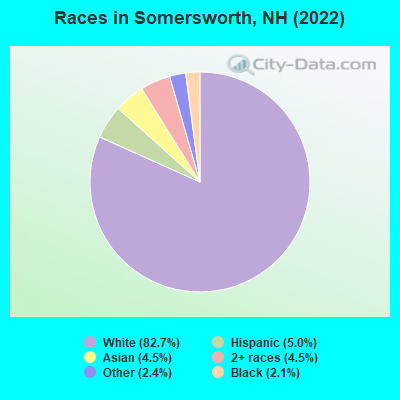
According to 2022 data, the most numerous races in Somersworth, NH are White alone (10,023 residents), Hispanic (606 residents), and Two or more races (544 residents). 92.4% of Somersworth residents speak English at home. 6.0% of Somersworth, NH residents are foreign-born (3.8% born in Asia, 1.0% born in Europe, 0.9% born in Latin America), which is 17.0% greater than the foreign-born rate of 5.0% across the entire state of New Hampshire.
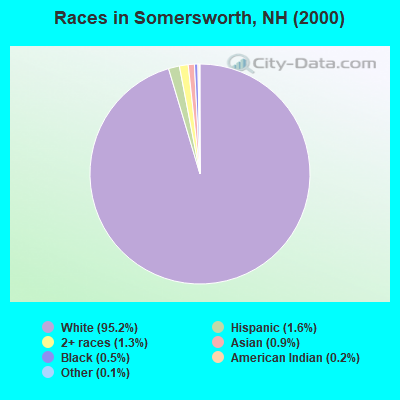
Race distribution in Somersworth
2000
2022

- 10,92995.2%White alone
- 1851.6%Hispanic
- 1521.3%Two or more races
- 1090.9%Asian alone
- 630.5%Black alone
- 220.2%American Indian alone
- 170.1%Other race alone
-
- 10,02382.7%White alone
- 6065.0%Hispanic
- 5444.5%Two or more races
- 5454.5%Asian alone
- 2882.4%Other race alone
- 2492.1%Black alone
- 40.03%American Indian alone
2000
2022
-
- 1,175,25295.1%White alone
- 20,4891.7%Hispanic
- 15,8031.3%Asian alone
- 11,6060.9%Two or more races
- 8,3540.7%Black alone
- 2,6980.2%American Indian alone
- 1,2540.1%Other race alone
- 3300.03%Native Hawaiian and Other
Pacific Islander alone

-
- 1,208,10186.6%White alone
- 63,4794.5%Hispanic
- 60,7244.4%Two or more races
- 36,5192.6%Asian alone
- 17,9311.3%Black alone
- 6,6150.5%Other race alone
- 1,0140.07%American Indian alone
- 8480.06%Native Hawaiian and Other
Pacific Islander alone

Income and house value in Somersworth
- Median household income in 2022
- $76,156White non-Hispanic householders
- $152,702Hispanic or Latino race householders
- Median 2022 house value
- $334,255White Non-Hispanic householders
- $655,716Black or African American householders
- $359,844Asian householders
- $271,882Native Hawaiian and other Pacific Islander householders
- over $1,000,000Some other race householders
- $395,349Two or more races householders
- over $1,000,000Hispanic or Latino householders
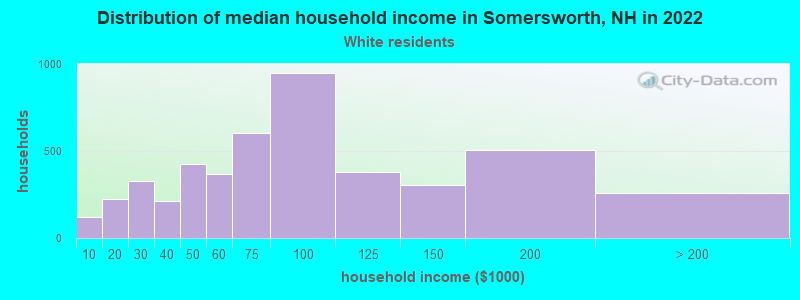
Household income for White non-Hispanic householders
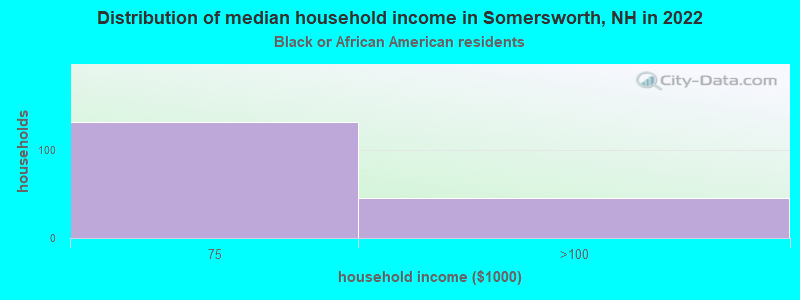
Household income for Black householders
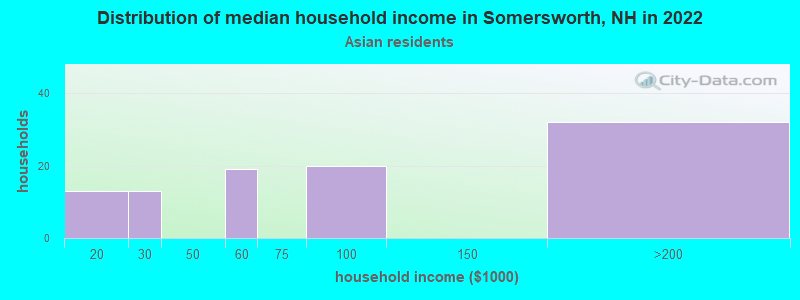
Household income for Asian householders
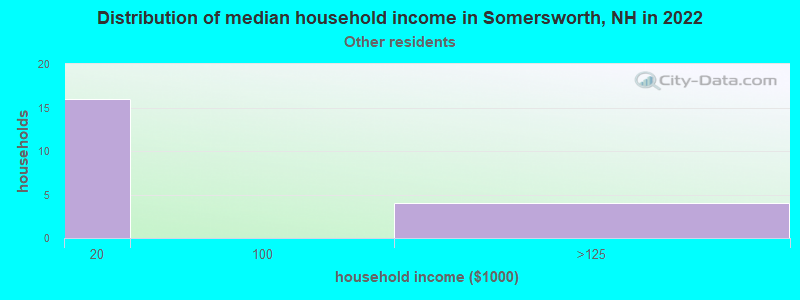
Household income for Some other race householders
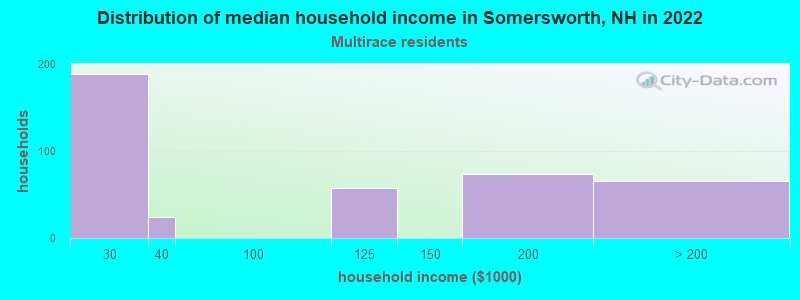
Household income for Two or more races householders
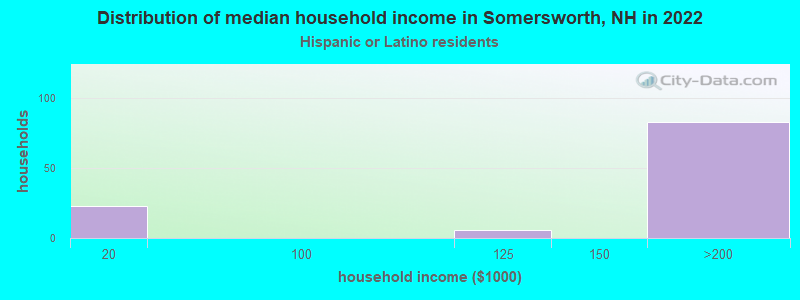
Household income for Hispanic or Latino race householders
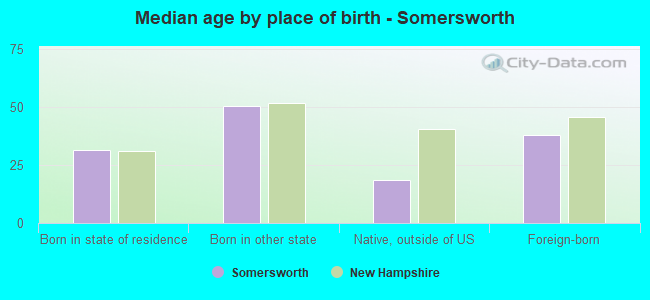
Median age by race in Somersworth
- 41.9Median age for White residents
- 39.0Males
- 44.6Females
- 36.4Median age for Black or African American residents
- -670,623,144.7Males
- 63.3Females
- -671,296,295.6Median age for American Indian / Alaska Native residents
- -772,357,722.8Males
- -763,157,894.0Females
- 47.5Median age for Asian residents
- 28.8Males
- 61.2Females
- -666,666,666.0Median age for Native Hawaiian / Pacific Islander residents
- -666,666,666.0Males
- -666,666,666.0Females
- 23.0Median age for Other race residents
- 1.7Males
- 22.8Females
- 27.5Median age for Two or more races residents
- 16.3Males
- 24.6Females
- 42.1Median age for White alone residents
- 39.3Males
- 44.1Females
- 33.7Median age for Hispanic or Latino residents
- 30.1Males
- 40.9Females
Owner/renter occupied households by race in Somersworth
- House owners and renters - White residents
- 3,06965.2%Owner occupied
- 1,63734.8%Renter occupied
- House owners and renters - Black or African American residents
- 13973.9%Owner occupied
- 4926.1%Renter occupied
- House owners and renters - American Indian / Alaska Native residents
- 6100.0%Renter occupied
- House owners and renters - Asian residents
- 8758.2%Owner occupied
- 6341.8%Renter occupied
- House owners and renters - Other race residents
- 516.5%Owner occupied
- 2783.5%Renter occupied
- House owners and renters - Two or more races residents
- 17875.4%Owner occupied
- 5824.6%Renter occupied
- House owners and renters - White alone residents
- 3,05365.6%Owner occupied
- 1,60434.4%Renter occupied
- House owners and renters - Hispanic or Latino residents
- 9168.2%Owner occupied
- 4231.8%Renter occupied
Language usage in Somersworth
- English speakers - Total
- 92.4% of residents of Somersworth speak English at home.
- 1.9% of residents speak Spanish at home
- 15568.3%Speak English very well
- 7231.7%Speak English less than very well
- 5.7% of residents speak other language at home
- 55483.6%Speak English very well
- 10916.4%Speak English less than very well
- English speakers - Born in the United States
- 95.7% of residents of Somersworth speak English at home.
- 1.9% of residents speak other language at home
- 93100.0%Speak English very well
- English speakers - Native, born elsewhere
- 49.0% of residents of Somersworth speak English at home.
- 16.1% of residents speak Spanish at home
- 56100.0%Speak English very well
- 17.9% of residents speak other language at home
- 3962.9%Speak English very well
- 2337.1%Speak English less than very well
- English speakers - Foreign-born
- 41.4% of residents of Somersworth speak English at home.
- 13.1% of residents speak Spanish at home
- 97.8%Speak English very well
- 10792.2%Speak English less than very well
- 49.3% of residents speak other language at home
- 33175.7%Speak English very well
- 10624.3%Speak English less than very well
White (Caucasian) - Speak only English
| Native: | 98.6% (9,496) |
| Foreign-born: | 59.0% (181) |
White (Caucasian) - Speak another language
| Native: | 1.5% (140) |
| Foreign-born: | 40.3% (124) |
Asian - Speak only English
| Native: | 93.8% (145) |
| Foreign-born: | 39.7% (153) |
Two or more races - Speak only English
| Native: | 87.1% (777) |
| Foreign-born: | 27.5% (14) |
Two or more races - Speak another language
| Native: | 12.4% (111) |
| Foreign-born: | 74.2% (38) |
White alone - Speak only English
| Native: | 98.5% (9,358) |
| Foreign-born: | 52.1% (151) |
White alone - Speak another language
| Native: | 1.5% (146) |
| Foreign-born: | 47.4% (137) |
Hispanic or Latino - Speak only English
| Native: | 74.7% (364) |
| Foreign-born: | 10.2% (12) |
Hispanic or Latino - Speak another language
| Native: | 20.9% (102) |
| Foreign-born: | 80.0% (92) |
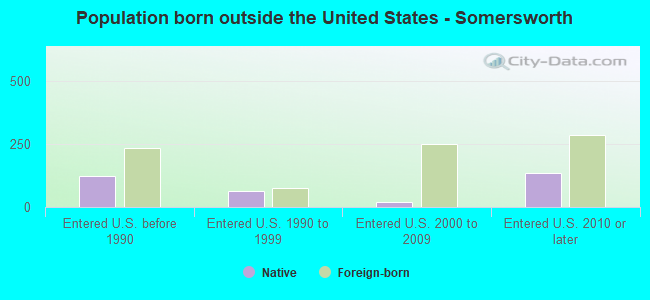
Foreign-born residents in Somersworth
730 residents are foreign born (3.8% Asia, 1.0% Europe, 0.9% Latin America).
| This city: | 6.0% |
| New Hampshire: | 6.0% |
Marital status for residents in Somersworth
Marital status - White (Caucasian) population 15 years and over
- Males
- 40.5%Never married
- 43.4%Now married
- 0.6%Separated
- 1.7%Widowed
- 13.8%Divorced
- Females
- 29.6%Never married
- 47.4%Now married
- 0.0%Separated
- 8.1%Widowed
- 14.8%Divorced
Women who gave birth in the past 12 months
| Now married: | 25.0% (30) |
| Unmarried: | 75.0% (89) |
Women who did not give birth in the past 12 months
| Now married: | 39.9% (892) |
| Unmarried: | 60.1% (1,342) |
Marital status - Black or African American population 15 years and over
- Males
- 0.0%Never married
- 100.0%Now married
- 0.0%Separated
- 0.0%Widowed
- 0.0%Divorced
- Females
- 33.3%Never married
- 28.1%Now married
- 0.0%Separated
- 0.0%Widowed
- 38.6%Divorced
Women who did not give birth in the past 12 months
| Now married: | 0.0% (0) |
| Unmarried: | 100.0% (37) |
Marital status - Asian population 15 years and over
- Males
- 74.5%Never married
- 25.5%Now married
- 0.0%Separated
- 0.0%Widowed
- 0.0%Divorced
- Females
- 0.0%Never married
- 68.6%Now married
- 5.5%Separated
- 4.7%Widowed
- 21.2%Divorced
Women who did not give birth in the past 12 months
| Now married: | 100.0% (165) |
| Unmarried: | 0.0% (0) |
Marital status - Other race population 15 years and over
- Males
- 14.3%Never married
- 85.7%Now married
- 0.0%Separated
- 0.0%Widowed
- 0.0%Divorced
- Females
- 7.7%Never married
- 90.1%Now married
- 0.0%Separated
- 2.2%Widowed
- 0.0%Divorced
Women who gave birth in the past 12 months
| Now married: | 100.0% (87) |
| Unmarried: | 0.0% (0) |
Women who did not give birth in the past 12 months
| Now married: | 82.5% (59) |
| Unmarried: | 17.5% (12) |
Marital status - Two or more races population 15 years and over
- Males
- 30.1%Never married
- 42.7%Now married
- 0.0%Separated
- 0.0%Widowed
- 27.2%Divorced
- Females
- 57.0%Never married
- 14.3%Now married
- 0.0%Separated
- 0.0%Widowed
- 28.7%Divorced
Women who gave birth in the past 12 months
| Now married: | 100.0% (30) |
| Unmarried: | 0.0% (0) |
Women who did not give birth in the past 12 months
| Now married: | 0.0% (0) |
| Unmarried: | 100.0% (348) |
Marital status - White alone, not Hispanic / Latino population 15 years and over
- Males
- 41.5%Never married
- 43.4%Now married
- 0.7%Separated
- 1.7%Widowed
- 12.7%Divorced
- Females
- 30.0%Never married
- 46.7%Now married
- 0.0%Separated
- 8.2%Widowed
- 15.0%Divorced
Women who gave birth in the past 12 months
| Now married: | 25.0% (30) |
| Unmarried: | 75.0% (90) |
Women who did not give birth in the past 12 months
| Now married: | 39.0% (864) |
| Unmarried: | 61.0% (1,351) |
Marital status - Hispanic or Latino population 15 years and over
- Males
- 19.4%Never married
- 30.8%Now married
- 0.0%Separated
- 0.0%Widowed
- 49.8%Divorced
- Females
- 4.1%Never married
- 55.0%Now married
- 0.0%Separated
- 1.2%Widowed
- 39.8%Divorced
Women who did not give birth in the past 12 months
| Now married: | 47.9% (75) |
| Unmarried: | 52.1% (81) |
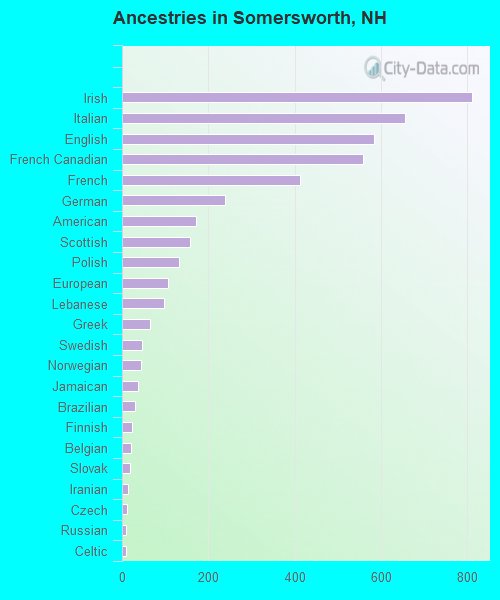
Ancestries in Somersworth

- 81016.4%Irish
- 65613.3%Italian
- 58311.8%English
- 55911.3%French Canadian
- 4128.3%French
- 2394.8%German
- 1713.5%American
- 1583.2%Scottish
- 1332.7%Polish
- 1062.1%European
- 982.0%Lebanese
- 651.3%Greek
- 460.9%Swedish
- 450.9%Norwegian
- 380.8%Jamaican
- 300.6%Brazilian
- 230.5%Finnish
- 200.4%Belgian
- 180.4%Slovak
- 130.3%Iranian
- 120.2%Czech
- 100.2%Russian
- 90.2%Celtic
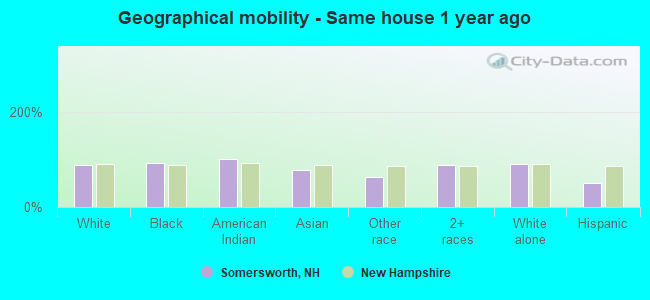
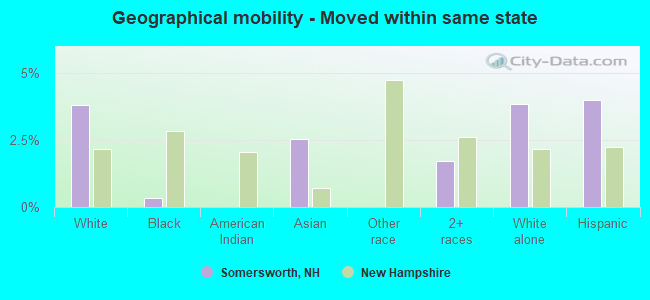
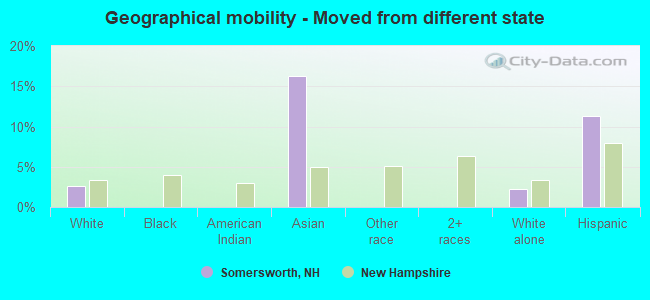
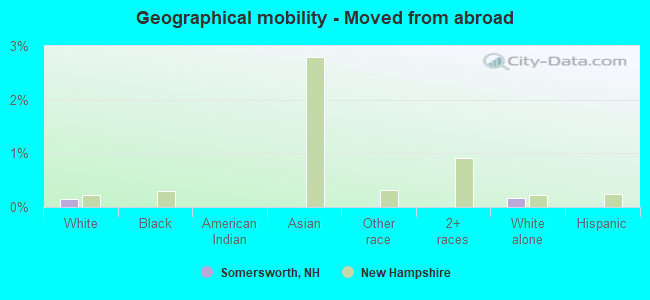
Geographical mobility in Somersworth

- Same house 1 year ago
- 9,03589.5%White (Caucasian)
- 20392.2%Black or African American
- 7100.0%American Indian / Alaska Native
- 41676.7%Asian
- 17662.0%Other race
- 81187.8%Two or more races
- 8,93389.7%White alone, not Hispanic / Latino
- 30350.5%Hispanic or Latino
-
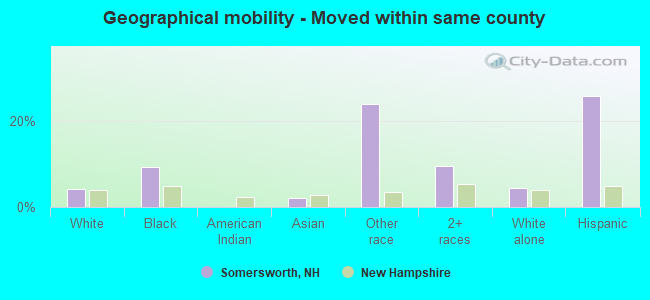
- Moved within same county
- 4324.3%White / Caucasian
- 219.4%Black or African American
- 112.1%Asian
- 6823.9%Other race
- 899.6%Two or more races
- 4354.4%White alone, not Hispanic / Latino
- 15525.8%Hispanic or Latino
-
- Moved within same state
- 3863.8%White / Caucasian
- 10.3%Black or African American
- 142.5%Asian
- 161.7%Two or more races
- 3833.8%White alone, not Hispanic / Latino
- 244.0%Hispanic or Latino
-
- Moved from different state
- 2692.7%White / Caucasian
- 8816.3%Asian
- 2272.3%White alone, not Hispanic / Latino
- 6811.3%Hispanic or Latino
-
- Moved from abroad
- 140.1%White
- 160.2%White alone, not Hispanic / Latino
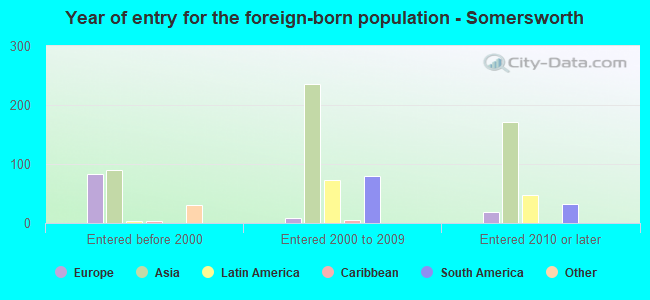
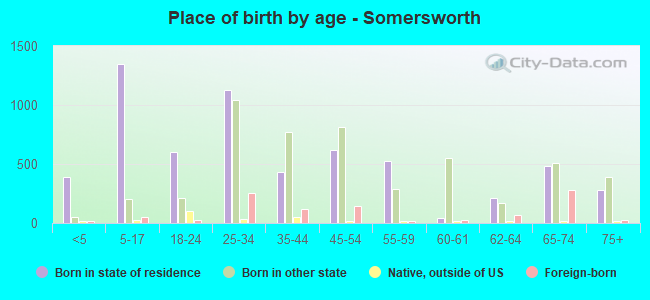
Children Nativity (place of birth) in Somersworth
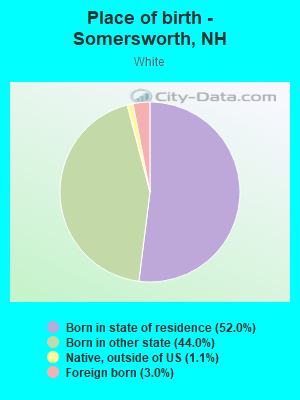
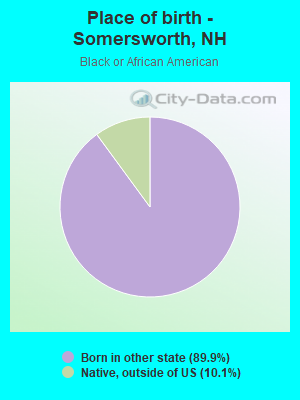
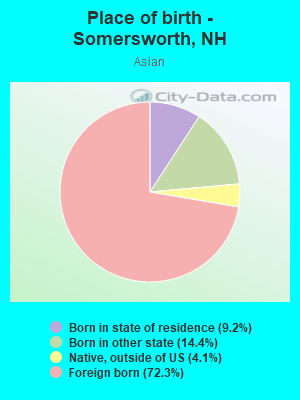
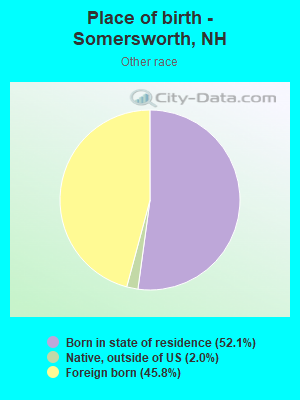
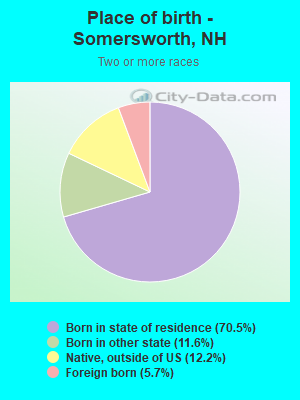
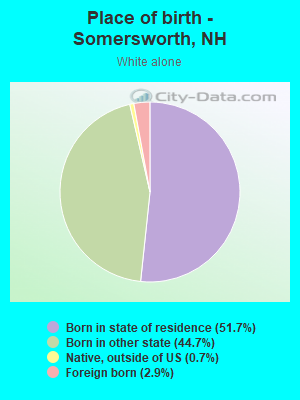
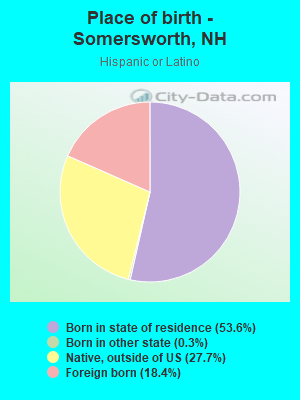
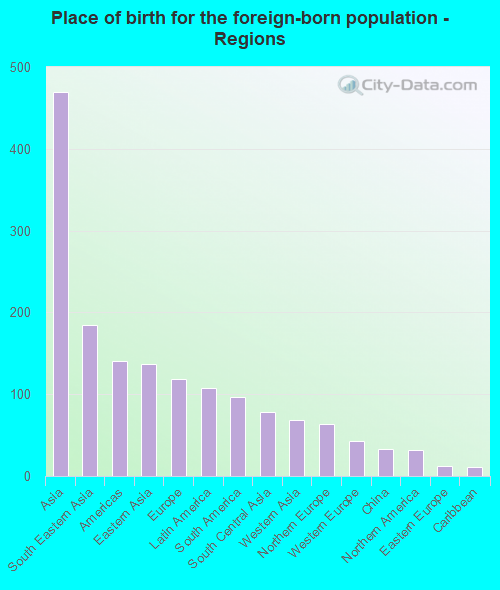
Place of birth for residents in Somersworth
![Place of birth for the foreign-born population - Regions]()
- 470Asia
- 184South Eastern Asia
- 140Americas
- 137Eastern Asia
- 119Europe
- 108Latin America
- 96South America
- 78South Central Asia
- 69Western Asia
- 63Northern Europe
- 43Western Europe
- 33China
- 32Northern America
- 12Eastern Europe
- 11Caribbean
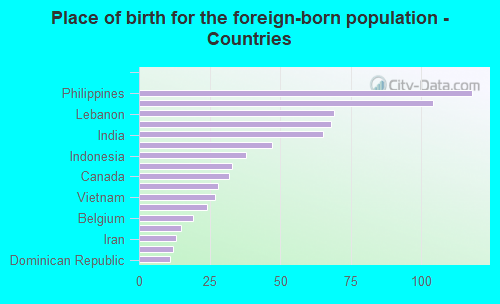
![Place of birth for the foreign-born population - Countries]()
- 118Philippines
- 104Japan
- 69Lebanon
- 68Ecuador
- 65India
- 47Ireland
- 38Indonesia
- 33China
- 32Canada
- 28Brazil
- 27Vietnam
- 24Germany
- 19Belgium
- 15Scotland
- 13Iran
- 12Russia
- 11Dominican Republic
Zip codes: 03878.