Races in South Amboy, New Jersey (NJ) Detailed Stats
Data:
Races - White alone (%)
Races - White alone (% change since 2000)
Races - Black alone (%)
Races - Black alone (% change since 2000)
Races - American Indian alone (%)
Races - American Indian alone (% change since 2000)
Races - Asian alone (%)
Races - Asian alone (% change since 2000)
Races - Hispanic (%)
Races - Hispanic (% change since 2000)
Races - Native Hawaiian and Other Pacific Islander alone (%)
Races - Native Hawaiian and Other Pacific Islander alone (% change since 2000)
Races - Two or more races(%)
Races - Two or more races(% change since 2000)
Races - Other race alone (%)
Races - Other race alone (% change since 2000)
Racial diversity
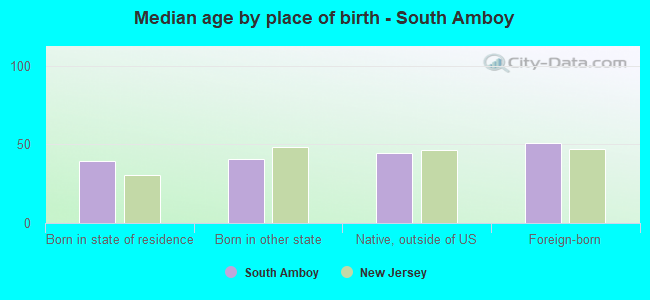
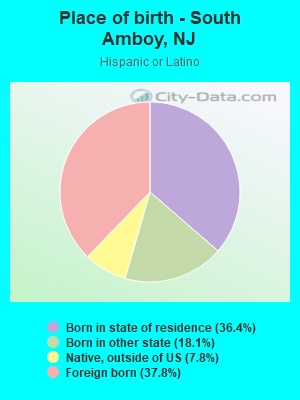
Place of birth - Born in state of residence (%)
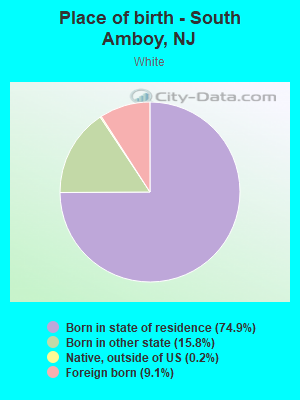
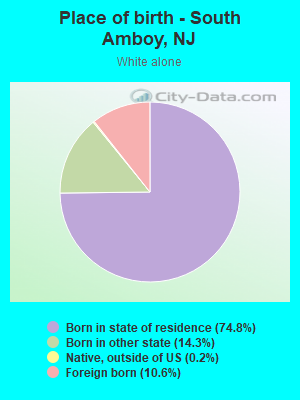
Place of birth - Born in state of residence (%) - White
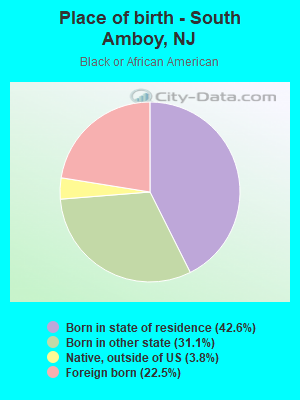
Place of birth - Born in state of residence (%) - Black or African American
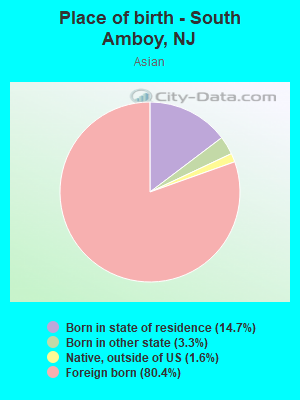
Place of birth - Born in state of residence (%) - Asian
Place of birth - Born in state of residence (%) - Hispanic or Latino
Place of birth - Born in state of residence (%) - American Indian and Alaska Native
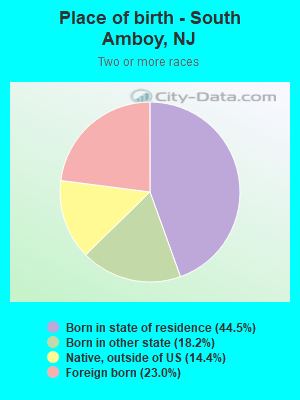
Place of birth - Born in state of residence (%) - Multirace
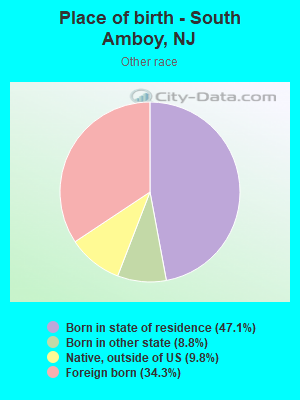
Place of birth - Born in state of residence (%) - Other Race
Place of birth - Born in other state (%)
Place of birth - Born in other state (%) - White
Place of birth - Born in other state (%) - Black or African American
Place of birth - Born in other state (%) - Asian
Place of birth - Born in other state (%) - Hispanic or Latino
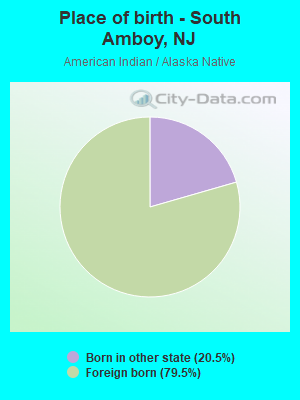
Place of birth - Born in other state (%) - American Indian and Alaska Native
Place of birth - Born in other state (%) - Multirace
Place of birth - Born in other state (%) - Other Race
Place of birth - Native, outside of US (%)
Place of birth - Native, outside of US (%) - White
Place of birth - Native, outside of US (%) - Black or African American
Place of birth - Native, outside of US (%) - Asian
Place of birth - Native, outside of US (%) - Hispanic or Latino
Place of birth - Native, outside of US (%) - American Indian and Alaska Native
Place of birth - Native, outside of US (%) - Multirace
Place of birth - Native, outside of US (%) - Other Race
Place of birth - Foreign born (%)
Place of birth - Foreign born (%) - White
Place of birth - Foreign born (%) - Black or African American
Place of birth - Foreign born (%) - Asian
Place of birth - Foreign born (%) - Hispanic or Latino
Place of birth - Foreign born (%) - American Indian and Alaska Native
Place of birth - Foreign born (%) - Multirace
Place of birth - Foreign born (%) - Other Race
Residents speaking English at home (%)
Residents speaking English at home - Born in the United States (%)
Residents speaking English at home - Native, born elsewhere (%)
Residents speaking English at home - Foreign born (%)
Residents speaking Spanish at home (%)
Residents speaking Spanish at home - Born in the United States (%)
Residents speaking Spanish at home - Native, born elsewhere (%)
Residents speaking Spanish at home - Foreign born (%)
Residents speaking other language at home (%)
Residents speaking other language at home - Born in the United States (%)
Residents speaking other language at home - Native, born elsewhere (%)
Residents speaking other language at home - Foreign born (%)
Marital status - Never married (%)
Marital status - Now married (%)
Marital status - Separated (%)
Marital status - Widowed (%)
Marital status - Divorced (%)
Ancestries Reported - Arab (%)
Ancestries Reported - Czech (%)
Ancestries Reported - Danish (%)
Ancestries Reported - Dutch (%)
Ancestries Reported - English (%)
Ancestries Reported - French (%)
Ancestries Reported - French Canadian (%)
Ancestries Reported - German (%)
Ancestries Reported - Greek (%)
Ancestries Reported - Hungarian (%)
Ancestries Reported - Irish (%)
Ancestries Reported - Italian (%)
Ancestries Reported - Lithuanian (%)
Ancestries Reported - Norwegian (%)
Ancestries Reported - Polish (%)
Ancestries Reported - Portuguese (%)
Ancestries Reported - Russian (%)
Ancestries Reported - Scotch-Irish (%)
Ancestries Reported - Scottish (%)
Ancestries Reported - Slovak (%)
Ancestries Reported - Subsaharan African (%)
Ancestries Reported - Swedish (%)
Ancestries Reported - Swiss (%)
Ancestries Reported - Ukrainian (%)
Ancestries Reported - United States (%)
Ancestries Reported - Welsh (%)
Ancestries Reported - West Indian (%)
Ancestries Reported - Other (%)
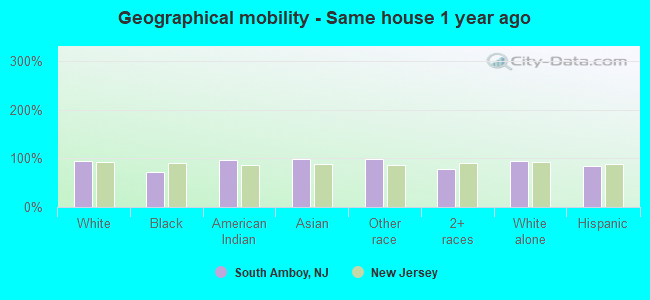
Geographical mobility - Same house 1 year ago (%)
Geographical mobility - Same house 1 year ago (%) - White
Geographical mobility - Same house 1 year ago (%) - Black or African American
Geographical mobility - Same house 1 year ago (%) - Asian
Geographical mobility - Same house 1 year ago (%) - Hispanic or Latino
Geographical mobility - Same house 1 year ago (%) - American Indian and Alaska Native
Geographical mobility - Same house 1 year ago (%) - Multirace
Geographical mobility - Same house 1 year ago (%) - Other Race
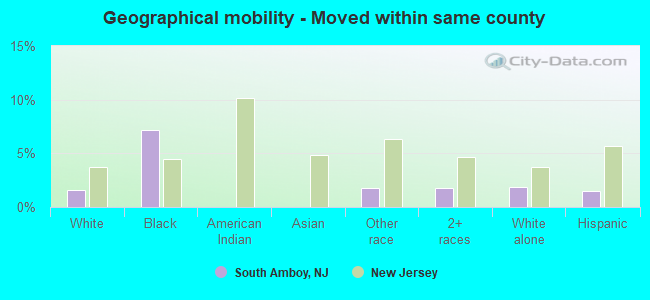
Geographical mobility - Moved within same county (%)
Geographical mobility - Moved within same county (%) - White
Geographical mobility - Moved within same county (%) - Black or African American
Geographical mobility - Moved within same county (%) - Asian
Geographical mobility - Moved within same county (%) - Hispanic or Latino
Geographical mobility - Moved within same county (%) - American Indian and Alaska Native
Geographical mobility - Moved within same county (%) - Multirace
Geographical mobility - Moved within same county (%) - Other Race
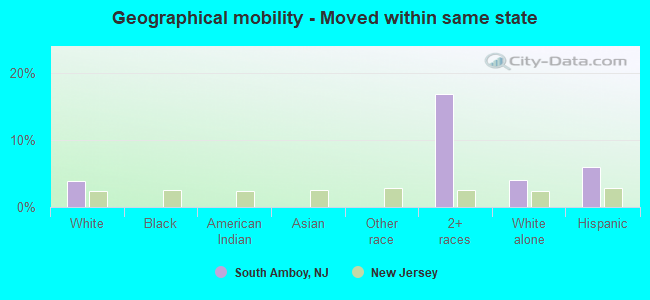
Geographical mobility - Moved from different county within same state (%)
Geographical mobility - Moved from different county within same state (%) - White
Geographical mobility - Moved from different county within same state (%) - Black or African American
Geographical mobility - Moved from different county within same state (%) - Asian
Geographical mobility - Moved from different county within same state (%) - Hispanic or Latino
Geographical mobility - Moved from different county within same state (%) - American Indian and Alaska Native
Geographical mobility - Moved from different county within same state (%) - Multirace
Geographical mobility - Moved from different county within same state (%) - Other Race
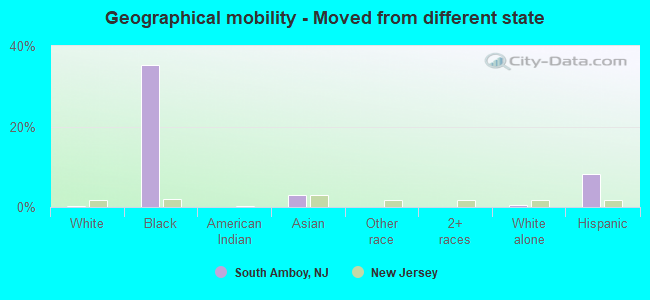
Geographical mobility - Moved from different state (%)
Geographical mobility - Moved from different state (%) - White
Geographical mobility - Moved from different state (%) - Black or African American
Geographical mobility - Moved from different state (%) - Asian
Geographical mobility - Moved from different state (%) - Hispanic or Latino
Geographical mobility - Moved from different state (%) - American Indian and Alaska Native
Geographical mobility - Moved from different state (%) - Multirace
Geographical mobility - Moved from different state (%) - Other Race
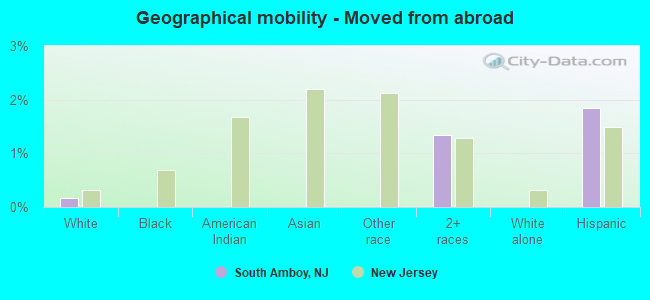
Geographical mobility - Moved from abroad (%)
Geographical mobility - Moved from abroad (%) - White
Geographical mobility - Moved from abroad (%) - Black or African American
Geographical mobility - Moved from abroad (%) - Asian
Geographical mobility - Moved from abroad (%) - Hispanic or Latino
Geographical mobility - Moved from abroad (%) - American Indian and Alaska Native
Geographical mobility - Moved from abroad (%) - Multirace
Geographical mobility - Moved from abroad (%) - Other Race
Place of birth for the foreign-born population - Ireland (%)
Place of birth for the foreign-born population - Denmark (%)
Place of birth for the foreign-born population - Norway (%)
Place of birth for the foreign-born population - Sweden (%)
Place of birth for the foreign-born population - United Kingdom (%)
Place of birth for the foreign-born population - England (%)
Place of birth for the foreign-born population - Scotland (%)
Place of birth for the foreign-born population - Other Northern Europe (%)
Place of birth for the foreign-born population - Austria (%)
Place of birth for the foreign-born population - Belgium (%)
Place of birth for the foreign-born population - France (%)
Place of birth for the foreign-born population - Germany (%)
Place of birth for the foreign-born population - Netherlands (%)
Place of birth for the foreign-born population - Switzerland (%)
Place of birth for the foreign-born population - Other Western Europe (%)
Place of birth for the foreign-born population - Greece (%)
Place of birth for the foreign-born population - Italy (%)
Place of birth for the foreign-born population - Portugal (%)
Place of birth for the foreign-born population - Spain (%)
Place of birth for the foreign-born population - Other Southern Europe (%)
Place of birth for the foreign-born population - Albania (%)
Place of birth for the foreign-born population - Belarus (%)
Place of birth for the foreign-born population - Bosnia and Herzegovina (%)
Place of birth for the foreign-born population - Bulgaria (%)
Place of birth for the foreign-born population - Croatia (%)
Place of birth for the foreign-born population - Czechoslovakia (%)
Place of birth for the foreign-born population - Hungary (%)
Place of birth for the foreign-born population - Latvia (%)
Place of birth for the foreign-born population - Lithuania (%)
Place of birth for the foreign-born population - North Macedonia (Macedonia) (%)
Place of birth for the foreign-born population - Moldova (%)
Place of birth for the foreign-born population - Poland (%)
Place of birth for the foreign-born population - Romania (%)
Place of birth for the foreign-born population - Russia (%)
Place of birth for the foreign-born population - Serbia (%)
Place of birth for the foreign-born population - Ukraine (%)
Place of birth for the foreign-born population - Other Eastern Europe (%)
Place of birth for the foreign-born population - China (%)
Place of birth for the foreign-born population - Hong Kong (%)
Place of birth for the foreign-born population - Taiwan (%)
Place of birth for the foreign-born population - Japan (%)
Place of birth for the foreign-born population - Korea (%)
Place of birth for the foreign-born population - Other Eastern Asia (%)
Place of birth for the foreign-born population - Afghanistan (%)
Place of birth for the foreign-born population - Bangladesh (%)
Place of birth for the foreign-born population - India (%)
Place of birth for the foreign-born population - Iran (%)
Place of birth for the foreign-born population - Kazakhstan (%)
Place of birth for the foreign-born population - Nepal (%)
Place of birth for the foreign-born population - Pakistan (%)
Place of birth for the foreign-born population - Sri Lanka (%)
Place of birth for the foreign-born population - Uzbekistan (%)
Place of birth for the foreign-born population - Other South Central Asia (%)
Place of birth for the foreign-born population - Burma (%)
Place of birth for the foreign-born population - Cambodia (%)
Place of birth for the foreign-born population - Indonesia (%)
Place of birth for the foreign-born population - Laos (%)
Place of birth for the foreign-born population - Malaysia (%)
Place of birth for the foreign-born population - Philippines (%)
Place of birth for the foreign-born population - Singapore (%)
Place of birth for the foreign-born population - Thailand (%)
Place of birth for the foreign-born population - Vietnam (%)
Place of birth for the foreign-born population - Other South Eastern Asia (%)
Place of birth for the foreign-born population - Armenia (%)
Place of birth for the foreign-born population - Iraq (%)
Place of birth for the foreign-born population - Israel (%)
Place of birth for the foreign-born population - Jordan (%)
Place of birth for the foreign-born population - Kuwait (%)
Place of birth for the foreign-born population - Lebanon (%)
Place of birth for the foreign-born population - Saudi Arabia (%)
Place of birth for the foreign-born population - Syria (%)
Place of birth for the foreign-born population - Turkey (%)
Place of birth for the foreign-born population - Yemen (%)
Place of birth for the foreign-born population - Other Western Asia (%)
Place of birth for the foreign-born population - Eritrea (%)
Place of birth for the foreign-born population - Ethiopia (%)
Place of birth for the foreign-born population - Kenya (%)
Place of birth for the foreign-born population - Somalia (%)
Place of birth for the foreign-born population - Uganda (%)
Place of birth for the foreign-born population - Zimbabwe (%)
Place of birth for the foreign-born population - Other Eastern Africa (%)
Place of birth for the foreign-born population - Cameroon (%)
Place of birth for the foreign-born population - Congo (%)
Place of birth for the foreign-born population - Democratic Republic of Congo (Zaire) (%)
Place of birth for the foreign-born population - Other Middle Africa (%)
Place of birth for the foreign-born population - Egypt (%)
Place of birth for the foreign-born population - Morocco (%)
Place of birth for the foreign-born population - Sudan (%)
Place of birth for the foreign-born population - Other Northern Africa (%)
Place of birth for the foreign-born population - South Africa (%)
Place of birth for the foreign-born population - Other Southern Africa (%)
Place of birth for the foreign-born population - Cabo Verde (%)
Place of birth for the foreign-born population - Ghana (%)
Place of birth for the foreign-born population - Liberia (%)
Place of birth for the foreign-born population - Nigeria (%)
Place of birth for the foreign-born population - Senegal (%)
Place of birth for the foreign-born population - Sierra Leone (%)
Place of birth for the foreign-born population - Other Western Africa (%)
Place of birth for the foreign-born population - Australia (%)
Place of birth for the foreign-born population - New Zealand (%)
Place of birth for the foreign-born population - Fiji (%)
Place of birth for the foreign-born population - Micronesia (%)
Place of birth for the foreign-born population - Bahamas (%)
Place of birth for the foreign-born population - Barbados (%)
Place of birth for the foreign-born population - Cuba (%)
Place of birth for the foreign-born population - Dominica (%)
Place of birth for the foreign-born population - Dominican Republic (%)
Place of birth for the foreign-born population - Grenada (%)
Place of birth for the foreign-born population - Haiti (%)
Place of birth for the foreign-born population - Jamaica (%)
Place of birth for the foreign-born population - St. Vincent and the Grenadines (%)
Place of birth for the foreign-born population - Trinidad and Tobago (%)
Place of birth for the foreign-born population - West Indies (%)
Place of birth for the foreign-born population - Other Caribbean (%)
Place of birth for the foreign-born population - Belize (%)
Place of birth for the foreign-born population - Costa Rica (%)
Place of birth for the foreign-born population - El Salvador (%)
Place of birth for the foreign-born population - Guatemala (%)
Place of birth for the foreign-born population - Honduras (%)
Place of birth for the foreign-born population - Mexico (%)
Place of birth for the foreign-born population - Nicaragua (%)
Place of birth for the foreign-born population - Panama (%)
Place of birth for the foreign-born population - Other Central America (%)
Place of birth for the foreign-born population - Argentina (%)
Place of birth for the foreign-born population - Bolivia (%)
Place of birth for the foreign-born population - Brazil (%)
Place of birth for the foreign-born population - Chile (%)
Place of birth for the foreign-born population - Colombia (%)
Place of birth for the foreign-born population - Ecuador (%)
Place of birth for the foreign-born population - Guyana (%)
Place of birth for the foreign-born population - Peru (%)
Place of birth for the foreign-born population - Uruguay (%)
Place of birth for the foreign-born population - Venezuela (%)
Place of birth for the foreign-born population - Other South America (%)
Place of birth for the foreign-born population - Canada (%)
Place of birth for the foreign-born population - Other Northern America (%)
Place of birth for the foreign-born population - Other (%)
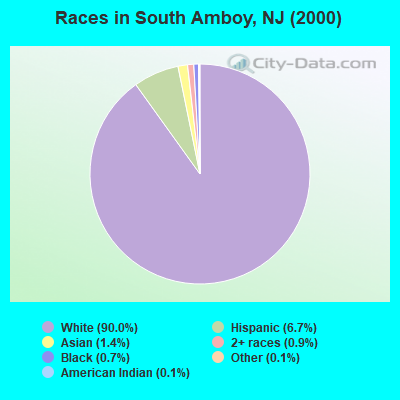
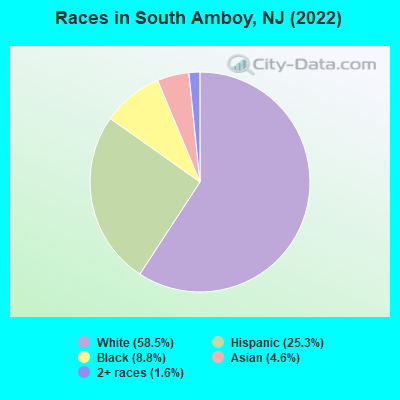
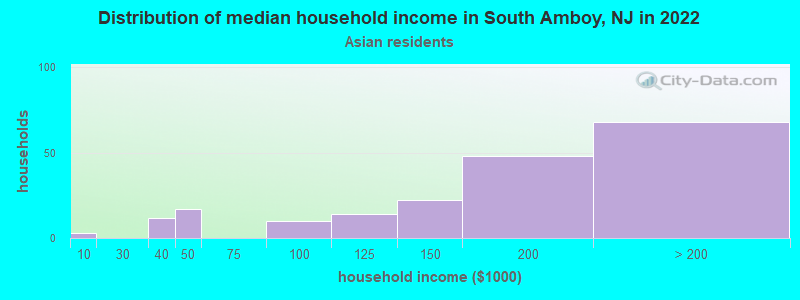
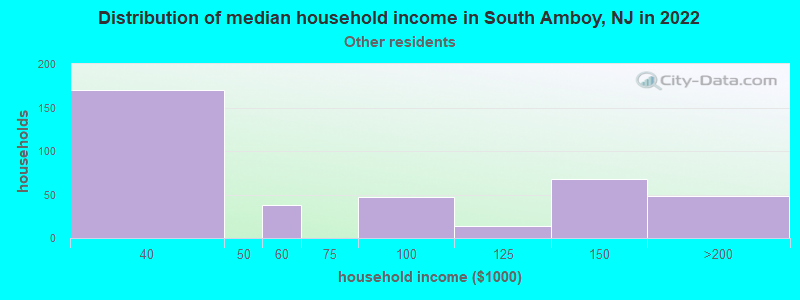
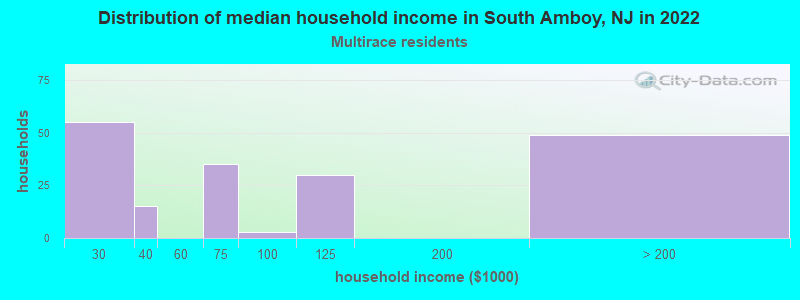
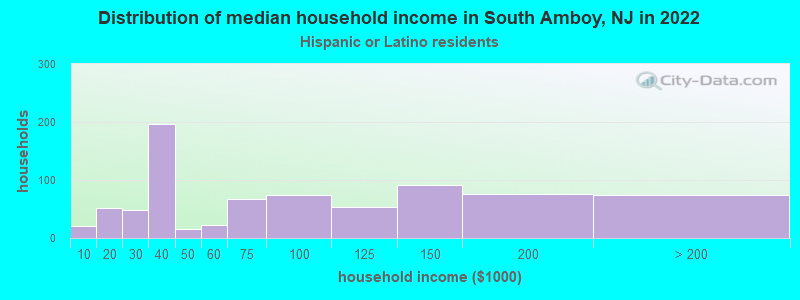
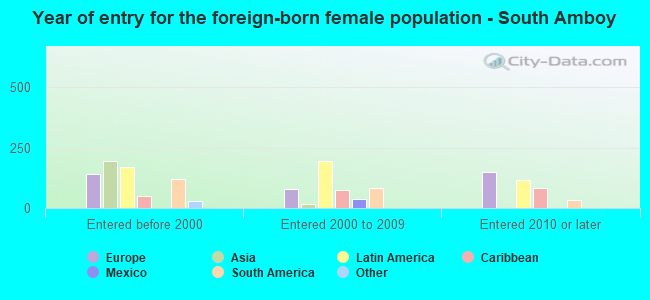
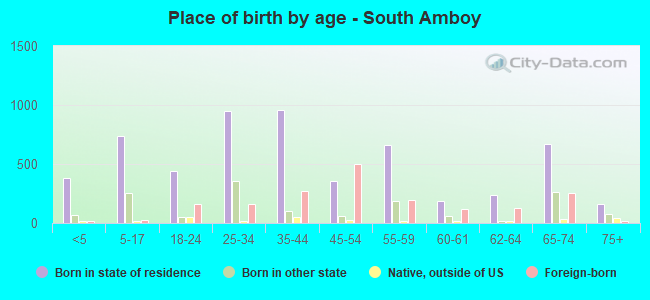
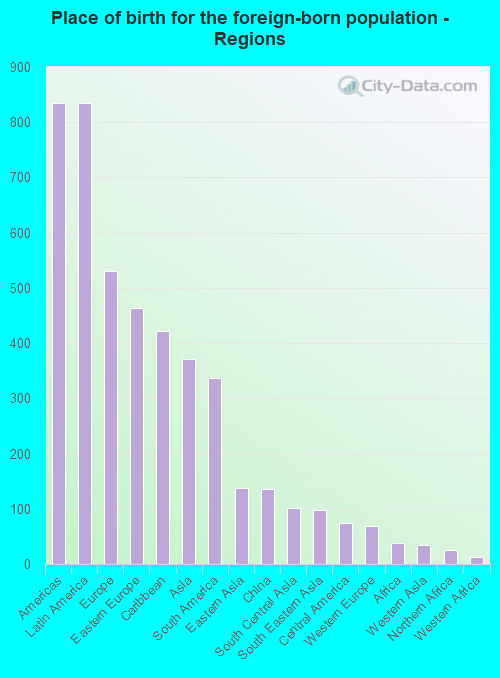
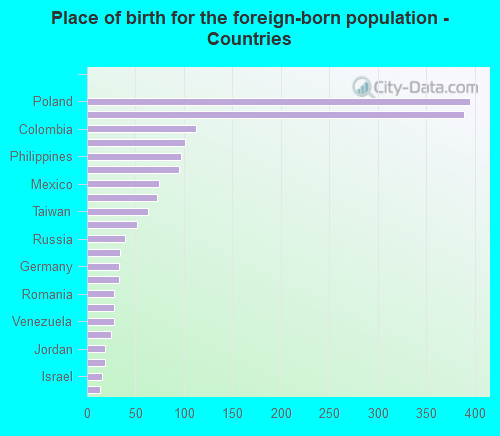
According to 2022 data, the most numerous races in South Amboy, NJ are White alone (5,473 residents), Hispanic (2,362 residents), and Black alone (826 residents). 71.3% of South Amboy residents speak English at home. 19.0% of South Amboy, NJ residents are foreign-born (8.8% born in Latin America, 5.6% born in Europe, 3.9% born in Asia), which is 21.0% less than the foreign-born rate of 23.0% across the entire state of New Jersey.
Race distribution in South Amboy
2000 2022
5,557,209 66.0% White alone 1,117,191 13.3% Hispanic 1,096,171 13.0% Black alone 477,012 5.7% Asian alone 133,689 1.6% Two or more races 19,565 0.2% Other race alone 11,338 0.1% American Indian alone 2,175 0.03% Native Hawaiian and Other
4,766,476 51.5% White alone 2,028,470 21.9% Hispanic 1,111,632 12.0% Black alone 923,546 10.0% Asian alone 332,237 3.6% Two or more races 89,847 1.0% Other race alone 8,557 0.09% American Indian alone 934 0.01% Native Hawaiian and Other
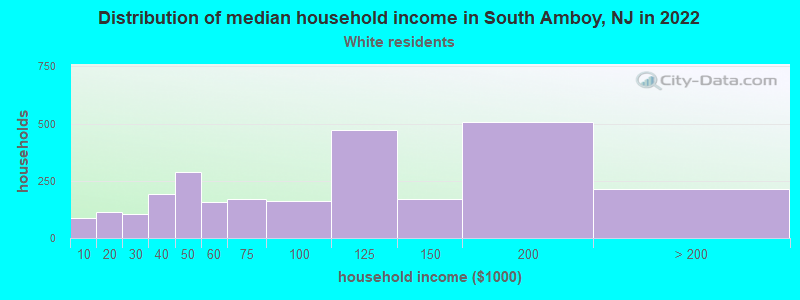
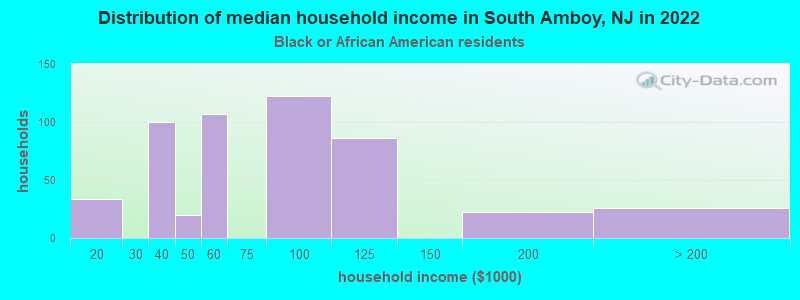
Income and house value in South Amboy Median household income in 2022 $106,683 White non-Hispanic householders$72,112 Black householders$149,250 Asian householders$72,426 Hispanic or Latino race householdersMedian 2022 house value $362,815 White Non-Hispanic householders$921,520 Black or African American householders $482,613 Asian householders$481,297 Some other race householders$354,653 Two or more races householders$380,193 Hispanic or Latino householders
Median age by race in South Amboy
52.2 Median age for White residents55.4 52.6 30.6 Median age for Black or African American residents37.8 28.9 60.0 Median age for American Indian / Alaska Native residents-624,624,624.0 -739,999,999.3 58.6 Median age for Asian residents53.8 58.8 -939,393,938.5 Median age for Native Hawaiian / Pacific Islander residents-860,335,194.7 -713,070,378.3 30.0 Median age for Other race residents28.8 35.6 18.1 Median age for Two or more races residents30.6 14.7 49.9 Median age for White alone residents52.6 49.7 33.4 Median age for Hispanic or Latino residents34.2 33.5
Owner/renter occupied households by race in South Amboy
House owners and renters - White residents 1,596 61.5% Owner occupied998 38.5% Renter occupiedHouse owners and renters - Black or African American residents 126 24.3% Owner occupied393 75.7% Renter occupiedHouse owners and renters - American Indian / Alaska Native residents 39 100.0% Owner occupiedHouse owners and renters - Asian residents 202 94.1% Owner occupied13 5.9% Renter occupiedHouse owners and renters - Other race residents 133 36.2% Owner occupied235 63.8% Renter occupiedHouse owners and renters - Two or more races residents 125 63.7% Owner occupied71 36.3% Renter occupiedHouse owners and renters - White alone residents 1,503 56.3% Owner occupied1,167 43.7% Renter occupiedHouse owners and renters - Hispanic or Latino residents 475 62.1% Owner occupied290 37.9% Renter occupied
Language usage in South Amboy
English speakers - Total 71.3% of residents of South Amboy speak English at home.
16.0% of residents speak Spanish at home 937 65.9% Speak English very well485 34.1% Speak English less than very well12.2% of residents speak other language at home 622 57.4% Speak English very well462 42.6% Speak English less than very well
English speakers - Born in the United States 78.1% of residents of South Amboy speak English at home.
17.7% of residents speak Spanish at home 244 96.8% Speak English very well8 3.2% Speak English less than very well3.0% of residents speak other language at home 42 100.0% Speak English very well
English speakers - Native, born elsewhere 19.8% of residents of South Amboy speak English at home.
59.9% of residents speak Spanish at home 135 95.1% Speak English very well7 4.9% Speak English less than very well16.5% of residents speak other language at home 39 100.0% Speak English very well
English speakers - Foreign-born 15.2% of residents of South Amboy speak English at home.
41.9% of residents speak Spanish at home 308 40.1% Speak English very well460 59.9% Speak English less than very well44.2% of residents speak other language at home 352 43.5% Speak English very well458 56.5% Speak English less than very well
White (Caucasian) - Speak only English Native:
100.0% (4,634)Foreign-born:
31.6% (149)
White (Caucasian) - Speak another language Native:
3.1% (145)Foreign-born:
72.1% (341)
Black or African American - Speak another language Native:
10.6% (86)Foreign-born:
100.0% (259)
American Indian / Alaska Native - Speak another language Native:
100.0% (32)Foreign-born:
97.6% (86)
Asian - Speak only English Native:
31.9% (30)Foreign-born:
17.4% (66)
Asian - Speak another language Native:
68.6% (64)Foreign-born:
83.4% (317)
Other race - Speak only English Native:
33.1% (203)Foreign-born:
11.2% (49)
Other race - Speak another language Native:
67.4% (414)Foreign-born:
90.1% (393)
Two or more races - Speak only English Native:
50.3% (323)Foreign-born:
10.1% (22)
Two or more races - Speak another language Native:
50.2% (322)Foreign-born:
90.1% (196)
White alone - Speak only English Native:
97.7% (4,661)Foreign-born:
21.2% (122)
White alone - Speak another language Native:
3.2% (152)Foreign-born:
78.7% (453)
Hispanic or Latino - Speak only English Native:
42.3% (499)Foreign-born:
11.4% (100)
Hispanic or Latino - Speak another language Native:
58.1% (684)Foreign-born:
90.0% (790)
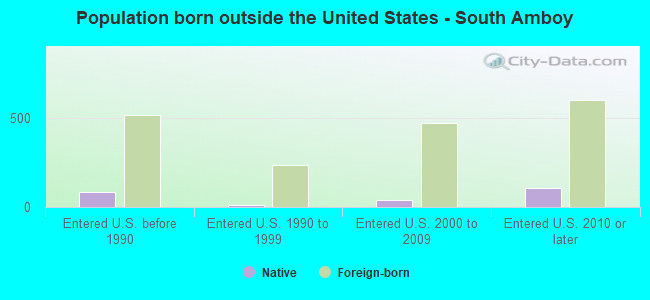
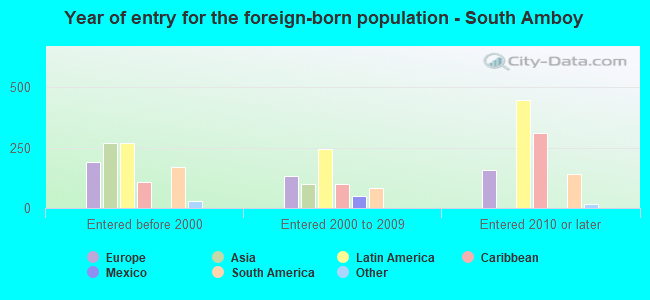
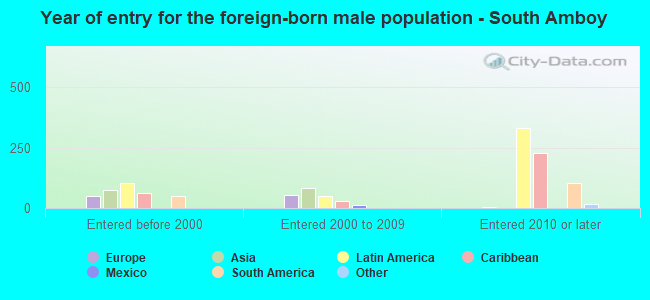
Foreign-born residents in South Amboy 1,777 residents are foreign born (8.8% Latin America , 5.6% Europe , 3.9% Asia ).
This city:
19.0%New Jersey:
23.2%
Marital status for residents in South Amboy Marital status - White (Caucasian) population 15 years and over
Males 30.6% Never married53.2% Now married2.8% Separated2.9% Widowed10.5% DivorcedFemales 27.1% Never married48.7% Now married1.2% Separated7.1% Widowed15.9% DivorcedWomen who gave birth in the past 12 months Now married:
100.0% (25)Unmarried:
0.0% (0)
Women who did not give birth in the past 12 months Now married:
46.5% (543)Unmarried:
53.5% (625)
Marital status - Black or African American population 15 years and over
Males 52.3% Never married47.7% Now married0.0% Separated0.0% Widowed0.0% DivorcedFemales 62.4% Never married37.6% Now married0.0% Separated0.0% Widowed0.0% DivorcedWomen who gave birth in the past 12 months Now married:
100.0% (30)Unmarried:
0.0% (0)
Women who did not give birth in the past 12 months Now married:
13.4% (41)Unmarried:
86.6% (266)
Marital status - American Indian / Alaska Native population 15 years and over
Males 54.3% Never married45.7% Now married0.0% Separated0.0% Widowed0.0% DivorcedFemales 0.0% Never married100.0% Now married0.0% Separated0.0% Widowed0.0% DivorcedMarital status - Asian population 15 years and over
Males 23.3% Never married72.0% Now married0.0% Separated4.7% Widowed0.0% DivorcedFemales 6.4% Never married83.9% Now married0.0% Separated1.2% Widowed8.4% DivorcedWomen who did not give birth in the past 12 months Now married:
77.5% (56)Unmarried:
22.5% (16)
Marital status - Other race population 15 years and over
Males 18.8% Never married81.2% Now married0.0% Separated0.0% Widowed0.0% DivorcedFemales 32.6% Never married59.4% Now married8.0% Separated0.0% Widowed0.0% DivorcedWomen who gave birth in the past 12 months Now married:
0.0% (0)Unmarried:
100.0% (51)
Women who did not give birth in the past 12 months Now married:
69.3% (248)Unmarried:
30.7% (110)
Marital status - Two or more races population 15 years and over
Males 38.8% Never married54.2% Now married0.0% Separated0.0% Widowed7.0% DivorcedFemales 15.9% Never married36.0% Now married0.0% Separated13.1% Widowed35.0% DivorcedWomen who did not give birth in the past 12 months Now married:
14.8% (25)Unmarried:
85.2% (144)
Marital status - White alone, not Hispanic / Latino population 15 years and over
Males 31.6% Never married55.0% Now married1.9% Separated2.2% Widowed9.3% DivorcedFemales 27.1% Never married49.1% Now married1.2% Separated7.4% Widowed15.3% DivorcedWomen who gave birth in the past 12 months Now married:
100.0% (30)Unmarried:
0.0% (0)
Women who did not give birth in the past 12 months Now married:
48.4% (640)Unmarried:
51.6% (681)
Marital status - Hispanic or Latino population 15 years and over
Males 28.9% Never married57.3% Now married3.4% Separated2.7% Widowed7.7% DivorcedFemales 23.5% Never married54.7% Now married3.6% Separated3.6% Widowed14.6% DivorcedWomen who gave birth in the past 12 months Now married:
43.8% (29)Unmarried:
56.3% (38)
Women who did not give birth in the past 12 months Now married:
44.9% (209)Unmarried:
55.1% (257)
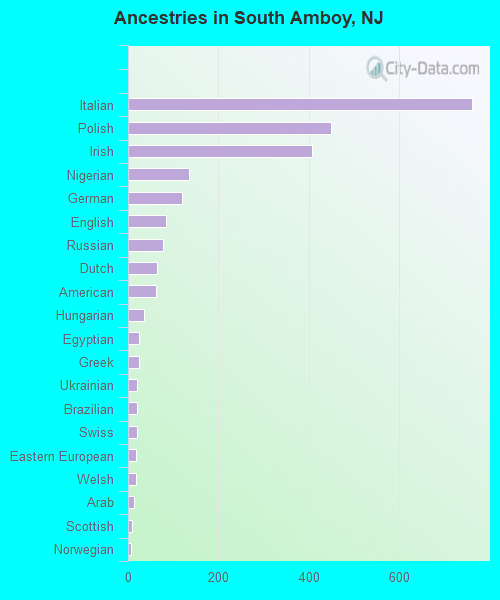
Ancestries in South Amboy
760 16.0% Italian449 9.5% Polish407 8.6% Irish135 2.8% Nigerian120 2.5% German83 1.8% English77 1.6% Russian64 1.4% Dutch63 1.3% American35 0.7% Hungarian25 0.5% Egyptian24 0.5% Greek21 0.4% Ukrainian20 0.4% Brazilian19 0.4% Swiss18 0.4% Eastern European17 0.4% Welsh13 0.3% Arab8 0.2% Scottish7 0.1% Norwegian
Children Nativity (place of birth) in South Amboy
Children under 6 years - Living with two parents Both parents native 157 100.0% NativeBoth parents foreign-born 153 100.0% NativeOne native, one foreign-born parent 73 100.0% NativeChildren under 6 years - Living with one parent Foreign-born parent 84 100.0% NativeChildren 6 to 17 years - Living with two parents Both parents native 280 100.0% NativeBoth parents foreign-born 56 69.5% Native24 30.5% Foreign-bornOne native, one foreign-born parent 155 100.0% NativeChildren 6 to 17 years - Living with one parent Native parent 251 100.0% NativeForeign-born parent 233 52.6% Native209 47.4% Foreign-born
Grandparents responsible for own grandchildren in South Amboy
Grandparents (30 to 59 years) White / Caucasian 10 100.0% Responsible for grandchildrenBlack or African American 26 100.0% Responsible for grandchildrenWhite alone, not Hispanic / Latino 12 100.0% Responsible for grandchildrenHispanic or Latino 30 100.0% Responsible for grandchildren
Grandparents (60 years and over) White / Caucasian 7 100.0% Not responsible for grandchildrenWhite alone, not Hispanic / Latino 8 100.0% Not responsible for grandchildrenHispanic or Latino 98 100.0% Not responsible for grandchildren