Races in South Bradenton, Florida (FL) Detailed Stats
Data:
Races - White alone (%)
Races - White alone (% change since 2000)
Races - Black alone (%)
Races - Black alone (% change since 2000)
Races - American Indian alone (%)
Races - American Indian alone (% change since 2000)
Races - Asian alone (%)
Races - Asian alone (% change since 2000)
Races - Hispanic (%)
Races - Hispanic (% change since 2000)
Races - Native Hawaiian and Other Pacific Islander alone (%)
Races - Native Hawaiian and Other Pacific Islander alone (% change since 2000)
Races - Two or more races(%)
Races - Two or more races(% change since 2000)
Races - Other race alone (%)
Races - Other race alone (% change since 2000)
Racial diversity
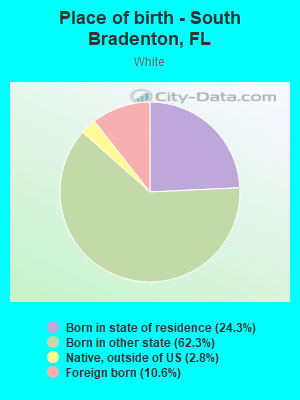
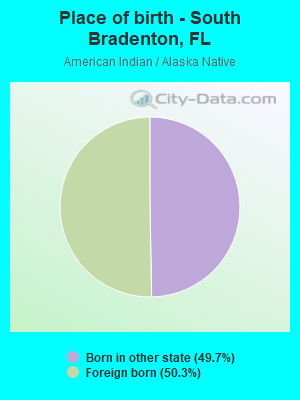
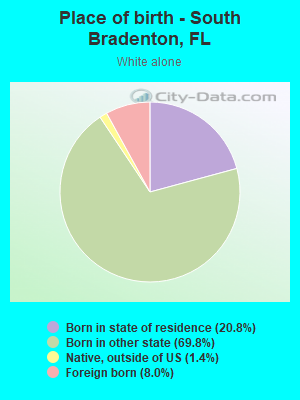
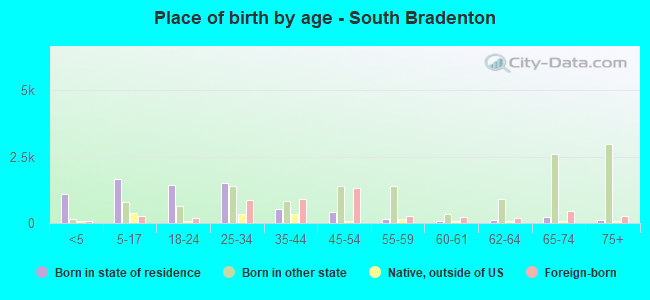
Place of birth - Born in state of residence (%)
Place of birth - Born in state of residence (%) - White
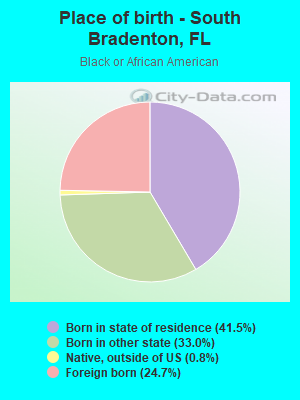
Place of birth - Born in state of residence (%) - Black or African American
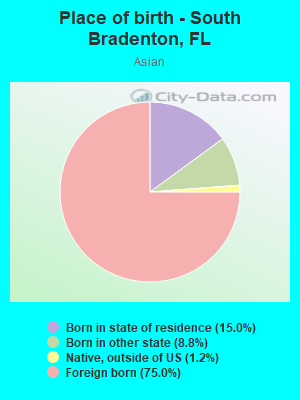
Place of birth - Born in state of residence (%) - Asian
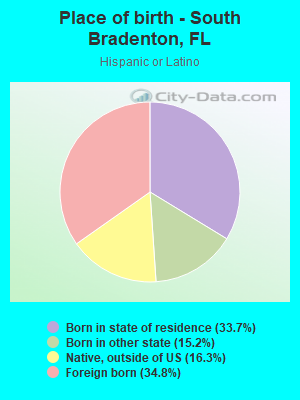
Place of birth - Born in state of residence (%) - Hispanic or Latino
Place of birth - Born in state of residence (%) - American Indian and Alaska Native
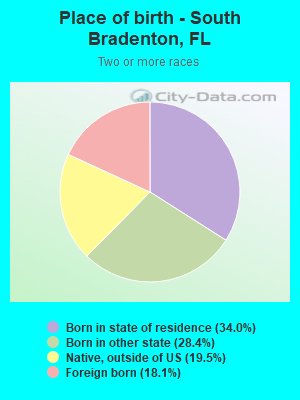
Place of birth - Born in state of residence (%) - Multirace
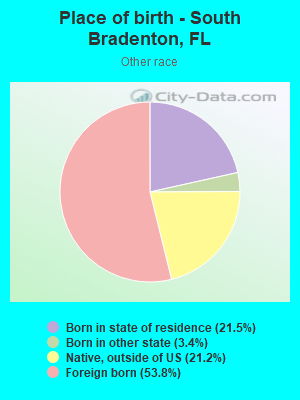
Place of birth - Born in state of residence (%) - Other Race
Place of birth - Born in other state (%)
Place of birth - Born in other state (%) - White
Place of birth - Born in other state (%) - Black or African American
Place of birth - Born in other state (%) - Asian
Place of birth - Born in other state (%) - Hispanic or Latino
Place of birth - Born in other state (%) - American Indian and Alaska Native
Place of birth - Born in other state (%) - Multirace
Place of birth - Born in other state (%) - Other Race
Place of birth - Native, outside of US (%)
Place of birth - Native, outside of US (%) - White
Place of birth - Native, outside of US (%) - Black or African American
Place of birth - Native, outside of US (%) - Asian
Place of birth - Native, outside of US (%) - Hispanic or Latino
Place of birth - Native, outside of US (%) - American Indian and Alaska Native
Place of birth - Native, outside of US (%) - Multirace
Place of birth - Native, outside of US (%) - Other Race
Place of birth - Foreign born (%)
Place of birth - Foreign born (%) - White
Place of birth - Foreign born (%) - Black or African American
Place of birth - Foreign born (%) - Asian
Place of birth - Foreign born (%) - Hispanic or Latino
Place of birth - Foreign born (%) - American Indian and Alaska Native
Place of birth - Foreign born (%) - Multirace
Place of birth - Foreign born (%) - Other Race
Residents speaking English at home (%)
Residents speaking English at home - Born in the United States (%)
Residents speaking English at home - Native, born elsewhere (%)
Residents speaking English at home - Foreign born (%)
Residents speaking Spanish at home (%)
Residents speaking Spanish at home - Born in the United States (%)
Residents speaking Spanish at home - Native, born elsewhere (%)
Residents speaking Spanish at home - Foreign born (%)
Residents speaking other language at home (%)
Residents speaking other language at home - Born in the United States (%)
Residents speaking other language at home - Native, born elsewhere (%)
Residents speaking other language at home - Foreign born (%)
Marital status - Never married (%)
Marital status - Now married (%)
Marital status - Separated (%)
Marital status - Widowed (%)
Marital status - Divorced (%)
Ancestries Reported - Arab (%)
Ancestries Reported - Czech (%)
Ancestries Reported - Danish (%)
Ancestries Reported - Dutch (%)
Ancestries Reported - English (%)
Ancestries Reported - French (%)
Ancestries Reported - French Canadian (%)
Ancestries Reported - German (%)
Ancestries Reported - Greek (%)
Ancestries Reported - Hungarian (%)
Ancestries Reported - Irish (%)
Ancestries Reported - Italian (%)
Ancestries Reported - Lithuanian (%)
Ancestries Reported - Norwegian (%)
Ancestries Reported - Polish (%)
Ancestries Reported - Portuguese (%)
Ancestries Reported - Russian (%)
Ancestries Reported - Scotch-Irish (%)
Ancestries Reported - Scottish (%)
Ancestries Reported - Slovak (%)
Ancestries Reported - Subsaharan African (%)
Ancestries Reported - Swedish (%)
Ancestries Reported - Swiss (%)
Ancestries Reported - Ukrainian (%)
Ancestries Reported - United States (%)
Ancestries Reported - Welsh (%)
Ancestries Reported - West Indian (%)
Ancestries Reported - Other (%)
Geographical mobility - Same house 1 year ago (%)
Geographical mobility - Same house 1 year ago (%) - White
Geographical mobility - Same house 1 year ago (%) - Black or African American
Geographical mobility - Same house 1 year ago (%) - Asian
Geographical mobility - Same house 1 year ago (%) - Hispanic or Latino
Geographical mobility - Same house 1 year ago (%) - American Indian and Alaska Native
Geographical mobility - Same house 1 year ago (%) - Multirace
Geographical mobility - Same house 1 year ago (%) - Other Race
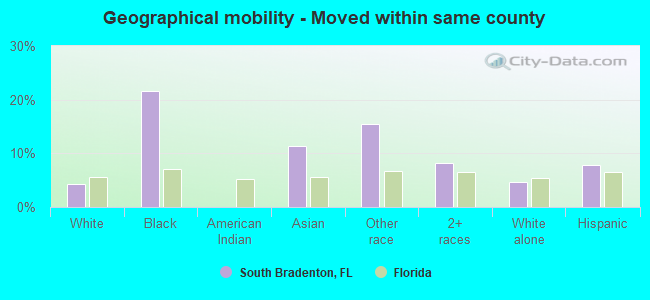
Geographical mobility - Moved within same county (%)
Geographical mobility - Moved within same county (%) - White
Geographical mobility - Moved within same county (%) - Black or African American
Geographical mobility - Moved within same county (%) - Asian
Geographical mobility - Moved within same county (%) - Hispanic or Latino
Geographical mobility - Moved within same county (%) - American Indian and Alaska Native
Geographical mobility - Moved within same county (%) - Multirace
Geographical mobility - Moved within same county (%) - Other Race
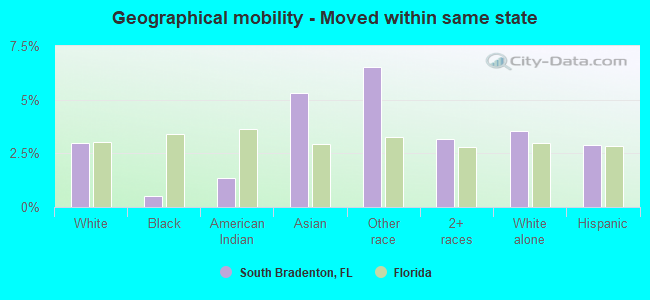
Geographical mobility - Moved from different county within same state (%)
Geographical mobility - Moved from different county within same state (%) - White
Geographical mobility - Moved from different county within same state (%) - Black or African American
Geographical mobility - Moved from different county within same state (%) - Asian
Geographical mobility - Moved from different county within same state (%) - Hispanic or Latino
Geographical mobility - Moved from different county within same state (%) - American Indian and Alaska Native
Geographical mobility - Moved from different county within same state (%) - Multirace
Geographical mobility - Moved from different county within same state (%) - Other Race
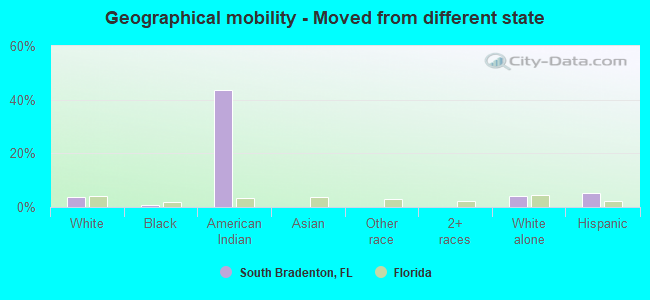
Geographical mobility - Moved from different state (%)
Geographical mobility - Moved from different state (%) - White
Geographical mobility - Moved from different state (%) - Black or African American
Geographical mobility - Moved from different state (%) - Asian
Geographical mobility - Moved from different state (%) - Hispanic or Latino
Geographical mobility - Moved from different state (%) - American Indian and Alaska Native
Geographical mobility - Moved from different state (%) - Multirace
Geographical mobility - Moved from different state (%) - Other Race
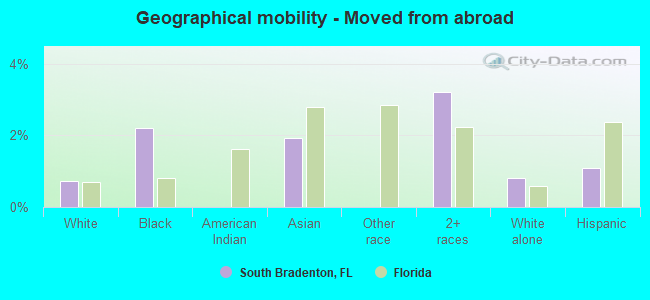
Geographical mobility - Moved from abroad (%)
Geographical mobility - Moved from abroad (%) - White
Geographical mobility - Moved from abroad (%) - Black or African American
Geographical mobility - Moved from abroad (%) - Asian
Geographical mobility - Moved from abroad (%) - Hispanic or Latino
Geographical mobility - Moved from abroad (%) - American Indian and Alaska Native
Geographical mobility - Moved from abroad (%) - Multirace
Geographical mobility - Moved from abroad (%) - Other Race
Place of birth for the foreign-born population - Ireland (%)
Place of birth for the foreign-born population - Denmark (%)
Place of birth for the foreign-born population - Norway (%)
Place of birth for the foreign-born population - Sweden (%)
Place of birth for the foreign-born population - United Kingdom (%)
Place of birth for the foreign-born population - England (%)
Place of birth for the foreign-born population - Scotland (%)
Place of birth for the foreign-born population - Other Northern Europe (%)
Place of birth for the foreign-born population - Austria (%)
Place of birth for the foreign-born population - Belgium (%)
Place of birth for the foreign-born population - France (%)
Place of birth for the foreign-born population - Germany (%)
Place of birth for the foreign-born population - Netherlands (%)
Place of birth for the foreign-born population - Switzerland (%)
Place of birth for the foreign-born population - Other Western Europe (%)
Place of birth for the foreign-born population - Greece (%)
Place of birth for the foreign-born population - Italy (%)
Place of birth for the foreign-born population - Portugal (%)
Place of birth for the foreign-born population - Spain (%)
Place of birth for the foreign-born population - Other Southern Europe (%)
Place of birth for the foreign-born population - Albania (%)
Place of birth for the foreign-born population - Belarus (%)
Place of birth for the foreign-born population - Bosnia and Herzegovina (%)
Place of birth for the foreign-born population - Bulgaria (%)
Place of birth for the foreign-born population - Croatia (%)
Place of birth for the foreign-born population - Czechoslovakia (%)
Place of birth for the foreign-born population - Hungary (%)
Place of birth for the foreign-born population - Latvia (%)
Place of birth for the foreign-born population - Lithuania (%)
Place of birth for the foreign-born population - North Macedonia (Macedonia) (%)
Place of birth for the foreign-born population - Moldova (%)
Place of birth for the foreign-born population - Poland (%)
Place of birth for the foreign-born population - Romania (%)
Place of birth for the foreign-born population - Russia (%)
Place of birth for the foreign-born population - Serbia (%)
Place of birth for the foreign-born population - Ukraine (%)
Place of birth for the foreign-born population - Other Eastern Europe (%)
Place of birth for the foreign-born population - China (%)
Place of birth for the foreign-born population - Hong Kong (%)
Place of birth for the foreign-born population - Taiwan (%)
Place of birth for the foreign-born population - Japan (%)
Place of birth for the foreign-born population - Korea (%)
Place of birth for the foreign-born population - Other Eastern Asia (%)
Place of birth for the foreign-born population - Afghanistan (%)
Place of birth for the foreign-born population - Bangladesh (%)
Place of birth for the foreign-born population - India (%)
Place of birth for the foreign-born population - Iran (%)
Place of birth for the foreign-born population - Kazakhstan (%)
Place of birth for the foreign-born population - Nepal (%)
Place of birth for the foreign-born population - Pakistan (%)
Place of birth for the foreign-born population - Sri Lanka (%)
Place of birth for the foreign-born population - Uzbekistan (%)
Place of birth for the foreign-born population - Other South Central Asia (%)
Place of birth for the foreign-born population - Burma (%)
Place of birth for the foreign-born population - Cambodia (%)
Place of birth for the foreign-born population - Indonesia (%)
Place of birth for the foreign-born population - Laos (%)
Place of birth for the foreign-born population - Malaysia (%)
Place of birth for the foreign-born population - Philippines (%)
Place of birth for the foreign-born population - Singapore (%)
Place of birth for the foreign-born population - Thailand (%)
Place of birth for the foreign-born population - Vietnam (%)
Place of birth for the foreign-born population - Other South Eastern Asia (%)
Place of birth for the foreign-born population - Armenia (%)
Place of birth for the foreign-born population - Iraq (%)
Place of birth for the foreign-born population - Israel (%)
Place of birth for the foreign-born population - Jordan (%)
Place of birth for the foreign-born population - Kuwait (%)
Place of birth for the foreign-born population - Lebanon (%)
Place of birth for the foreign-born population - Saudi Arabia (%)
Place of birth for the foreign-born population - Syria (%)
Place of birth for the foreign-born population - Turkey (%)
Place of birth for the foreign-born population - Yemen (%)
Place of birth for the foreign-born population - Other Western Asia (%)
Place of birth for the foreign-born population - Eritrea (%)
Place of birth for the foreign-born population - Ethiopia (%)
Place of birth for the foreign-born population - Kenya (%)
Place of birth for the foreign-born population - Somalia (%)
Place of birth for the foreign-born population - Uganda (%)
Place of birth for the foreign-born population - Zimbabwe (%)
Place of birth for the foreign-born population - Other Eastern Africa (%)
Place of birth for the foreign-born population - Cameroon (%)
Place of birth for the foreign-born population - Congo (%)
Place of birth for the foreign-born population - Democratic Republic of Congo (Zaire) (%)
Place of birth for the foreign-born population - Other Middle Africa (%)
Place of birth for the foreign-born population - Egypt (%)
Place of birth for the foreign-born population - Morocco (%)
Place of birth for the foreign-born population - Sudan (%)
Place of birth for the foreign-born population - Other Northern Africa (%)
Place of birth for the foreign-born population - South Africa (%)
Place of birth for the foreign-born population - Other Southern Africa (%)
Place of birth for the foreign-born population - Cabo Verde (%)
Place of birth for the foreign-born population - Ghana (%)
Place of birth for the foreign-born population - Liberia (%)
Place of birth for the foreign-born population - Nigeria (%)
Place of birth for the foreign-born population - Senegal (%)
Place of birth for the foreign-born population - Sierra Leone (%)
Place of birth for the foreign-born population - Other Western Africa (%)
Place of birth for the foreign-born population - Australia (%)
Place of birth for the foreign-born population - New Zealand (%)
Place of birth for the foreign-born population - Fiji (%)
Place of birth for the foreign-born population - Micronesia (%)
Place of birth for the foreign-born population - Bahamas (%)
Place of birth for the foreign-born population - Barbados (%)
Place of birth for the foreign-born population - Cuba (%)
Place of birth for the foreign-born population - Dominica (%)
Place of birth for the foreign-born population - Dominican Republic (%)
Place of birth for the foreign-born population - Grenada (%)
Place of birth for the foreign-born population - Haiti (%)
Place of birth for the foreign-born population - Jamaica (%)
Place of birth for the foreign-born population - St. Vincent and the Grenadines (%)
Place of birth for the foreign-born population - Trinidad and Tobago (%)
Place of birth for the foreign-born population - West Indies (%)
Place of birth for the foreign-born population - Other Caribbean (%)
Place of birth for the foreign-born population - Belize (%)
Place of birth for the foreign-born population - Costa Rica (%)
Place of birth for the foreign-born population - El Salvador (%)
Place of birth for the foreign-born population - Guatemala (%)
Place of birth for the foreign-born population - Honduras (%)
Place of birth for the foreign-born population - Mexico (%)
Place of birth for the foreign-born population - Nicaragua (%)
Place of birth for the foreign-born population - Panama (%)
Place of birth for the foreign-born population - Other Central America (%)
Place of birth for the foreign-born population - Argentina (%)
Place of birth for the foreign-born population - Bolivia (%)
Place of birth for the foreign-born population - Brazil (%)
Place of birth for the foreign-born population - Chile (%)
Place of birth for the foreign-born population - Colombia (%)
Place of birth for the foreign-born population - Ecuador (%)
Place of birth for the foreign-born population - Guyana (%)
Place of birth for the foreign-born population - Peru (%)
Place of birth for the foreign-born population - Uruguay (%)
Place of birth for the foreign-born population - Venezuela (%)
Place of birth for the foreign-born population - Other South America (%)
Place of birth for the foreign-born population - Canada (%)
Place of birth for the foreign-born population - Other Northern America (%)
Place of birth for the foreign-born population - Other (%)
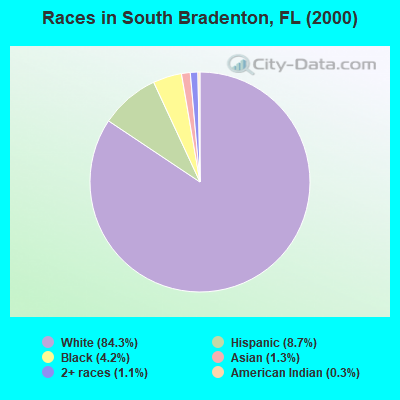
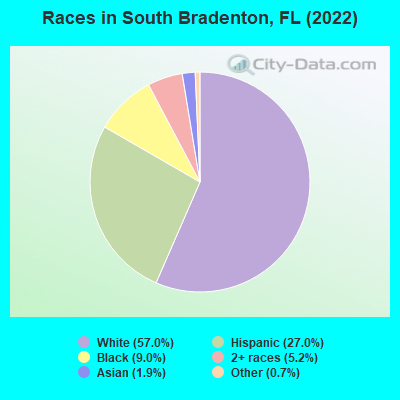
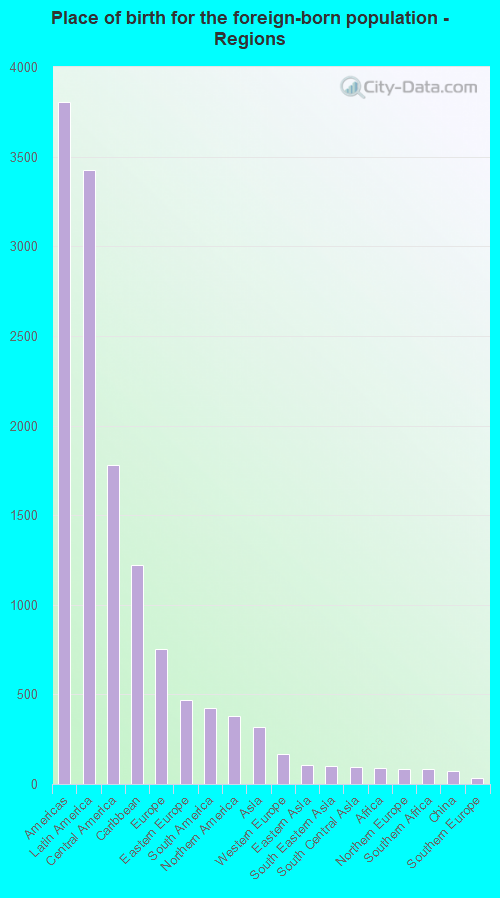
According to 2022 data, the most numerous races in South Bradenton, FL are White alone (15,383 residents), Hispanic (7,274 residents), and Black alone (2,434 residents). 71.6% of South Bradenton residents speak English at home. 18.5% of South Bradenton, FL residents are foreign-born (12.8% born in Latin America, 2.8% born in Europe), which is 13.8% less than the foreign-born rate of 21.0% across the entire state of Florida.
Race distribution in South Bradenton
2000 2022
10,458,509 65.4% White alone 2,682,715 16.8% Hispanic 2,264,268 14.2% Black alone 261,693 1.6% Asian alone 236,954 1.5% Two or more races 42,358 0.3% American Indian alone 28,994 0.2% Other race alone 6,887 0.04% Native Hawaiian and Other
11,309,403 50.8% White alone 6,025,039 27.1% Hispanic 3,241,015 14.6% Black alone 861,630 3.9% Two or more races 623,692 2.8% Asian alone 152,054 0.7% Other race alone 22,504 0.1% American Indian alone 9,486 0.04% Native Hawaiian and Other
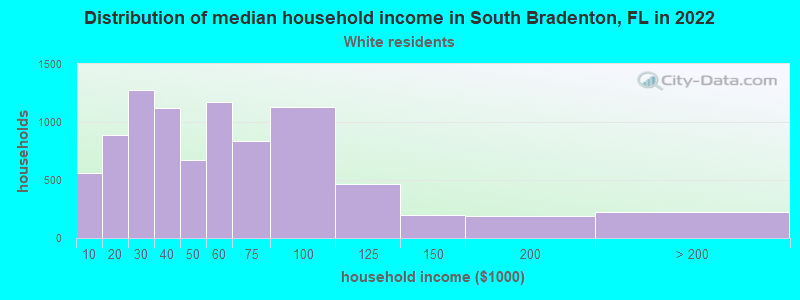
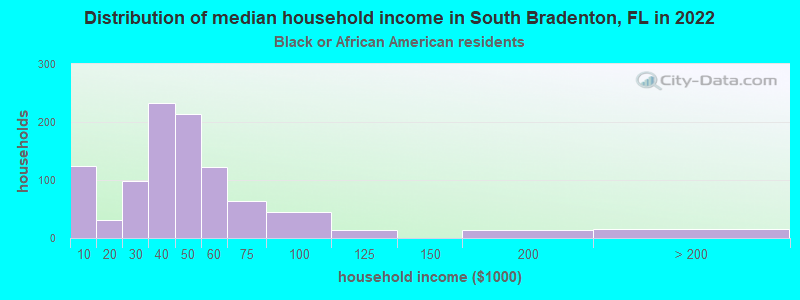
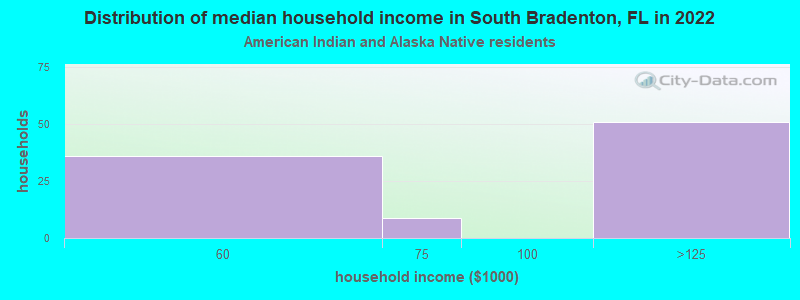
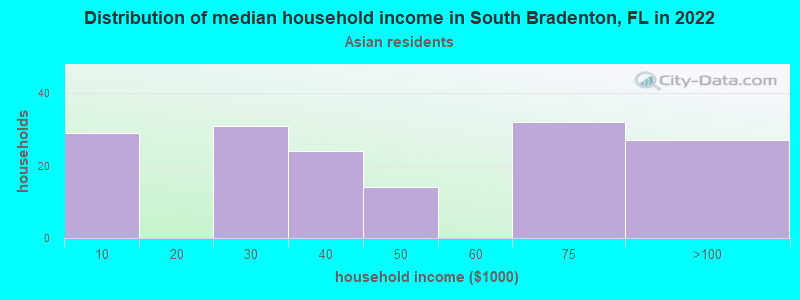
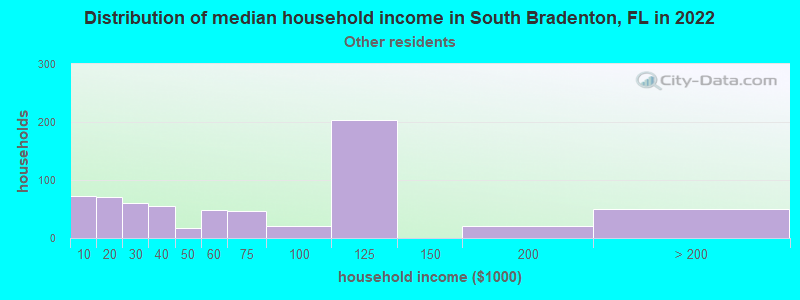
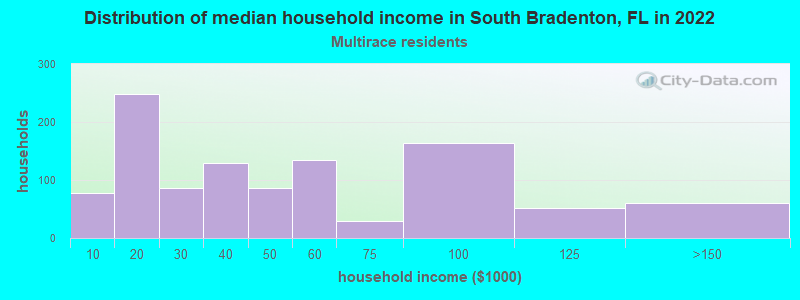
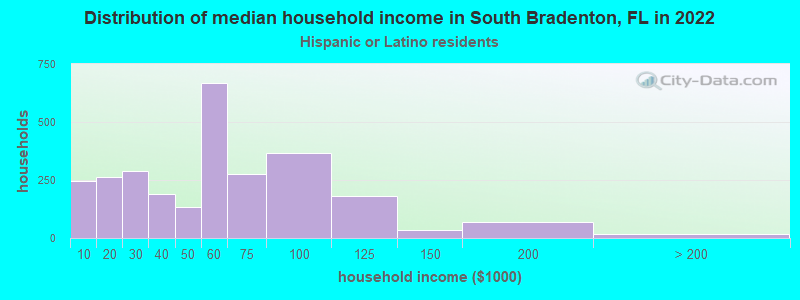
Income and house value in South Bradenton Median household income in 2022 $44,426 White non-Hispanic householders$47,073 Black householders$36,310 Asian householders$41,639 Some other race householders$36,001 Two or more races householders$53,632 Hispanic or Latino race householdersMedian 2022 house value $233,516 White Non-Hispanic householders$220,824 Black or African American householders $258,898 Asian householders$211,518 Native Hawaiian and other Pacific Islander householders$175,137 Some other race householders$257,770 Two or more races householders$215,184 Hispanic or Latino householders
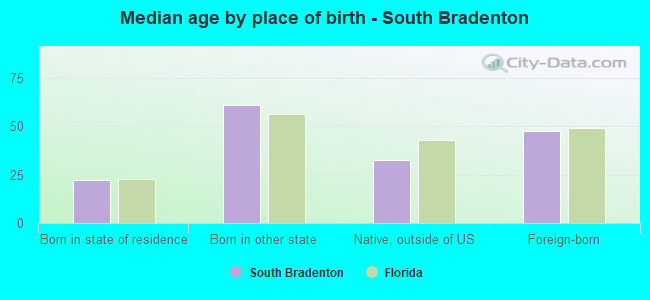
Median age by race in South Bradenton
55.2 Median age for White residents54.9 56.0 30.3 Median age for Black or African American residents24.9 33.0 18.2 Median age for American Indian / Alaska Native residents-611,418,047.3 18.1 42.0 Median age for Asian residents48.7 38.9 -679,849,340.2 Median age for Native Hawaiian / Pacific Islander residents-858,307,848.3 -443,298,968.6 34.6 Median age for Other race residents36.1 31.9 28.9 Median age for Two or more races residents30.6 32.3 58.9 Median age for White alone residents57.4 61.9 30.3 Median age for Hispanic or Latino residents33.9 25.3
Owner/renter occupied households by race in South Bradenton
House owners and renters - White residents 5,598 62.8% Owner occupied3,310 37.2% Renter occupiedHouse owners and renters - Black or African American residents 137 12.5% Owner occupied957 87.5% Renter occupiedHouse owners and renters - American Indian / Alaska Native residents 111 100.0% Renter occupiedHouse owners and renters - Asian residents 89 53.5% Owner occupied77 46.5% Renter occupiedHouse owners and renters - Other race residents 516 68.1% Owner occupied242 31.9% Renter occupiedHouse owners and renters - Two or more races residents 199 15.8% Owner occupied1,060 84.2% Renter occupiedHouse owners and renters - White alone residents 5,034 61.8% Owner occupied3,111 38.2% Renter occupiedHouse owners and renters - Hispanic or Latino residents 1,211 48.0% Owner occupied1,310 52.0% Renter occupied
Language usage in South Bradenton
English speakers - Total 71.6% of residents of South Bradenton speak English at home.
19.5% of residents speak Spanish at home 2,769 55.3% Speak English very well2,235 44.7% Speak English less than very well8.5% of residents speak other language at home 1,151 52.6% Speak English very well1,037 47.4% Speak English less than very well
English speakers - Born in the United States 93.0% of residents of South Bradenton speak English at home.
5.2% of residents speak Spanish at home 659 96.2% Speak English very well26 3.8% Speak English less than very well2.1% of residents speak other language at home 162 59.1% Speak English very well112 40.9% Speak English less than very well
English speakers - Native, born elsewhere 17.3% of residents of South Bradenton speak English at home.
74.6% of residents speak Spanish at home 379 35.6% Speak English very well685 64.4% Speak English less than very well5.8% of residents speak other language at home 46 55.4% Speak English very well37 44.6% Speak English less than very well
English speakers - Foreign-born 19.9% of residents of South Bradenton speak English at home.
47.1% of residents speak Spanish at home 665 28.4% Speak English very well1,674 71.6% Speak English less than very well33.0% of residents speak other language at home 718 43.8% Speak English very well923 56.2% Speak English less than very well
White (Caucasian) - Speak only English Native:
89.5% (13,898)Foreign-born:
33.5% (640)
White (Caucasian) - Speak another language Native:
8.1% (1,264)Foreign-born:
62.3% (1,191)
Black or African American - Speak only English Native:
94.8% (1,475)Foreign-born:
8.4% (55)
Black or African American - Speak another language Native:
4.2% (65)Foreign-born:
100.0% (652)
American Indian / Alaska Native - Speak only English Native:
41.4% (114)Foreign-born:
22.3% (53)
American Indian / Alaska Native - Speak another language Native:
67.8% (187)Foreign-born:
66.7% (157)
Asian - Speak only English Native:
43.1% (54)Foreign-born:
21.4% (76)
Asian - Speak another language Native:
59.8% (75)Foreign-born:
75.7% (270)
Other race - Speak only English Native:
43.7% (389)Foreign-born:
5.4% (60)
Other race - Speak another language Native:
57.1% (508)Foreign-born:
91.7% (1,026)
Two or more races - Speak only English Native:
64.0% (1,709)Foreign-born:
9.4% (62)
Two or more races - Speak another language Native:
36.0% (963)Foreign-born:
89.9% (590)
White alone - Speak only English Native:
95.8% (13,314)Foreign-born:
48.5% (599)
White alone - Speak another language Native:
4.5% (626)Foreign-born:
51.7% (638)
Hispanic or Latino - Speak only English Native:
38.2% (1,580)Foreign-born:
10.1% (254)
Hispanic or Latino - Speak another language Native:
59.3% (2,452)Foreign-born:
89.5% (2,261)
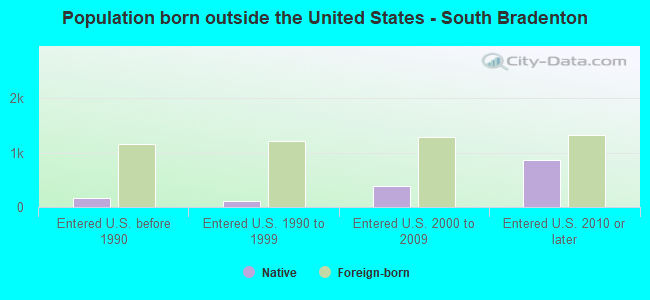
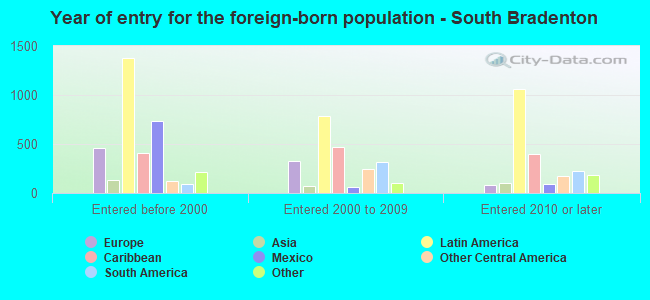
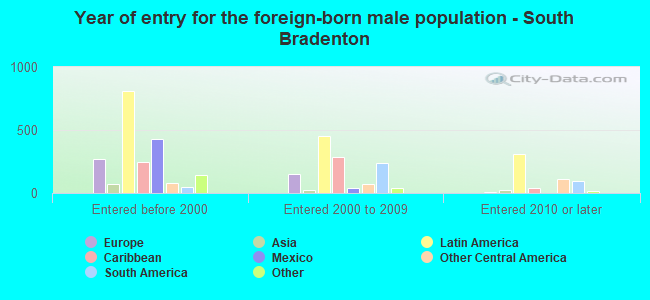
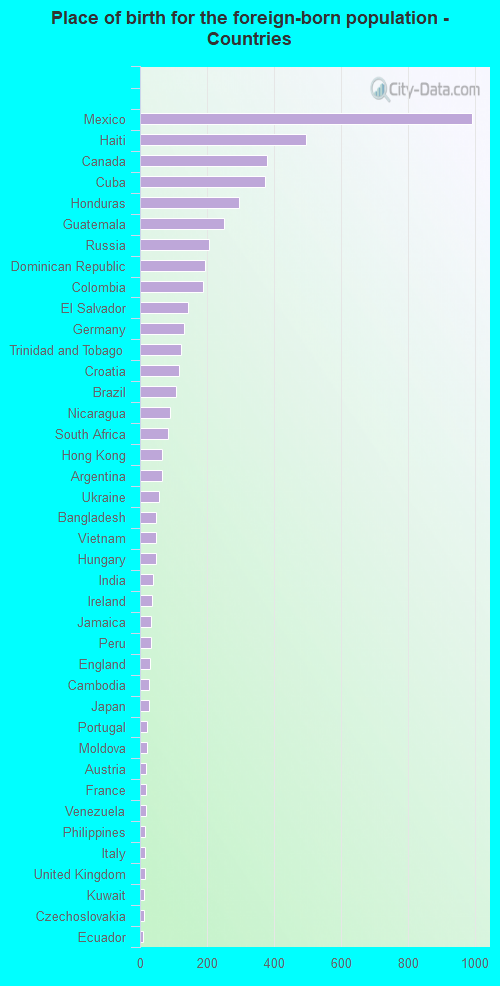
Foreign-born residents in South Bradenton 4,981 residents are foreign born (12.8% Latin America , 2.8% Europe ).
This city:
18.5%Florida:
21.1%
Marital status for residents in South Bradenton Marital status - White (Caucasian) population 15 years and over
Males 32.3% Never married41.2% Now married3.2% Separated5.2% Widowed18.2% DivorcedFemales 28.5% Never married37.9% Now married2.0% Separated14.4% Widowed17.3% DivorcedWomen who gave birth in the past 12 months Now married:
70.9% (119)Unmarried:
29.1% (49)
Women who did not give birth in the past 12 months Now married:
33.4% (1,071)Unmarried:
66.6% (2,139)
Marital status - Black or African American population 15 years and over
Males 53.8% Never married23.2% Now married21.6% Separated0.0% Widowed1.4% DivorcedFemales 62.8% Never married20.7% Now married2.2% Separated0.0% Widowed14.3% DivorcedWomen who gave birth in the past 12 months Now married:
20.2% (44)Unmarried:
79.8% (172)
Women who did not give birth in the past 12 months Now married:
12.7% (69)Unmarried:
87.3% (475)
Marital status - American Indian / Alaska Native population 15 years and over
Males 0.0% Never married100.0% Now married0.0% Separated0.0% Widowed0.0% DivorcedFemales 47.1% Never married23.6% Now married25.7% Separated0.0% Widowed3.6% DivorcedWomen who did not give birth in the past 12 months Now married:
51.1% (113)Unmarried:
48.9% (108)
Marital status - Asian population 15 years and over
Males 33.0% Never married58.6% Now married0.0% Separated0.0% Widowed8.4% DivorcedFemales 26.3% Never married57.3% Now married0.0% Separated0.0% Widowed16.4% DivorcedWomen who gave birth in the past 12 months Now married:
100.0% (8)Unmarried:
0.0% (0)
Women who did not give birth in the past 12 months Now married:
38.7% (42)Unmarried:
61.3% (67)
Marital status - Other race population 15 years and over
Males 36.0% Never married34.9% Now married9.2% Separated13.9% Widowed6.0% DivorcedFemales 44.3% Never married32.8% Now married5.3% Separated7.7% Widowed9.8% DivorcedWomen who gave birth in the past 12 months Now married:
0.0% (0)Unmarried:
100.0% (29)
Women who did not give birth in the past 12 months Now married:
45.7% (242)Unmarried:
54.3% (287)
Marital status - Two or more races population 15 years and over
Males 47.8% Never married40.0% Now married0.0% Separated0.0% Widowed12.2% DivorcedFemales 40.4% Never married48.9% Now married0.0% Separated0.8% Widowed9.9% DivorcedWomen who gave birth in the past 12 months Now married:
6.1% (14)Unmarried:
93.9% (210)
Women who did not give birth in the past 12 months Now married:
54.1% (376)Unmarried:
45.9% (319)
Marital status - White alone, not Hispanic / Latino population 15 years and over
Males 32.6% Never married38.5% Now married2.9% Separated6.3% Widowed19.7% DivorcedFemales 26.2% Never married36.4% Now married1.5% Separated17.0% Widowed18.9% DivorcedWomen who gave birth in the past 12 months Now married:
47.9% (24)Unmarried:
52.1% (26)
Women who did not give birth in the past 12 months Now married:
26.1% (584)Unmarried:
73.9% (1,654)
Marital status - Hispanic or Latino population 15 years and over
Males 34.4% Never married47.0% Now married4.9% Separated3.2% Widowed10.6% DivorcedFemales 39.4% Never married43.8% Now married3.9% Separated2.8% Widowed10.1% DivorcedWomen who gave birth in the past 12 months Now married:
67.3% (108)Unmarried:
32.7% (52)
Women who did not give birth in the past 12 months Now married:
47.1% (1,019)Unmarried:
52.9% (1,143)
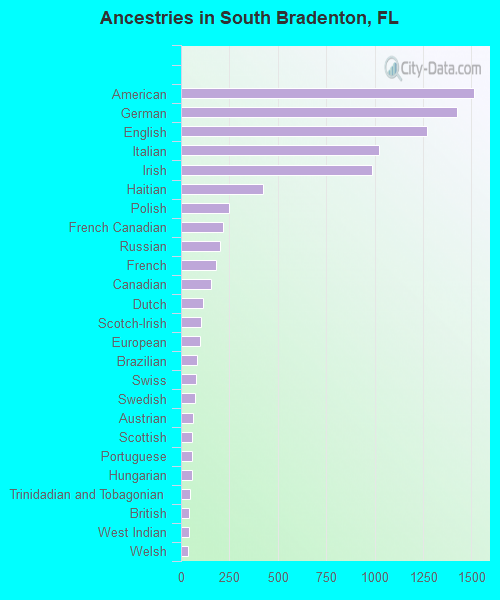
Ancestries in South Bradenton
1,515 10.4% American1,428 9.8% German1,268 8.7% English1,021 7.0% Italian984 6.7% Irish425 2.9% Haitian247 1.7% Polish215 1.5% French Canadian202 1.4% Russian179 1.2% French153 1.0% Canadian116 0.8% Dutch105 0.7% Scotch-Irish97 0.7% European84 0.6% Brazilian79 0.5% Swiss73 0.5% Swedish62 0.4% Austrian57 0.4% Scottish56 0.4% Portuguese56 0.4% Hungarian49 0.3% Trinidadian and Tobagonian42 0.3% British39 0.3% West Indian36 0.2% Welsh33 0.2% Greek31 0.2% Jamaican26 0.2% Norwegian21 0.1% Australian19 0.1% Turkish9 0.06% Lithuanian8 0.05% Eastern European7 0.05% Guyanese7 0.05% Finnish6 0.04% Pennsylvania German6 0.04% Celtic4 0.03% African4 0.03% Belizean
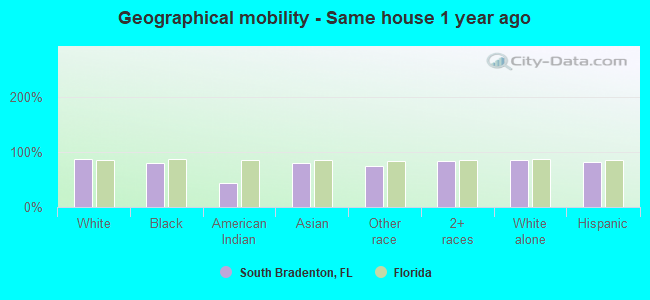
Geographical mobility in South Bradenton Same house 1 year ago 15,876 87.6% White (Caucasian)1,974 79.5% Black or African American218 44.1% American Indian / Alaska Native372 80.0% Asian1,755 74.7% Other race2,941 83.2% Two or more races13,223 86.0% White alone, not Hispanic / Latino5,885 82.6% Hispanic or LatinoMoved within same county 782 4.3% White / Caucasian539 21.7% Black or African American53 11.4% Asian363 15.5% Other race289 8.2% Two or more races730 4.8% White alone, not Hispanic / Latino560 7.9% Hispanic or LatinoMoved within same state 540 3.0% White / Caucasian12 0.5% Black or African American7 1.3% American Indian / Alaska Native25 5.3% Asian153 6.5% Other race111 3.1% Two or more races546 3.6% White alone, not Hispanic / Latino206 2.9% Hispanic or LatinoMoved from different state 672 3.7% White / Caucasian20 0.8% Black or African American216 43.6% American Indian / Alaska Native629 4.1% White alone, not Hispanic / Latino382 5.4% Hispanic or LatinoMoved from abroad 134 0.7% White55 2.2% Black or African American9 1.9% Asian113 3.2% Two or more races126 0.8% White alone, not Hispanic / Latino78 1.1% Hispanic or Latino
Children Nativity (place of birth) in South Bradenton
Children under 6 years - Living with two parents Both parents native 55 100.0% NativeBoth parents foreign-born 98 100.0% NativeOne native, one foreign-born parent 415 100.0% NativeChildren under 6 years - Living with one parent Native parent 402 100.0% NativeForeign-born parent 276 100.0% NativeChildren 6 to 17 years - Living with two parents Both parents native 285 100.0% NativeBoth parents foreign-born 508 84.4% Native94 15.6% Foreign-bornOne native, one foreign-born parent 186 95.6% Native8 4.4% Foreign-bornChildren 6 to 17 years - Living with one parent Native parent 808 100.0% NativeForeign-born parent 293 54.7% Native243 45.3% Foreign-born
Grandparents responsible for own grandchildren in South Bradenton
Grandparents (30 to 59 years) White / Caucasian 93 68.8% Responsible for grandchildren42 31.2% Not responsible for grandchildrenOther race 14 100.0% Not responsible for grandchildrenWhite alone, not Hispanic / Latino 117 70.1% Responsible for grandchildren50 29.9% Not responsible for grandchildrenHispanic or Latino 10 100.0% Not responsible for grandchildrenGrandparents (60 years and over) White / Caucasian 166 76.5% Responsible for grandchildren51 23.5% Not responsible for grandchildrenOther race 32 60.8% Responsible for grandchildren21 39.2% Not responsible for grandchildrenWhite alone, not Hispanic / Latino 138 72.9% Responsible for grandchildren51 27.1% Not responsible for grandchildrenHispanic or Latino 48 100.0% Responsible for grandchildren