Races in South Davis, Utah (UT) Detailed Stats
Ancestries, Foreign-born residents, place of birth
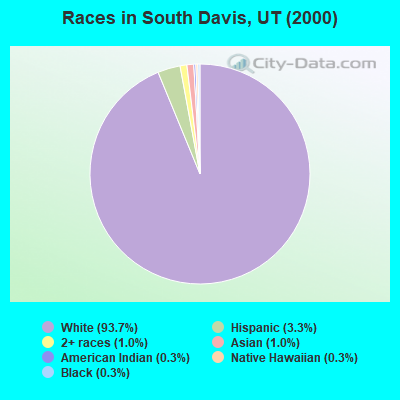
Race distribution in South Davis

- 83,48093.7%White alone
- 2,9383.3%Hispanic
- 9151.0%Two or more races
- 8951.0%Asian alone
- 2930.3%Native Hawaiian and Other
Pacific Islander alone - 2350.3%Black alone
- 3100.3%American Indian alone
- 620.07%Other race alone
2000
2022
-
- 1,904,26585.3%White alone
- 201,5599.0%Hispanic
- 36,4831.6%Asian alone
- 31,3081.4%Two or more races
- 26,6631.2%American Indian alone
- 14,8060.7%Native Hawaiian and Other
Pacific Islander alone - 16,1370.7%Black alone
- 1,9480.09%Other race alone

-
- 2,557,46675.6%White alone
- 512,08615.1%Hispanic
- 119,3083.5%Two or more races
- 82,3882.4%Asian alone
- 36,9781.1%Native Hawaiian and Other
Pacific Islander alone - 34,8731.0%Black alone
- 22,8030.7%American Indian alone
- 14,8980.4%Other race alone

Income and house value in South Davis
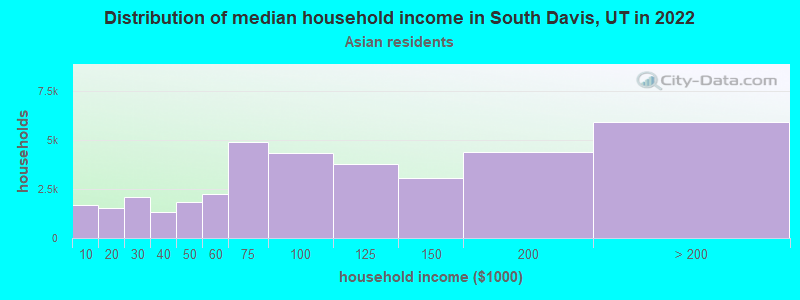
- Median household income in 2022
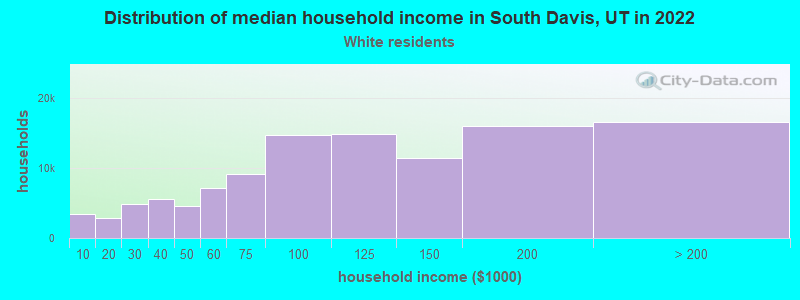
- $113,695White non-Hispanic householders
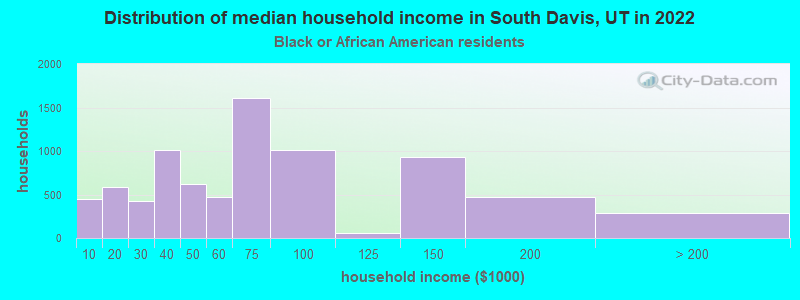
- $46,910Black householders
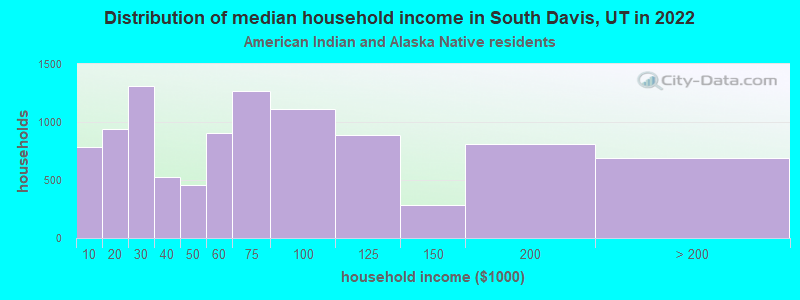
- $85,917American Indian and Alaska Native householders
- $102,160Asian householders
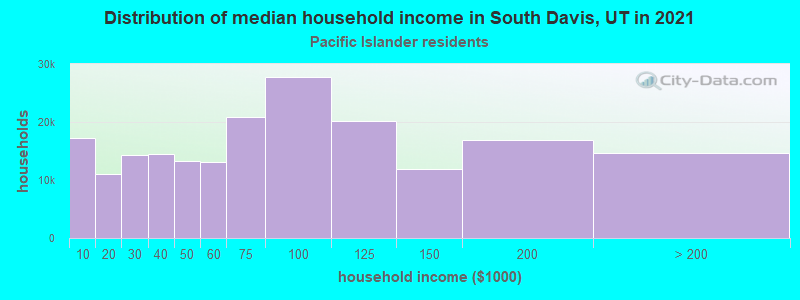
- $105,254Native Hawaiian and other Pacific Islander householders
- $75,796Some other race householders
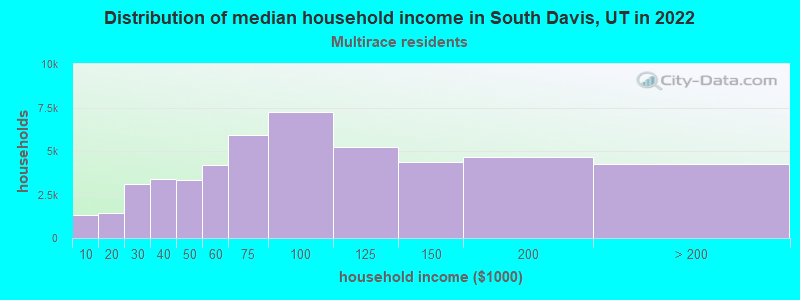
- $112,776Two or more races householders
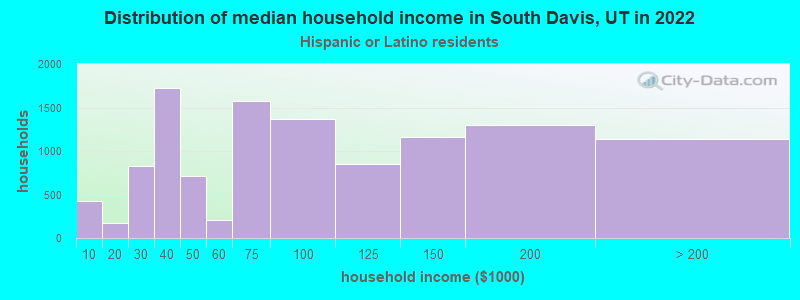
- $81,100Hispanic or Latino race householders
- Median 2022 house value
- $608,813White Non-Hispanic householders
- $475,906American Indian or Alaska Native householders
- $601,545Asian householders
- $494,250Native Hawaiian and other Pacific Islander householders
- $593,584Some other race householders
- $506,364Two or more races householders
- $568,664Hispanic or Latino householders
Household income for White non-Hispanic householders
Household income for Black householders
Household income for American Indian and Alaska Native householders
Household income for Asian householders
Household income for Native Hawaiian and other Pacific Islander householders
Household income for Two or more races householders
Household income for Hispanic or Latino race householders
Zip code: 84010