Races in South Elgin, Illinois (IL) Detailed Stats
Data:
Races - White alone (%)
Races - White alone (% change since 2000)
Races - Black alone (%)
Races - Black alone (% change since 2000)
Races - American Indian alone (%)
Races - American Indian alone (% change since 2000)
Races - Asian alone (%)
Races - Asian alone (% change since 2000)
Races - Hispanic (%)
Races - Hispanic (% change since 2000)
Races - Native Hawaiian and Other Pacific Islander alone (%)
Races - Native Hawaiian and Other Pacific Islander alone (% change since 2000)
Races - Two or more races(%)
Races - Two or more races(% change since 2000)
Races - Other race alone (%)
Races - Other race alone (% change since 2000)
Racial diversity
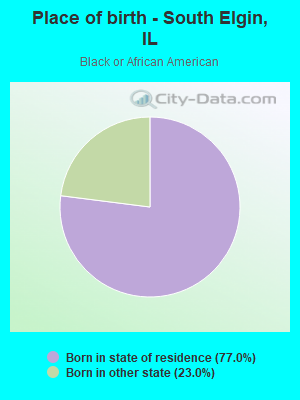
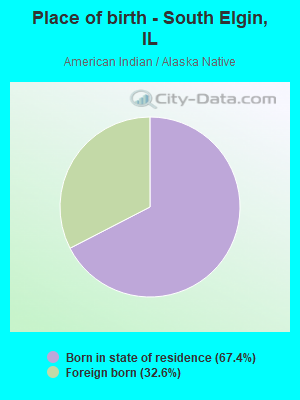
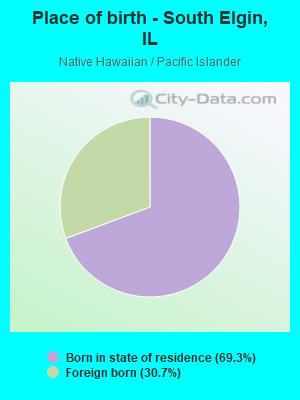
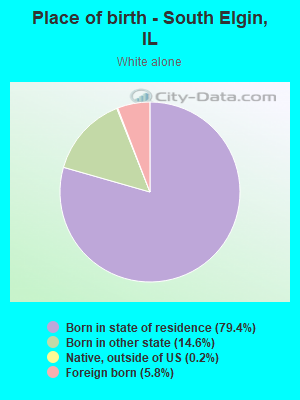
Place of birth - Born in state of residence (%)
Place of birth - Born in state of residence (%) - White
Place of birth - Born in state of residence (%) - Black or African American
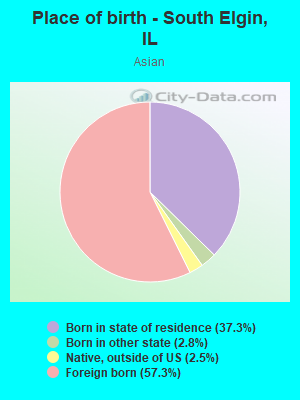
Place of birth - Born in state of residence (%) - Asian
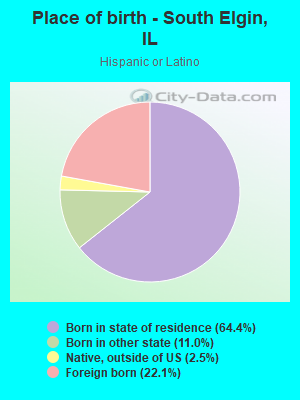
Place of birth - Born in state of residence (%) - Hispanic or Latino
Place of birth - Born in state of residence (%) - American Indian and Alaska Native
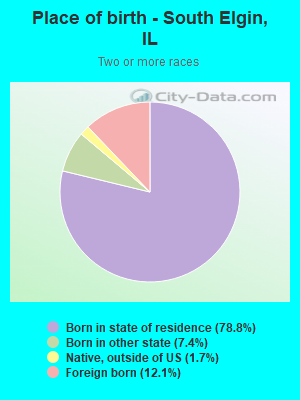
Place of birth - Born in state of residence (%) - Multirace
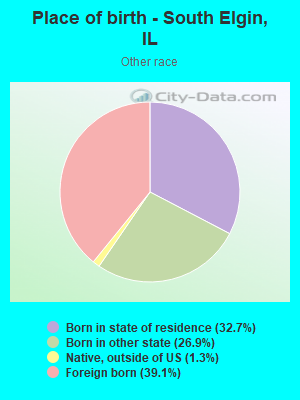
Place of birth - Born in state of residence (%) - Other Race
Place of birth - Born in other state (%)
Place of birth - Born in other state (%) - White
Place of birth - Born in other state (%) - Black or African American
Place of birth - Born in other state (%) - Asian
Place of birth - Born in other state (%) - Hispanic or Latino
Place of birth - Born in other state (%) - American Indian and Alaska Native
Place of birth - Born in other state (%) - Multirace
Place of birth - Born in other state (%) - Other Race
Place of birth - Native, outside of US (%)
Place of birth - Native, outside of US (%) - White
Place of birth - Native, outside of US (%) - Black or African American
Place of birth - Native, outside of US (%) - Asian
Place of birth - Native, outside of US (%) - Hispanic or Latino
Place of birth - Native, outside of US (%) - American Indian and Alaska Native
Place of birth - Native, outside of US (%) - Multirace
Place of birth - Native, outside of US (%) - Other Race
Place of birth - Foreign born (%)
Place of birth - Foreign born (%) - White
Place of birth - Foreign born (%) - Black or African American
Place of birth - Foreign born (%) - Asian
Place of birth - Foreign born (%) - Hispanic or Latino
Place of birth - Foreign born (%) - American Indian and Alaska Native
Place of birth - Foreign born (%) - Multirace
Place of birth - Foreign born (%) - Other Race
Residents speaking English at home (%)
Residents speaking English at home - Born in the United States (%)
Residents speaking English at home - Native, born elsewhere (%)
Residents speaking English at home - Foreign born (%)
Residents speaking Spanish at home (%)
Residents speaking Spanish at home - Born in the United States (%)
Residents speaking Spanish at home - Native, born elsewhere (%)
Residents speaking Spanish at home - Foreign born (%)
Residents speaking other language at home (%)
Residents speaking other language at home - Born in the United States (%)
Residents speaking other language at home - Native, born elsewhere (%)
Residents speaking other language at home - Foreign born (%)
Marital status - Never married (%)
Marital status - Now married (%)
Marital status - Separated (%)
Marital status - Widowed (%)
Marital status - Divorced (%)
Ancestries Reported - Arab (%)
Ancestries Reported - Czech (%)
Ancestries Reported - Danish (%)
Ancestries Reported - Dutch (%)
Ancestries Reported - English (%)
Ancestries Reported - French (%)
Ancestries Reported - French Canadian (%)
Ancestries Reported - German (%)
Ancestries Reported - Greek (%)
Ancestries Reported - Hungarian (%)
Ancestries Reported - Irish (%)
Ancestries Reported - Italian (%)
Ancestries Reported - Lithuanian (%)
Ancestries Reported - Norwegian (%)
Ancestries Reported - Polish (%)
Ancestries Reported - Portuguese (%)
Ancestries Reported - Russian (%)
Ancestries Reported - Scotch-Irish (%)
Ancestries Reported - Scottish (%)
Ancestries Reported - Slovak (%)
Ancestries Reported - Subsaharan African (%)
Ancestries Reported - Swedish (%)
Ancestries Reported - Swiss (%)
Ancestries Reported - Ukrainian (%)
Ancestries Reported - United States (%)
Ancestries Reported - Welsh (%)
Ancestries Reported - West Indian (%)
Ancestries Reported - Other (%)
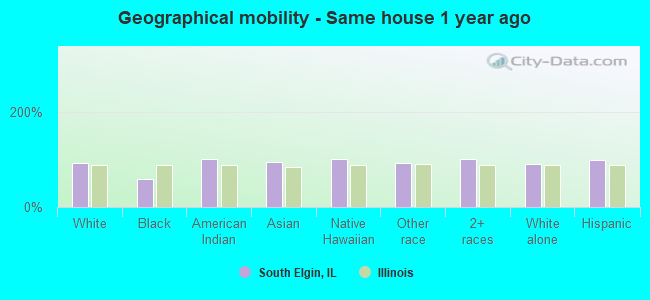
Geographical mobility - Same house 1 year ago (%)
Geographical mobility - Same house 1 year ago (%) - White
Geographical mobility - Same house 1 year ago (%) - Black or African American
Geographical mobility - Same house 1 year ago (%) - Asian
Geographical mobility - Same house 1 year ago (%) - Hispanic or Latino
Geographical mobility - Same house 1 year ago (%) - American Indian and Alaska Native
Geographical mobility - Same house 1 year ago (%) - Multirace
Geographical mobility - Same house 1 year ago (%) - Other Race
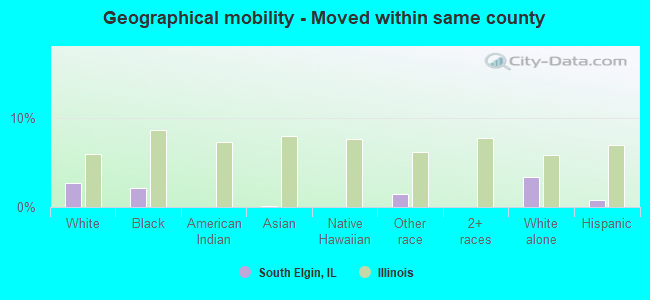
Geographical mobility - Moved within same county (%)
Geographical mobility - Moved within same county (%) - White
Geographical mobility - Moved within same county (%) - Black or African American
Geographical mobility - Moved within same county (%) - Asian
Geographical mobility - Moved within same county (%) - Hispanic or Latino
Geographical mobility - Moved within same county (%) - American Indian and Alaska Native
Geographical mobility - Moved within same county (%) - Multirace
Geographical mobility - Moved within same county (%) - Other Race
Geographical mobility - Moved from different county within same state (%)
Geographical mobility - Moved from different county within same state (%) - White
Geographical mobility - Moved from different county within same state (%) - Black or African American
Geographical mobility - Moved from different county within same state (%) - Asian
Geographical mobility - Moved from different county within same state (%) - Hispanic or Latino
Geographical mobility - Moved from different county within same state (%) - American Indian and Alaska Native
Geographical mobility - Moved from different county within same state (%) - Multirace
Geographical mobility - Moved from different county within same state (%) - Other Race
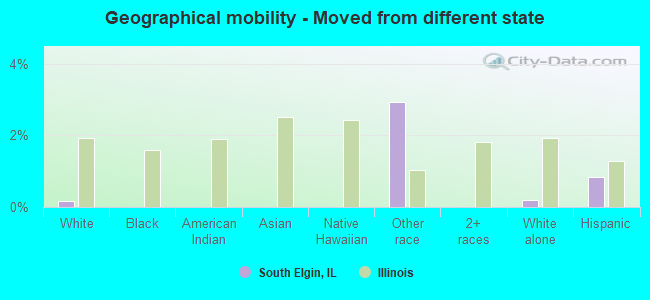
Geographical mobility - Moved from different state (%)
Geographical mobility - Moved from different state (%) - White
Geographical mobility - Moved from different state (%) - Black or African American
Geographical mobility - Moved from different state (%) - Asian
Geographical mobility - Moved from different state (%) - Hispanic or Latino
Geographical mobility - Moved from different state (%) - American Indian and Alaska Native
Geographical mobility - Moved from different state (%) - Multirace
Geographical mobility - Moved from different state (%) - Other Race
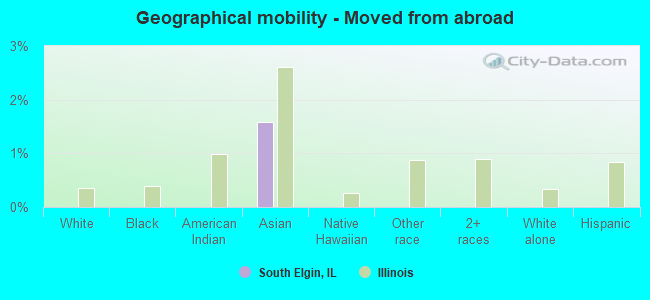
Geographical mobility - Moved from abroad (%)
Geographical mobility - Moved from abroad (%) - White
Geographical mobility - Moved from abroad (%) - Black or African American
Geographical mobility - Moved from abroad (%) - Asian
Geographical mobility - Moved from abroad (%) - Hispanic or Latino
Geographical mobility - Moved from abroad (%) - American Indian and Alaska Native
Geographical mobility - Moved from abroad (%) - Multirace
Geographical mobility - Moved from abroad (%) - Other Race
Place of birth for the foreign-born population - Ireland (%)
Place of birth for the foreign-born population - Denmark (%)
Place of birth for the foreign-born population - Norway (%)
Place of birth for the foreign-born population - Sweden (%)
Place of birth for the foreign-born population - United Kingdom (%)
Place of birth for the foreign-born population - England (%)
Place of birth for the foreign-born population - Scotland (%)
Place of birth for the foreign-born population - Other Northern Europe (%)
Place of birth for the foreign-born population - Austria (%)
Place of birth for the foreign-born population - Belgium (%)
Place of birth for the foreign-born population - France (%)
Place of birth for the foreign-born population - Germany (%)
Place of birth for the foreign-born population - Netherlands (%)
Place of birth for the foreign-born population - Switzerland (%)
Place of birth for the foreign-born population - Other Western Europe (%)
Place of birth for the foreign-born population - Greece (%)
Place of birth for the foreign-born population - Italy (%)
Place of birth for the foreign-born population - Portugal (%)
Place of birth for the foreign-born population - Spain (%)
Place of birth for the foreign-born population - Other Southern Europe (%)
Place of birth for the foreign-born population - Albania (%)
Place of birth for the foreign-born population - Belarus (%)
Place of birth for the foreign-born population - Bosnia and Herzegovina (%)
Place of birth for the foreign-born population - Bulgaria (%)
Place of birth for the foreign-born population - Croatia (%)
Place of birth for the foreign-born population - Czechoslovakia (%)
Place of birth for the foreign-born population - Hungary (%)
Place of birth for the foreign-born population - Latvia (%)
Place of birth for the foreign-born population - Lithuania (%)
Place of birth for the foreign-born population - North Macedonia (Macedonia) (%)
Place of birth for the foreign-born population - Moldova (%)
Place of birth for the foreign-born population - Poland (%)
Place of birth for the foreign-born population - Romania (%)
Place of birth for the foreign-born population - Russia (%)
Place of birth for the foreign-born population - Serbia (%)
Place of birth for the foreign-born population - Ukraine (%)
Place of birth for the foreign-born population - Other Eastern Europe (%)
Place of birth for the foreign-born population - China (%)
Place of birth for the foreign-born population - Hong Kong (%)
Place of birth for the foreign-born population - Taiwan (%)
Place of birth for the foreign-born population - Japan (%)
Place of birth for the foreign-born population - Korea (%)
Place of birth for the foreign-born population - Other Eastern Asia (%)
Place of birth for the foreign-born population - Afghanistan (%)
Place of birth for the foreign-born population - Bangladesh (%)
Place of birth for the foreign-born population - India (%)
Place of birth for the foreign-born population - Iran (%)
Place of birth for the foreign-born population - Kazakhstan (%)
Place of birth for the foreign-born population - Nepal (%)
Place of birth for the foreign-born population - Pakistan (%)
Place of birth for the foreign-born population - Sri Lanka (%)
Place of birth for the foreign-born population - Uzbekistan (%)
Place of birth for the foreign-born population - Other South Central Asia (%)
Place of birth for the foreign-born population - Burma (%)
Place of birth for the foreign-born population - Cambodia (%)
Place of birth for the foreign-born population - Indonesia (%)
Place of birth for the foreign-born population - Laos (%)
Place of birth for the foreign-born population - Malaysia (%)
Place of birth for the foreign-born population - Philippines (%)
Place of birth for the foreign-born population - Singapore (%)
Place of birth for the foreign-born population - Thailand (%)
Place of birth for the foreign-born population - Vietnam (%)
Place of birth for the foreign-born population - Other South Eastern Asia (%)
Place of birth for the foreign-born population - Armenia (%)
Place of birth for the foreign-born population - Iraq (%)
Place of birth for the foreign-born population - Israel (%)
Place of birth for the foreign-born population - Jordan (%)
Place of birth for the foreign-born population - Kuwait (%)
Place of birth for the foreign-born population - Lebanon (%)
Place of birth for the foreign-born population - Saudi Arabia (%)
Place of birth for the foreign-born population - Syria (%)
Place of birth for the foreign-born population - Turkey (%)
Place of birth for the foreign-born population - Yemen (%)
Place of birth for the foreign-born population - Other Western Asia (%)
Place of birth for the foreign-born population - Eritrea (%)
Place of birth for the foreign-born population - Ethiopia (%)
Place of birth for the foreign-born population - Kenya (%)
Place of birth for the foreign-born population - Somalia (%)
Place of birth for the foreign-born population - Uganda (%)
Place of birth for the foreign-born population - Zimbabwe (%)
Place of birth for the foreign-born population - Other Eastern Africa (%)
Place of birth for the foreign-born population - Cameroon (%)
Place of birth for the foreign-born population - Congo (%)
Place of birth for the foreign-born population - Democratic Republic of Congo (Zaire) (%)
Place of birth for the foreign-born population - Other Middle Africa (%)
Place of birth for the foreign-born population - Egypt (%)
Place of birth for the foreign-born population - Morocco (%)
Place of birth for the foreign-born population - Sudan (%)
Place of birth for the foreign-born population - Other Northern Africa (%)
Place of birth for the foreign-born population - South Africa (%)
Place of birth for the foreign-born population - Other Southern Africa (%)
Place of birth for the foreign-born population - Cabo Verde (%)
Place of birth for the foreign-born population - Ghana (%)
Place of birth for the foreign-born population - Liberia (%)
Place of birth for the foreign-born population - Nigeria (%)
Place of birth for the foreign-born population - Senegal (%)
Place of birth for the foreign-born population - Sierra Leone (%)
Place of birth for the foreign-born population - Other Western Africa (%)
Place of birth for the foreign-born population - Australia (%)
Place of birth for the foreign-born population - New Zealand (%)
Place of birth for the foreign-born population - Fiji (%)
Place of birth for the foreign-born population - Micronesia (%)
Place of birth for the foreign-born population - Bahamas (%)
Place of birth for the foreign-born population - Barbados (%)
Place of birth for the foreign-born population - Cuba (%)
Place of birth for the foreign-born population - Dominica (%)
Place of birth for the foreign-born population - Dominican Republic (%)
Place of birth for the foreign-born population - Grenada (%)
Place of birth for the foreign-born population - Haiti (%)
Place of birth for the foreign-born population - Jamaica (%)
Place of birth for the foreign-born population - St. Vincent and the Grenadines (%)
Place of birth for the foreign-born population - Trinidad and Tobago (%)
Place of birth for the foreign-born population - West Indies (%)
Place of birth for the foreign-born population - Other Caribbean (%)
Place of birth for the foreign-born population - Belize (%)
Place of birth for the foreign-born population - Costa Rica (%)
Place of birth for the foreign-born population - El Salvador (%)
Place of birth for the foreign-born population - Guatemala (%)
Place of birth for the foreign-born population - Honduras (%)
Place of birth for the foreign-born population - Mexico (%)
Place of birth for the foreign-born population - Nicaragua (%)
Place of birth for the foreign-born population - Panama (%)
Place of birth for the foreign-born population - Other Central America (%)
Place of birth for the foreign-born population - Argentina (%)
Place of birth for the foreign-born population - Bolivia (%)
Place of birth for the foreign-born population - Brazil (%)
Place of birth for the foreign-born population - Chile (%)
Place of birth for the foreign-born population - Colombia (%)
Place of birth for the foreign-born population - Ecuador (%)
Place of birth for the foreign-born population - Guyana (%)
Place of birth for the foreign-born population - Peru (%)
Place of birth for the foreign-born population - Uruguay (%)
Place of birth for the foreign-born population - Venezuela (%)
Place of birth for the foreign-born population - Other South America (%)
Place of birth for the foreign-born population - Canada (%)
Place of birth for the foreign-born population - Other Northern America (%)
Place of birth for the foreign-born population - Other (%)
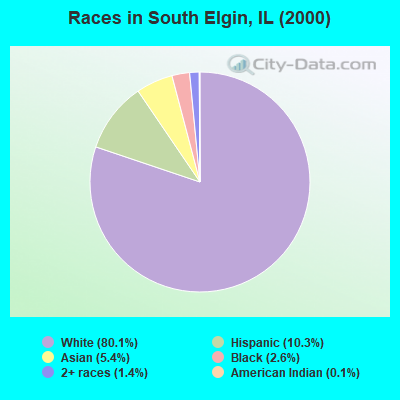
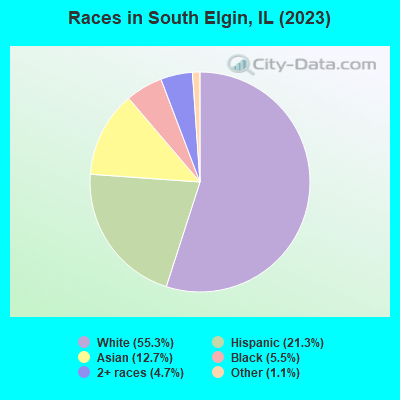
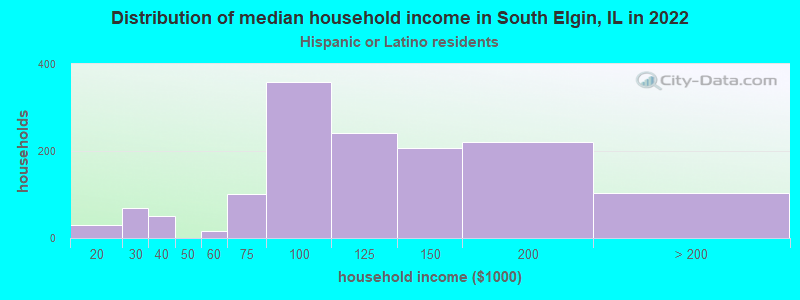
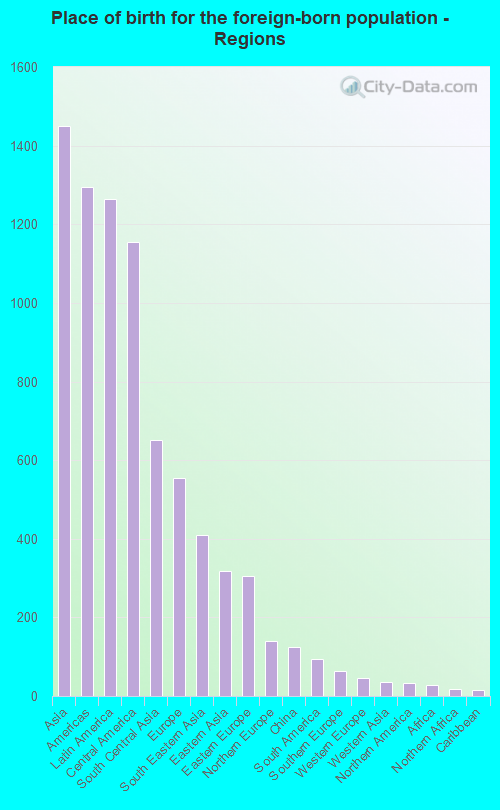
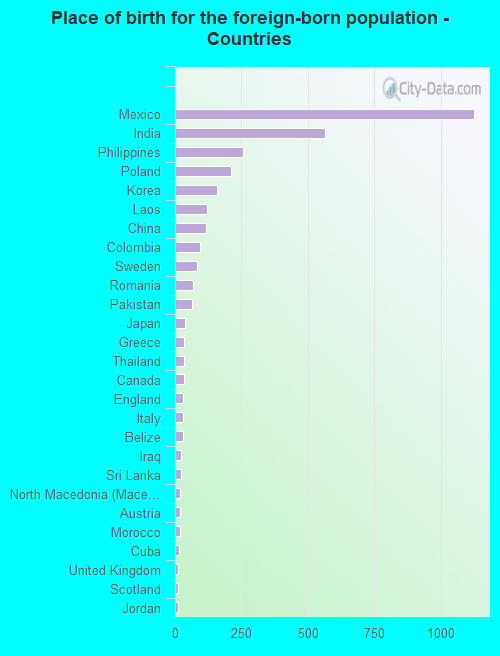
According to 2022 data, the most numerous races in South Elgin, IL are White alone (13,557 residents), Hispanic (5,700 residents), and Black alone (1,120 residents). 75.0% of South Elgin residents speak English at home. 14.1% of South Elgin, IL residents are foreign-born (6.1% born in Asia, 5.3% born in Latin America, 2.3% born in Europe), which is about the same as the foreign-born rate of 14.0% across the entire state of Illinois.
Race distribution in South Elgin
2000 2022
8,424,140 67.8% White alone 1,856,152 14.9% Black alone 1,530,262 12.3% Hispanic 419,916 3.4% Asian alone 153,996 1.2% Two or more races 13,479 0.1% Other race alone 18,232 0.1% American Indian alone 3,116 0.03% Native Hawaiian and Other
7,356,301 58.5% White alone 2,299,726 18.3% Hispanic 1,660,423 13.2% Black alone 747,296 5.9% Asian alone 458,599 3.6% Two or more races 45,386 0.4% Other race alone 10,405 0.08% American Indian alone 3,896 0.03% Native Hawaiian and Other
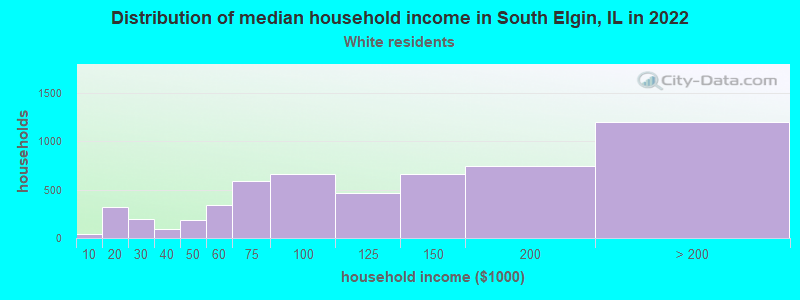
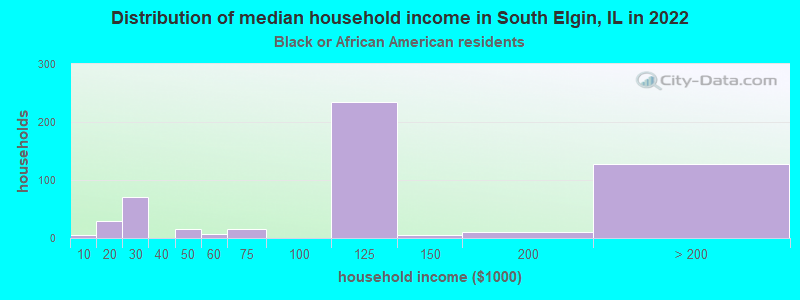
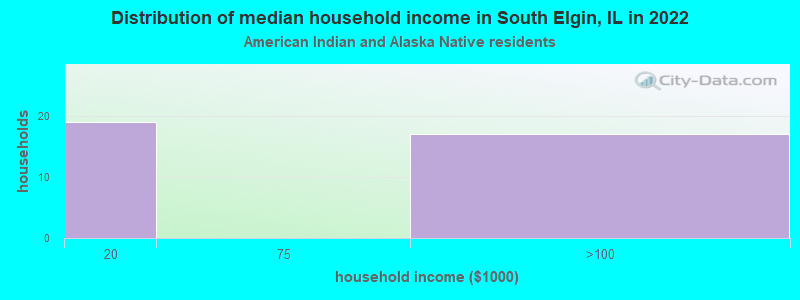
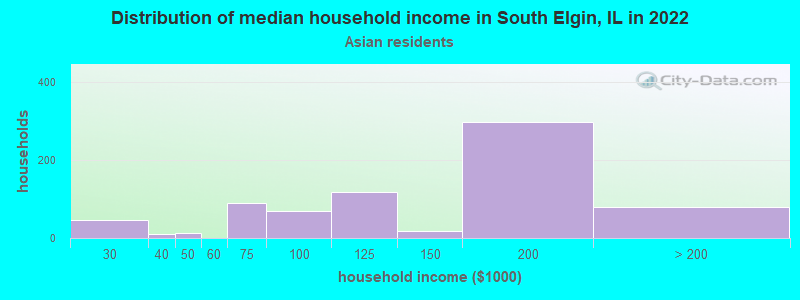
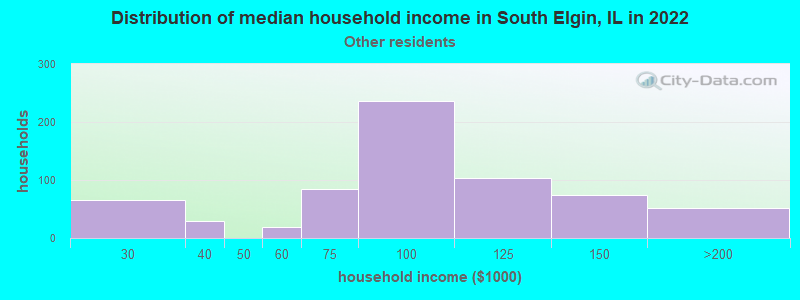
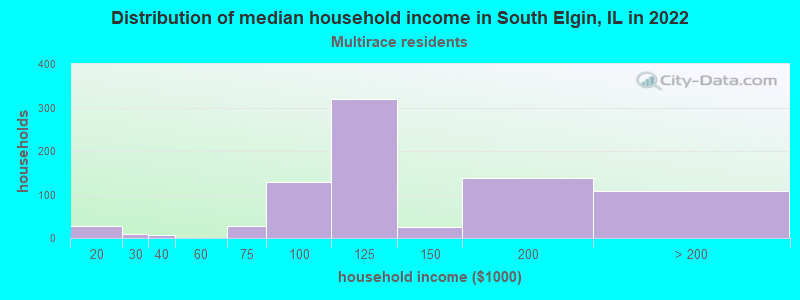
Income and house value in South Elgin Median household income in 2022 $110,906 White non-Hispanic householders$141,168 Black householders$148,617 Asian householders$98,614 Some other race householders$121,357 Two or more races householders$120,320 Hispanic or Latino race householdersMedian 2022 house value $305,190 White Non-Hispanic householders$323,295 Black or African American householders$282,510 American Indian or Alaska Native householders $314,939 Asian householders$312,552 Some other race householders$361,096 Two or more races householders$297,829 Hispanic or Latino householders
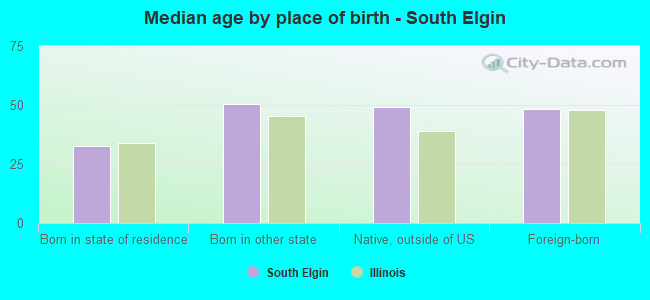
Median age by race in South Elgin
44.3 Median age for White residents41.4 48.7 36.5 Median age for Black or African American residents19.2 50.1 23.8 Median age for American Indian / Alaska Native residents11.7 65.7 37.9 Median age for Asian residents43.5 35.3 7.2 Median age for Native Hawaiian / Pacific Islander residents-658,536,584.7 7.3 38.9 Median age for Other race residents42.8 29.1 23.5 Median age for Two or more races residents20.4 42.7 46.4 Median age for White alone residents43.8 47.9 28.7 Median age for Hispanic or Latino residents24.1 32.1
Owner/renter occupied households by race in South Elgin
House owners and renters - White residents 4,405 80.8% Owner occupied1,047 19.2% Renter occupiedHouse owners and renters - Black or African American residents 379 76.0% Owner occupied120 24.0% Renter occupiedHouse owners and renters - American Indian / Alaska Native residents 28 100.0% Owner occupiedHouse owners and renters - Asian residents 812 98.1% Owner occupied16 1.9% Renter occupiedHouse owners and renters - Other race residents 405 63.8% Owner occupied230 36.2% Renter occupiedHouse owners and renters - Two or more races residents 718 91.2% Owner occupied69 8.8% Renter occupiedHouse owners and renters - White alone residents 4,403 80.4% Owner occupied1,074 19.6% Renter occupiedHouse owners and renters - Hispanic or Latino residents 1,019 73.9% Owner occupied359 26.1% Renter occupied
Language usage in South Elgin
English speakers - Total 75.0% of residents of South Elgin speak English at home.
13.6% of residents speak Spanish at home 2,096 67.8% Speak English very well994 32.2% Speak English less than very well12.1% of residents speak other language at home 1,879 68.7% Speak English very well857 31.3% Speak English less than very well
English speakers - Born in the United States 85.8% of residents of South Elgin speak English at home.
7.8% of residents speak Spanish at home 199 81.6% Speak English very well45 18.4% Speak English less than very well5.8% of residents speak other language at home 181 100.0% Speak English very well
English speakers - Native, born elsewhere 10.3% of residents of South Elgin speak English at home.
46.7% of residents speak Spanish at home 109 89.3% Speak English very well13 10.7% Speak English less than very well60.9% of residents speak other language at home 159 100.0% Speak English less than very well
English speakers - Foreign-born 15.4% of residents of South Elgin speak English at home.
33.7% of residents speak Spanish at home 400 34.5% Speak English very well759 65.5% Speak English less than very well53.7% of residents speak other language at home 1,220 66.1% Speak English very well627 33.9% Speak English less than very well
White (Caucasian) - Speak only English Native:
96.8% (12,801)Foreign-born:
52.0% (293)
White (Caucasian) - Speak another language Native:
4.0% (534)Foreign-born:
59.9% (337)
American Indian / Alaska Native - Speak another language Native:
59.7% (39)Foreign-born:
100.0% (33)
Asian - Speak only English Native:
44.1% (431)Foreign-born:
7.3% (103)
Asian - Speak another language Native:
58.3% (571)Foreign-born:
92.7% (1,302)
Native Hawaiian / Pacific Islander - Speak another language Native:
23.5% (29)Foreign-born:
100.0% (63)
Other race - Speak only English Native:
49.8% (593)Foreign-born:
6.6% (52)
Other race - Speak another language Native:
54.3% (647)Foreign-born:
93.3% (746)
Two or more races - Speak only English Native:
71.2% (1,620)Foreign-born:
7.4% (28)
Two or more races - Speak another language Native:
29.8% (677)Foreign-born:
92.8% (346)
White alone - Speak only English Native:
97.8% (12,024)Foreign-born:
35.4% (281)
White alone - Speak another language Native:
2.2% (275)Foreign-born:
64.3% (511)
Hispanic or Latino - Speak only English Native:
56.2% (2,332)Foreign-born:
8.9% (112)
Hispanic or Latino - Speak another language Native:
44.2% (1,834)Foreign-born:
91.9% (1,157)
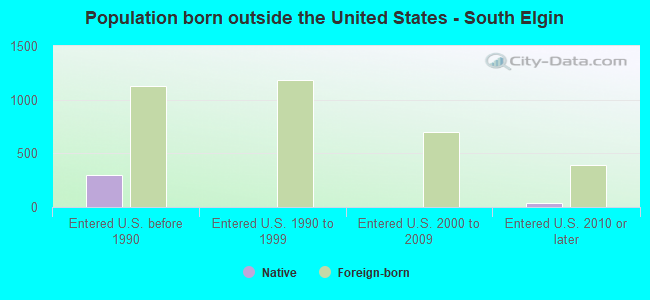
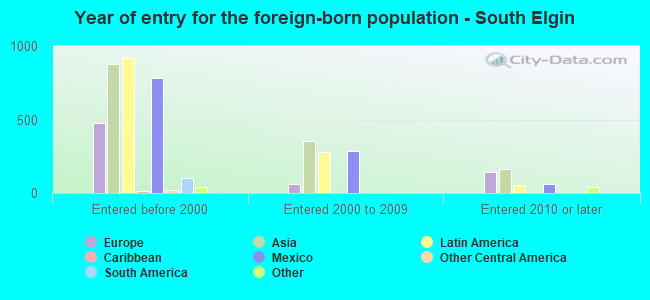
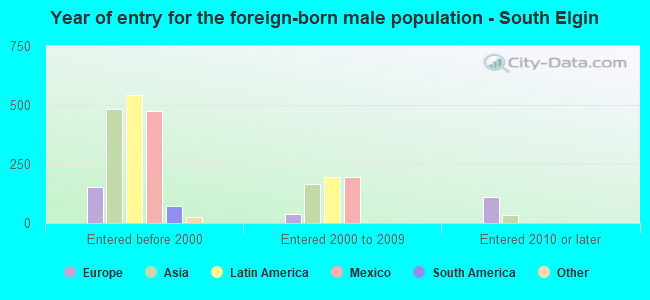
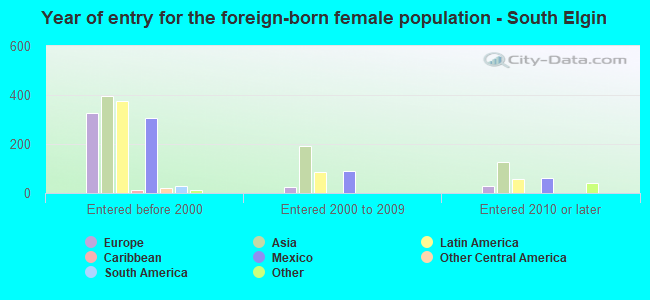
Foreign-born residents in South Elgin 3,331 residents are foreign born (6.1% Asia , 5.3% Latin America , 2.3% Europe ).
This city:
14.1%Illinois:
14.1%
Marital status for residents in South Elgin Marital status - White (Caucasian) population 15 years and over
Males 33.7% Never married56.9% Now married1.2% Separated0.6% Widowed7.5% DivorcedFemales 25.7% Never married51.8% Now married1.3% Separated6.8% Widowed14.5% DivorcedWomen who gave birth in the past 12 months Now married:
84.3% (112)Unmarried:
15.7% (21)
Women who did not give birth in the past 12 months Now married:
48.4% (1,555)Unmarried:
51.6% (1,658)
Marital status - Black or African American population 15 years and over
Males 60.2% Never married39.8% Now married0.0% Separated0.0% Widowed0.0% DivorcedFemales 17.5% Never married64.2% Now married7.0% Separated0.0% Widowed11.3% DivorcedWomen who did not give birth in the past 12 months Now married:
73.7% (108)Unmarried:
26.3% (39)
Marital status - American Indian / Alaska Native population 15 years and over
Males 52.4% Never married47.6% Now married0.0% Separated0.0% Widowed0.0% DivorcedFemales 47.2% Never married27.8% Now married0.0% Separated0.0% Widowed25.0% DivorcedWomen who did not give birth in the past 12 months Now married:
27.8% (17)Unmarried:
72.2% (43)
Marital status - Asian population 15 years and over
Males 23.1% Never married67.5% Now married0.0% Separated0.0% Widowed9.4% DivorcedFemales 12.8% Never married76.0% Now married0.0% Separated7.6% Widowed3.7% DivorcedWomen who gave birth in the past 12 months Now married:
62.6% (76)Unmarried:
37.4% (45)
Women who did not give birth in the past 12 months Now married:
80.7% (363)Unmarried:
19.3% (87)
Marital status - Other race population 15 years and over
Males 24.3% Never married58.2% Now married7.6% Separated0.0% Widowed9.8% DivorcedFemales 32.0% Never married58.5% Now married4.0% Separated0.0% Widowed5.5% DivorcedWomen who did not give birth in the past 12 months Now married:
61.5% (398)Unmarried:
38.5% (250)
Marital status - Two or more races population 15 years and over
Males 54.7% Never married45.3% Now married0.0% Separated0.0% Widowed0.0% DivorcedFemales 22.3% Never married70.6% Now married3.8% Separated0.7% Widowed2.7% DivorcedWomen who gave birth in the past 12 months Now married:
0.0% (0)Unmarried:
100.0% (21)
Women who did not give birth in the past 12 months Now married:
70.2% (354)Unmarried:
29.8% (150)
Marital status - White alone, not Hispanic / Latino population 15 years and over
Males 31.1% Never married60.3% Now married1.0% Separated0.7% Widowed6.9% DivorcedFemales 24.2% Never married51.9% Now married1.4% Separated7.4% Widowed15.1% DivorcedWomen who gave birth in the past 12 months Now married:
75.7% (75)Unmarried:
24.3% (24)
Women who did not give birth in the past 12 months Now married:
49.2% (1,521)Unmarried:
50.8% (1,570)
Marital status - Hispanic or Latino population 15 years and over
Males 41.9% Never married47.3% Now married3.3% Separated0.0% Widowed7.5% DivorcedFemales 33.3% Never married56.5% Now married2.3% Separated1.0% Widowed6.8% DivorcedWomen who gave birth in the past 12 months Now married:
80.8% (60)Unmarried:
19.2% (14)
Women who did not give birth in the past 12 months Now married:
54.3% (801)Unmarried:
45.7% (675)
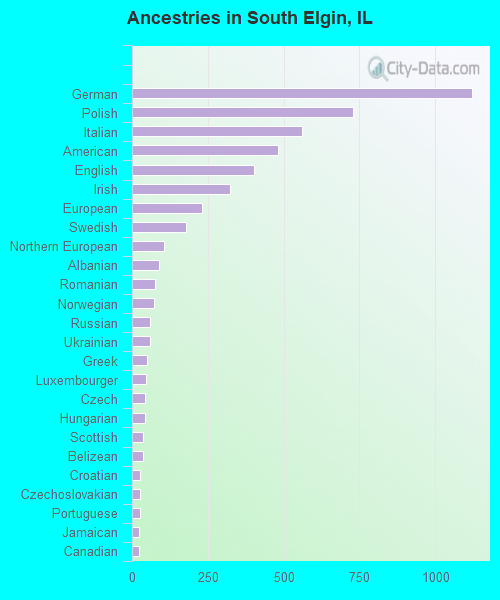
Ancestries in South Elgin
1,121 10.5% German729 6.8% Polish559 5.2% Italian482 4.5% American403 3.8% English322 3.0% Irish232 2.2% European177 1.7% Swedish104 1.0% Northern European89 0.8% Albanian76 0.7% Romanian71 0.7% Norwegian60 0.6% Russian59 0.6% Ukrainian50 0.5% Greek47 0.4% Luxembourger44 0.4% Czech43 0.4% Hungarian36 0.3% Scottish35 0.3% Belizean28 0.3% Croatian27 0.3% Czechoslovakian26 0.2% Portuguese24 0.2% Jamaican23 0.2% Canadian21 0.2% Eastern European20 0.2% French Canadian18 0.2% Moroccan18 0.2% Palestinian18 0.2% Danish12 0.1% French11 0.1% Arab11 0.1% British7 0.07% Swiss6 0.06% Jordanian
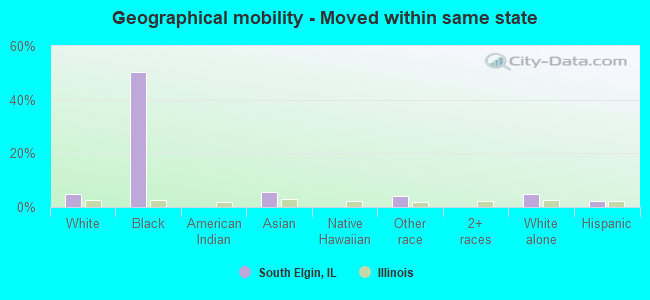
Geographical mobility in South Elgin Same house 1 year ago 13,025 92.7% White (Caucasian)640 59.1% Black or African American104 99.7% American Indian / Alaska Native2,306 94.7% Asian153 100.0% Native Hawaiian / Pacific Islander1,854 91.7% Other race3,104 100.0% Two or more races12,330 91.3% White alone, not Hispanic / Latino5,536 98.2% Hispanic or LatinoMoved within same county 371 2.6% White / Caucasian23 2.1% Black or African American4 0.2% Asian29 1.4% Other race448 3.3% White alone, not Hispanic / Latino42 0.7% Hispanic or LatinoMoved within same state 657 4.7% White / Caucasian544 50.2% Black or African American135 5.5% Asian85 4.2% Other race673 5.0% White alone, not Hispanic / Latino123 2.2% Hispanic or LatinoMoved from different state 23 0.2% White / Caucasian59 2.9% Other race26 0.2% White alone, not Hispanic / Latino48 0.9% Hispanic or LatinoMoved from abroad 39 1.6% Asian
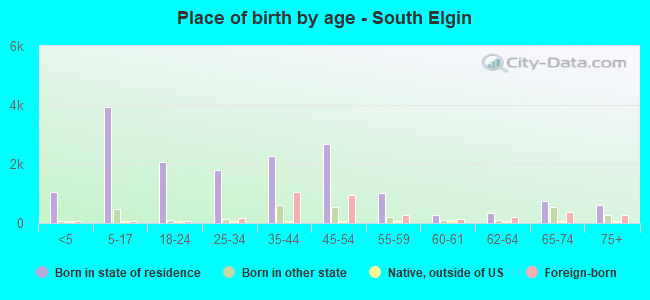
Children Nativity (place of birth) in South Elgin
Children under 6 years - Living with two parents Both parents native 761 100.0% NativeBoth parents foreign-born 131 100.0% NativeOne native, one foreign-born parent 210 100.0% NativeChildren under 6 years - Living with one parent Native parent 289 100.0% NativeForeign-born parent 25 100.0% NativeChildren 6 to 17 years - Living with two parents Both parents native 2,193 100.0% NativeBoth parents foreign-born 583 93.2% Native42 6.8% Foreign-bornOne native, one foreign-born parent 487 100.0% NativeChildren 6 to 17 years - Living with one parent Native parent 538 100.0% NativeForeign-born parent 86 51.0% Native83 49.0% Foreign-born
Grandparents responsible for own grandchildren in South Elgin
Grandparents (30 to 59 years) White / Caucasian 37 100.0% Not responsible for grandchildrenAsian 68 100.0% Not responsible for grandchildrenTwo or more races 73 100.0% Not responsible for grandchildrenWhite alone, not Hispanic / Latino 13 100.0% Not responsible for grandchildrenHispanic or Latino 64 100.0% Not responsible for grandchildrenGrandparents (60 years and over) White / Caucasian 19 13.9% Responsible for grandchildren117 86.1% Not responsible for grandchildrenAsian 25 100.0% Not responsible for grandchildrenWhite alone, not Hispanic / Latino 20 23.2% Responsible for grandchildren67 76.8% Not responsible for grandchildrenHispanic or Latino 81 100.0% Not responsible for grandchildren