Races in South Euclid, Ohio (OH) Detailed Stats
Data:
Races - White alone (%)
Races - White alone (% change since 2000)
Races - Black alone (%)
Races - Black alone (% change since 2000)
Races - American Indian alone (%)
Races - American Indian alone (% change since 2000)
Races - Asian alone (%)
Races - Asian alone (% change since 2000)
Races - Hispanic (%)
Races - Hispanic (% change since 2000)
Races - Native Hawaiian and Other Pacific Islander alone (%)
Races - Native Hawaiian and Other Pacific Islander alone (% change since 2000)
Races - Two or more races(%)
Races - Two or more races(% change since 2000)
Races - Other race alone (%)
Races - Other race alone (% change since 2000)
Racial diversity
Place of birth - Born in state of residence (%)
Place of birth - Born in state of residence (%) - White
Place of birth - Born in state of residence (%) - Black or African American
Place of birth - Born in state of residence (%) - Asian
Place of birth - Born in state of residence (%) - Hispanic or Latino
Place of birth - Born in state of residence (%) - American Indian and Alaska Native
Place of birth - Born in state of residence (%) - Multirace
Place of birth - Born in state of residence (%) - Other Race
Place of birth - Born in other state (%)
Place of birth - Born in other state (%) - White
Place of birth - Born in other state (%) - Black or African American
Place of birth - Born in other state (%) - Asian
Place of birth - Born in other state (%) - Hispanic or Latino
Place of birth - Born in other state (%) - American Indian and Alaska Native
Place of birth - Born in other state (%) - Multirace
Place of birth - Born in other state (%) - Other Race
Place of birth - Native, outside of US (%)
Place of birth - Native, outside of US (%) - White
Place of birth - Native, outside of US (%) - Black or African American
Place of birth - Native, outside of US (%) - Asian
Place of birth - Native, outside of US (%) - Hispanic or Latino
Place of birth - Native, outside of US (%) - American Indian and Alaska Native
Place of birth - Native, outside of US (%) - Multirace
Place of birth - Native, outside of US (%) - Other Race
Place of birth - Foreign born (%)
Place of birth - Foreign born (%) - White
Place of birth - Foreign born (%) - Black or African American
Place of birth - Foreign born (%) - Asian
Place of birth - Foreign born (%) - Hispanic or Latino
Place of birth - Foreign born (%) - American Indian and Alaska Native
Place of birth - Foreign born (%) - Multirace
Place of birth - Foreign born (%) - Other Race
Residents speaking English at home (%)
Residents speaking English at home - Born in the United States (%)
Residents speaking English at home - Native, born elsewhere (%)
Residents speaking English at home - Foreign born (%)
Residents speaking Spanish at home (%)
Residents speaking Spanish at home - Born in the United States (%)
Residents speaking Spanish at home - Native, born elsewhere (%)
Residents speaking Spanish at home - Foreign born (%)
Residents speaking other language at home (%)
Residents speaking other language at home - Born in the United States (%)
Residents speaking other language at home - Native, born elsewhere (%)
Residents speaking other language at home - Foreign born (%)
Marital status - Never married (%)
Marital status - Now married (%)
Marital status - Separated (%)
Marital status - Widowed (%)
Marital status - Divorced (%)
Ancestries Reported - Arab (%)
Ancestries Reported - Czech (%)
Ancestries Reported - Danish (%)
Ancestries Reported - Dutch (%)
Ancestries Reported - English (%)
Ancestries Reported - French (%)
Ancestries Reported - French Canadian (%)
Ancestries Reported - German (%)
Ancestries Reported - Greek (%)
Ancestries Reported - Hungarian (%)
Ancestries Reported - Irish (%)
Ancestries Reported - Italian (%)
Ancestries Reported - Lithuanian (%)
Ancestries Reported - Norwegian (%)
Ancestries Reported - Polish (%)
Ancestries Reported - Portuguese (%)
Ancestries Reported - Russian (%)
Ancestries Reported - Scotch-Irish (%)
Ancestries Reported - Scottish (%)
Ancestries Reported - Slovak (%)
Ancestries Reported - Subsaharan African (%)
Ancestries Reported - Swedish (%)
Ancestries Reported - Swiss (%)
Ancestries Reported - Ukrainian (%)
Ancestries Reported - United States (%)
Ancestries Reported - Welsh (%)
Ancestries Reported - West Indian (%)
Ancestries Reported - Other (%)
Geographical mobility - Same house 1 year ago (%)
Geographical mobility - Same house 1 year ago (%) - White
Geographical mobility - Same house 1 year ago (%) - Black or African American
Geographical mobility - Same house 1 year ago (%) - Asian
Geographical mobility - Same house 1 year ago (%) - Hispanic or Latino
Geographical mobility - Same house 1 year ago (%) - American Indian and Alaska Native
Geographical mobility - Same house 1 year ago (%) - Multirace
Geographical mobility - Same house 1 year ago (%) - Other Race
Geographical mobility - Moved within same county (%)
Geographical mobility - Moved within same county (%) - White
Geographical mobility - Moved within same county (%) - Black or African American
Geographical mobility - Moved within same county (%) - Asian
Geographical mobility - Moved within same county (%) - Hispanic or Latino
Geographical mobility - Moved within same county (%) - American Indian and Alaska Native
Geographical mobility - Moved within same county (%) - Multirace
Geographical mobility - Moved within same county (%) - Other Race
Geographical mobility - Moved from different county within same state (%)
Geographical mobility - Moved from different county within same state (%) - White
Geographical mobility - Moved from different county within same state (%) - Black or African American
Geographical mobility - Moved from different county within same state (%) - Asian
Geographical mobility - Moved from different county within same state (%) - Hispanic or Latino
Geographical mobility - Moved from different county within same state (%) - American Indian and Alaska Native
Geographical mobility - Moved from different county within same state (%) - Multirace
Geographical mobility - Moved from different county within same state (%) - Other Race
Geographical mobility - Moved from different state (%)
Geographical mobility - Moved from different state (%) - White
Geographical mobility - Moved from different state (%) - Black or African American
Geographical mobility - Moved from different state (%) - Asian
Geographical mobility - Moved from different state (%) - Hispanic or Latino
Geographical mobility - Moved from different state (%) - American Indian and Alaska Native
Geographical mobility - Moved from different state (%) - Multirace
Geographical mobility - Moved from different state (%) - Other Race
Geographical mobility - Moved from abroad (%)
Geographical mobility - Moved from abroad (%) - White
Geographical mobility - Moved from abroad (%) - Black or African American
Geographical mobility - Moved from abroad (%) - Asian
Geographical mobility - Moved from abroad (%) - Hispanic or Latino
Geographical mobility - Moved from abroad (%) - American Indian and Alaska Native
Geographical mobility - Moved from abroad (%) - Multirace
Geographical mobility - Moved from abroad (%) - Other Race
Place of birth for the foreign-born population - Ireland (%)
Place of birth for the foreign-born population - Denmark (%)
Place of birth for the foreign-born population - Norway (%)
Place of birth for the foreign-born population - Sweden (%)
Place of birth for the foreign-born population - United Kingdom (%)
Place of birth for the foreign-born population - England (%)
Place of birth for the foreign-born population - Scotland (%)
Place of birth for the foreign-born population - Other Northern Europe (%)
Place of birth for the foreign-born population - Austria (%)
Place of birth for the foreign-born population - Belgium (%)
Place of birth for the foreign-born population - France (%)
Place of birth for the foreign-born population - Germany (%)
Place of birth for the foreign-born population - Netherlands (%)
Place of birth for the foreign-born population - Switzerland (%)
Place of birth for the foreign-born population - Other Western Europe (%)
Place of birth for the foreign-born population - Greece (%)
Place of birth for the foreign-born population - Italy (%)
Place of birth for the foreign-born population - Portugal (%)
Place of birth for the foreign-born population - Spain (%)
Place of birth for the foreign-born population - Other Southern Europe (%)
Place of birth for the foreign-born population - Albania (%)
Place of birth for the foreign-born population - Belarus (%)
Place of birth for the foreign-born population - Bosnia and Herzegovina (%)
Place of birth for the foreign-born population - Bulgaria (%)
Place of birth for the foreign-born population - Croatia (%)
Place of birth for the foreign-born population - Czechoslovakia (%)
Place of birth for the foreign-born population - Hungary (%)
Place of birth for the foreign-born population - Latvia (%)
Place of birth for the foreign-born population - Lithuania (%)
Place of birth for the foreign-born population - North Macedonia (Macedonia) (%)
Place of birth for the foreign-born population - Moldova (%)
Place of birth for the foreign-born population - Poland (%)
Place of birth for the foreign-born population - Romania (%)
Place of birth for the foreign-born population - Russia (%)
Place of birth for the foreign-born population - Serbia (%)
Place of birth for the foreign-born population - Ukraine (%)
Place of birth for the foreign-born population - Other Eastern Europe (%)
Place of birth for the foreign-born population - China (%)
Place of birth for the foreign-born population - Hong Kong (%)
Place of birth for the foreign-born population - Taiwan (%)
Place of birth for the foreign-born population - Japan (%)
Place of birth for the foreign-born population - Korea (%)
Place of birth for the foreign-born population - Other Eastern Asia (%)
Place of birth for the foreign-born population - Afghanistan (%)
Place of birth for the foreign-born population - Bangladesh (%)
Place of birth for the foreign-born population - India (%)
Place of birth for the foreign-born population - Iran (%)
Place of birth for the foreign-born population - Kazakhstan (%)
Place of birth for the foreign-born population - Nepal (%)
Place of birth for the foreign-born population - Pakistan (%)
Place of birth for the foreign-born population - Sri Lanka (%)
Place of birth for the foreign-born population - Uzbekistan (%)
Place of birth for the foreign-born population - Other South Central Asia (%)
Place of birth for the foreign-born population - Burma (%)
Place of birth for the foreign-born population - Cambodia (%)
Place of birth for the foreign-born population - Indonesia (%)
Place of birth for the foreign-born population - Laos (%)
Place of birth for the foreign-born population - Malaysia (%)
Place of birth for the foreign-born population - Philippines (%)
Place of birth for the foreign-born population - Singapore (%)
Place of birth for the foreign-born population - Thailand (%)
Place of birth for the foreign-born population - Vietnam (%)
Place of birth for the foreign-born population - Other South Eastern Asia (%)
Place of birth for the foreign-born population - Armenia (%)
Place of birth for the foreign-born population - Iraq (%)
Place of birth for the foreign-born population - Israel (%)
Place of birth for the foreign-born population - Jordan (%)
Place of birth for the foreign-born population - Kuwait (%)
Place of birth for the foreign-born population - Lebanon (%)
Place of birth for the foreign-born population - Saudi Arabia (%)
Place of birth for the foreign-born population - Syria (%)
Place of birth for the foreign-born population - Turkey (%)
Place of birth for the foreign-born population - Yemen (%)
Place of birth for the foreign-born population - Other Western Asia (%)
Place of birth for the foreign-born population - Eritrea (%)
Place of birth for the foreign-born population - Ethiopia (%)
Place of birth for the foreign-born population - Kenya (%)
Place of birth for the foreign-born population - Somalia (%)
Place of birth for the foreign-born population - Uganda (%)
Place of birth for the foreign-born population - Zimbabwe (%)
Place of birth for the foreign-born population - Other Eastern Africa (%)
Place of birth for the foreign-born population - Cameroon (%)
Place of birth for the foreign-born population - Congo (%)
Place of birth for the foreign-born population - Democratic Republic of Congo (Zaire) (%)
Place of birth for the foreign-born population - Other Middle Africa (%)
Place of birth for the foreign-born population - Egypt (%)
Place of birth for the foreign-born population - Morocco (%)
Place of birth for the foreign-born population - Sudan (%)
Place of birth for the foreign-born population - Other Northern Africa (%)
Place of birth for the foreign-born population - South Africa (%)
Place of birth for the foreign-born population - Other Southern Africa (%)
Place of birth for the foreign-born population - Cabo Verde (%)
Place of birth for the foreign-born population - Ghana (%)
Place of birth for the foreign-born population - Liberia (%)
Place of birth for the foreign-born population - Nigeria (%)
Place of birth for the foreign-born population - Senegal (%)
Place of birth for the foreign-born population - Sierra Leone (%)
Place of birth for the foreign-born population - Other Western Africa (%)
Place of birth for the foreign-born population - Australia (%)
Place of birth for the foreign-born population - New Zealand (%)
Place of birth for the foreign-born population - Fiji (%)
Place of birth for the foreign-born population - Micronesia (%)
Place of birth for the foreign-born population - Bahamas (%)
Place of birth for the foreign-born population - Barbados (%)
Place of birth for the foreign-born population - Cuba (%)
Place of birth for the foreign-born population - Dominica (%)
Place of birth for the foreign-born population - Dominican Republic (%)
Place of birth for the foreign-born population - Grenada (%)
Place of birth for the foreign-born population - Haiti (%)
Place of birth for the foreign-born population - Jamaica (%)
Place of birth for the foreign-born population - St. Vincent and the Grenadines (%)
Place of birth for the foreign-born population - Trinidad and Tobago (%)
Place of birth for the foreign-born population - West Indies (%)
Place of birth for the foreign-born population - Other Caribbean (%)
Place of birth for the foreign-born population - Belize (%)
Place of birth for the foreign-born population - Costa Rica (%)
Place of birth for the foreign-born population - El Salvador (%)
Place of birth for the foreign-born population - Guatemala (%)
Place of birth for the foreign-born population - Honduras (%)
Place of birth for the foreign-born population - Mexico (%)
Place of birth for the foreign-born population - Nicaragua (%)
Place of birth for the foreign-born population - Panama (%)
Place of birth for the foreign-born population - Other Central America (%)
Place of birth for the foreign-born population - Argentina (%)
Place of birth for the foreign-born population - Bolivia (%)
Place of birth for the foreign-born population - Brazil (%)
Place of birth for the foreign-born population - Chile (%)
Place of birth for the foreign-born population - Colombia (%)
Place of birth for the foreign-born population - Ecuador (%)
Place of birth for the foreign-born population - Guyana (%)
Place of birth for the foreign-born population - Peru (%)
Place of birth for the foreign-born population - Uruguay (%)
Place of birth for the foreign-born population - Venezuela (%)
Place of birth for the foreign-born population - Other South America (%)
Place of birth for the foreign-born population - Canada (%)
Place of birth for the foreign-born population - Other Northern America (%)
Place of birth for the foreign-born population - Other (%)
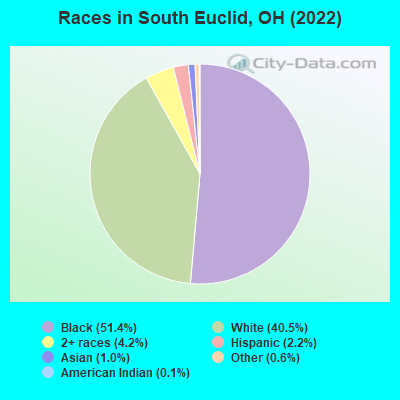
According to 2022 data, the most numerous races in South Euclid, OH are White alone (8,674 residents), Black alone (10,989 residents), and Two or more races (908 residents). 93.9% of South Euclid residents speak English at home. 4.3% of South Euclid, OH residents are foreign-born (1.9% born in Europe, 1.2% born in Latin America, 0.6% born in Asia), which is 6.4% greater than the foreign-born rate of 4.0% across the entire state of Ohio.
Race distribution in South Euclid
2000 2022
9,538,111 84.0% White alone 1,290,662 11.4% Black alone 217,123 1.9% Hispanic 137,770 1.2% Two or more races 131,670 1.2% Asian alone 21,985 0.2% American Indian alone 13,483 0.1% Other race alone 2,336 0.02% Native Hawaiian and Other
8,948,793 76.1% White alone 1,401,403 11.9% Black alone 529,291 4.5% Two or more races 517,232 4.4% Hispanic 293,387 2.5% Asian alone 52,805 0.4% Other race alone 9,785 0.08% American Indian alone 3,362 0.03% Native Hawaiian and Other
Income and house value in South Euclid Median household income in 2022 $75,793 White non-Hispanic householders$79,916 Black householders$70,607 Asian householders$50,163 Some other race householders$65,239 Two or more races householders$53,408 Hispanic or Latino race householdersMedian 2022 house value $138,948 White Non-Hispanic householders$127,273 Black or African American householders$118,292 American Indian or Alaska Native householders $149,982 Asian householders$176,412 Some other race householders$142,797 Two or more races householders$153,959 Hispanic or Latino householders
Median age by race in South Euclid
46.8 Median age for White residents44.0 49.4 31.7 Median age for Black or African American residents24.1 38.8 21.0 Median age for American Indian / Alaska Native residents-734,374,999.3 11.9 28.8 Median age for Asian residents22.5 30.8 -706,093,189.3 Median age for Native Hawaiian / Pacific Islander residents-750,242,953.6 -805,394,989.6 42.5 Median age for Other race residents37.5 16.7 20.1 Median age for Two or more races residents20.1 21.7 46.6 Median age for White alone residents43.6 49.4 21.8 Median age for Hispanic or Latino residents24.0 21.5
Owner/renter occupied households by race in South Euclid
House owners and renters - White residents 3,516 81.1% Owner occupied819 18.9% Renter occupiedHouse owners and renters - Black or African American residents 3,177 76.7% Owner occupied965 23.3% Renter occupiedHouse owners and renters - American Indian / Alaska Native residents 6 100.0% Owner occupiedHouse owners and renters - Asian residents 66 92.9% Owner occupied5 7.1% Renter occupiedHouse owners and renters - Other race residents 128 93.5% Owner occupied9 6.5% Renter occupiedHouse owners and renters - Two or more races residents 236 85.1% Owner occupied41 14.9% Renter occupiedHouse owners and renters - White alone residents 3,540 81.1% Owner occupied824 18.9% Renter occupiedHouse owners and renters - Hispanic or Latino residents 116 56.5% Owner occupied89 43.5% Renter occupied
Language usage in South Euclid
English speakers - Total 93.9% of residents of South Euclid speak English at home.
1.4% of residents speak Spanish at home 156 54.2% Speak English very well132 45.8% Speak English less than very well4.7% of residents speak other language at home 720 75.9% Speak English very well229 24.1% Speak English less than very well
English speakers - Born in the United States 95.9% of residents of South Euclid speak English at home.
0.6% of residents speak Spanish at home 20 100.0% Speak English very well3.7% of residents speak other language at home 119 89.5% Speak English very well14 10.5% Speak English less than very well
English speakers - Native, born elsewhere 84.6% of residents of South Euclid speak English at home.
12.8% of residents speak other language at home 20 100.0% Speak English very well
English speakers - Foreign-born 35.3% of residents of South Euclid speak English at home.
2.6% of residents speak Spanish at home 23 100.0% Speak English very well59.0% of residents speak other language at home 319 61.6% Speak English very well199 38.4% Speak English less than very well
White (Caucasian) - Speak only English Native:
98.1% (7,666)Foreign-born:
24.8% (109)
White (Caucasian) - Speak another language Native:
2.3% (180)Foreign-born:
75.2% (331)
Black or African American - Speak only English Native:
98.8% (9,991)Foreign-born:
43.7% (121)
Black or African American - Speak another language Native:
1.4% (140)Foreign-born:
34.4% (95)
American Indian / Alaska Native - Speak only English Native:
89.9% (24)Foreign-born:
100.0% (12)
Asian - Speak only English Native:
25.7% (22)Foreign-born:
13.5% (14)
Asian - Speak another language Native:
77.1% (65)Foreign-born:
86.5% (89)
Other race - Speak only English Native:
50.7% (128)Foreign-born:
58.5% (23)
Other race - Speak another language Native:
43.2% (109)Foreign-born:
50.3% (20)
Two or more races - Speak only English Native:
86.0% (876)Foreign-born:
94.9% (30)
White alone - Speak only English Native:
97.0% (7,641)Foreign-born:
24.5% (111)
White alone - Speak another language Native:
3.0% (234)Foreign-born:
75.5% (341)
Hispanic or Latino - Speak only English Native:
59.0% (249)Foreign-born:
15.9% (6)
Hispanic or Latino - Speak another language Native:
41.4% (175)Foreign-born:
79.3% (31)
Foreign-born residents in South Euclid 914 residents are foreign born (1.9% Europe , 1.2% Latin America , 0.6% Asia ).
Marital status for residents in South Euclid Marital status - White (Caucasian) population 15 years and over
Males 34.6% Never married46.6% Now married2.3% Separated2.6% Widowed13.9% DivorcedFemales 32.9% Never married42.9% Now married0.7% Separated11.4% Widowed12.1% DivorcedWomen who gave birth in the past 12 months Now married:
100.0% (92)Unmarried:
0.0% (0)
Women who did not give birth in the past 12 months Now married:
33.7% (566)Unmarried:
66.3% (1,115)
Marital status - Black or African American population 15 years and over
Males 59.7% Never married33.1% Now married0.7% Separated1.2% Widowed5.3% DivorcedFemales 43.6% Never married34.0% Now married3.5% Separated4.7% Widowed14.3% DivorcedWomen who gave birth in the past 12 months Now married:
49.2% (96)Unmarried:
50.8% (99)
Women who did not give birth in the past 12 months Now married:
30.7% (788)Unmarried:
69.3% (1,777)
Marital status - American Indian / Alaska Native population 15 years and over
Males 0.0% Never married100.0% Now married0.0% Separated0.0% Widowed0.0% DivorcedFemales 30.0% Never married0.0% Now married0.0% Separated0.0% Widowed70.0% DivorcedWomen who did not give birth in the past 12 months Now married:
0.0% (0)Unmarried:
100.0% (12)
Marital status - Asian population 15 years and over
Males 65.1% Never married34.9% Now married0.0% Separated0.0% Widowed0.0% DivorcedFemales 30.2% Never married59.4% Now married4.2% Separated0.0% Widowed6.2% DivorcedWomen who gave birth in the past 12 months Now married:
100.0% (23)Unmarried:
0.0% (0)
Women who did not give birth in the past 12 months Now married:
19.0% (8)Unmarried:
81.0% (35)
Marital status - Other race population 15 years and over
Males 0.0% Never married27.7% Now married0.0% Separated0.0% Widowed72.3% DivorcedFemales 39.2% Never married27.0% Now married0.0% Separated23.0% Widowed10.8% DivorcedWomen who did not give birth in the past 12 months Now married:
14.8% (11)Unmarried:
85.2% (65)
Marital status - Two or more races population 15 years and over
Males 58.1% Never married39.4% Now married0.0% Separated0.0% Widowed2.5% DivorcedFemales 41.9% Never married44.6% Now married6.2% Separated0.0% Widowed7.3% DivorcedWomen who did not give birth in the past 12 months Now married:
39.6% (94)Unmarried:
60.4% (143)
Marital status - White alone, not Hispanic / Latino population 15 years and over
Males 34.6% Never married46.4% Now married2.3% Separated2.7% Widowed14.0% DivorcedFemales 32.7% Never married43.1% Now married0.8% Separated11.4% Widowed12.0% DivorcedWomen who gave birth in the past 12 months Now married:
100.0% (94)Unmarried:
0.0% (0)
Women who did not give birth in the past 12 months Now married:
34.0% (581)Unmarried:
66.0% (1,129)
Marital status - Hispanic or Latino population 15 years and over
Males 62.5% Never married12.1% Now married0.0% Separated0.0% Widowed25.4% DivorcedFemales 73.5% Never married19.6% Now married0.0% Separated0.0% Widowed6.9% DivorcedWomen who did not give birth in the past 12 months Now married:
9.6% (8)Unmarried:
90.4% (78)
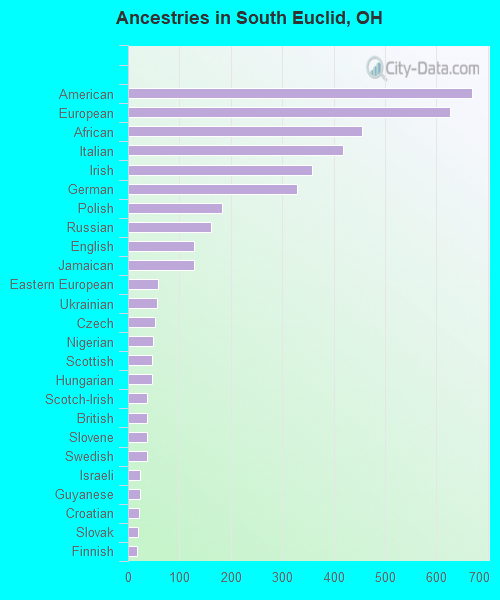
Ancestries in South Euclid
669 5.3% American626 4.9% European455 3.6% African419 3.3% Italian358 2.8% Irish328 2.6% German183 1.4% Polish161 1.3% Russian128 1.0% English128 1.0% Jamaican58 0.5% Eastern European57 0.4% Ukrainian52 0.4% Czech48 0.4% Nigerian46 0.4% Scottish46 0.4% Hungarian37 0.3% Scotch-Irish37 0.3% British37 0.3% Slovene37 0.3% Swedish23 0.2% Israeli23 0.2% Guyanese21 0.2% Croatian19 0.1% Slovak18 0.1% Finnish17 0.1% Scandinavian13 0.1% West Indian12 0.09% Lithuanian11 0.09% Brazilian10 0.08% Dutch10 0.08% Austrian9 0.07% Albanian7 0.06% Norwegian6 0.05% German Russian5 0.04% Lebanese5 0.04% Romanian4 0.03% Palestinian1 0.01% Sierra Leonean
Children Nativity (place of birth) in South Euclid
Children under 6 years - Living with two parents Both parents native 874 100.0% NativeBoth parents foreign-born 44 100.0% NativeOne native, one foreign-born parent 52 100.0% NativeChildren under 6 years - Living with one parent Native parent 465 100.0% NativeChildren 6 to 17 years - Living with two parents Both parents native 1,289 100.0% NativeBoth parents foreign-born 71 100.0% NativeOne native, one foreign-born parent 38 100.0% NativeChildren 6 to 17 years - Living with one parent Native parent 1,355 100.0% NativeForeign-born parent 121 53.9% Native103 46.1% Foreign-born
Grandparents responsible for own grandchildren in South Euclid
Grandparents (30 to 59 years) White / Caucasian 5 100.0% Responsible for grandchildrenBlack or African American 35 35.4% Responsible for grandchildren64 64.6% Not responsible for grandchildrenAmerican Indian / Alaska Native 4 100.0% Responsible for grandchildrenWhite alone, not Hispanic / Latino 5 100.0% Responsible for grandchildrenGrandparents (60 years and over) White / Caucasian 30 21.1% Responsible for grandchildren111 78.9% Not responsible for grandchildrenBlack or African American 57 100.0% Not responsible for grandchildrenWhite alone, not Hispanic / Latino 30 20.8% Responsible for grandchildren116 79.2% Not responsible for grandchildren