Races in South Hill, Washington (WA) Detailed Stats
Data:
Races - White alone (%)
Races - White alone (% change since 2000)
Races - Black alone (%)
Races - Black alone (% change since 2000)
Races - American Indian alone (%)
Races - American Indian alone (% change since 2000)
Races - Asian alone (%)
Races - Asian alone (% change since 2000)
Races - Hispanic (%)
Races - Hispanic (% change since 2000)
Races - Native Hawaiian and Other Pacific Islander alone (%)
Races - Native Hawaiian and Other Pacific Islander alone (% change since 2000)
Races - Two or more races(%)
Races - Two or more races(% change since 2000)
Races - Other race alone (%)
Races - Other race alone (% change since 2000)
Racial diversity
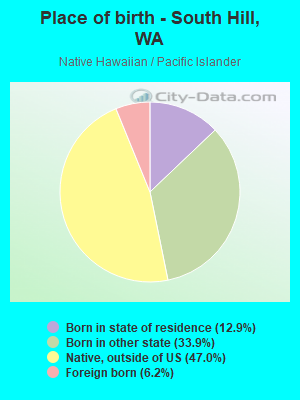
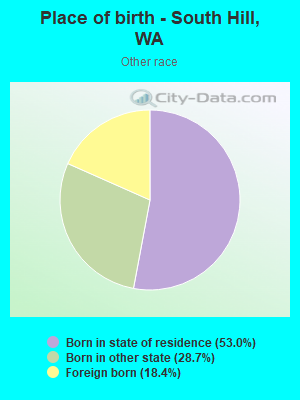
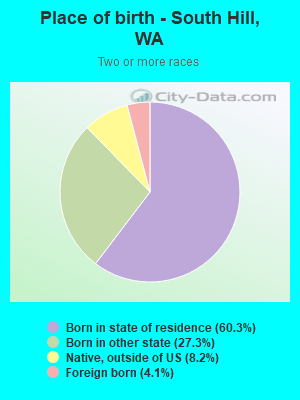
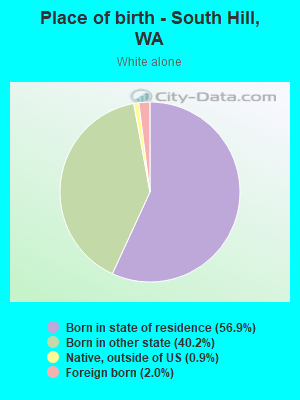
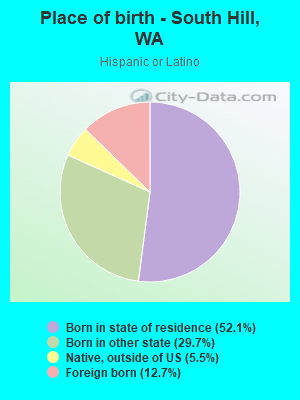
Place of birth - Born in state of residence (%)
Place of birth - Born in state of residence (%) - White
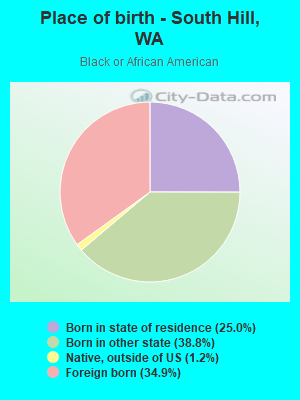
Place of birth - Born in state of residence (%) - Black or African American
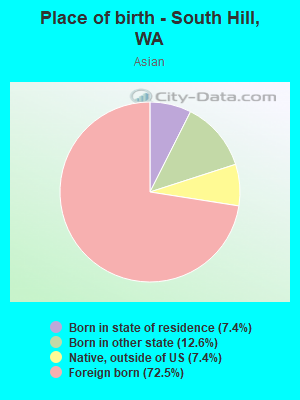
Place of birth - Born in state of residence (%) - Asian
Place of birth - Born in state of residence (%) - Hispanic or Latino
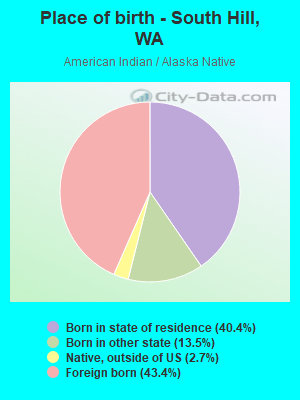
Place of birth - Born in state of residence (%) - American Indian and Alaska Native
Place of birth - Born in state of residence (%) - Multirace
Place of birth - Born in state of residence (%) - Other Race
Place of birth - Born in other state (%)
Place of birth - Born in other state (%) - White
Place of birth - Born in other state (%) - Black or African American
Place of birth - Born in other state (%) - Asian
Place of birth - Born in other state (%) - Hispanic or Latino
Place of birth - Born in other state (%) - American Indian and Alaska Native
Place of birth - Born in other state (%) - Multirace
Place of birth - Born in other state (%) - Other Race
Place of birth - Native, outside of US (%)
Place of birth - Native, outside of US (%) - White
Place of birth - Native, outside of US (%) - Black or African American
Place of birth - Native, outside of US (%) - Asian
Place of birth - Native, outside of US (%) - Hispanic or Latino
Place of birth - Native, outside of US (%) - American Indian and Alaska Native
Place of birth - Native, outside of US (%) - Multirace
Place of birth - Native, outside of US (%) - Other Race
Place of birth - Foreign born (%)
Place of birth - Foreign born (%) - White
Place of birth - Foreign born (%) - Black or African American
Place of birth - Foreign born (%) - Asian
Place of birth - Foreign born (%) - Hispanic or Latino
Place of birth - Foreign born (%) - American Indian and Alaska Native
Place of birth - Foreign born (%) - Multirace
Place of birth - Foreign born (%) - Other Race
Residents speaking English at home (%)
Residents speaking English at home - Born in the United States (%)
Residents speaking English at home - Native, born elsewhere (%)
Residents speaking English at home - Foreign born (%)
Residents speaking Spanish at home (%)
Residents speaking Spanish at home - Born in the United States (%)
Residents speaking Spanish at home - Native, born elsewhere (%)
Residents speaking Spanish at home - Foreign born (%)
Residents speaking other language at home (%)
Residents speaking other language at home - Born in the United States (%)
Residents speaking other language at home - Native, born elsewhere (%)
Residents speaking other language at home - Foreign born (%)
Marital status - Never married (%)
Marital status - Now married (%)
Marital status - Separated (%)
Marital status - Widowed (%)
Marital status - Divorced (%)
Ancestries Reported - Arab (%)
Ancestries Reported - Czech (%)
Ancestries Reported - Danish (%)
Ancestries Reported - Dutch (%)
Ancestries Reported - English (%)
Ancestries Reported - French (%)
Ancestries Reported - French Canadian (%)
Ancestries Reported - German (%)
Ancestries Reported - Greek (%)
Ancestries Reported - Hungarian (%)
Ancestries Reported - Irish (%)
Ancestries Reported - Italian (%)
Ancestries Reported - Lithuanian (%)
Ancestries Reported - Norwegian (%)
Ancestries Reported - Polish (%)
Ancestries Reported - Portuguese (%)
Ancestries Reported - Russian (%)
Ancestries Reported - Scotch-Irish (%)
Ancestries Reported - Scottish (%)
Ancestries Reported - Slovak (%)
Ancestries Reported - Subsaharan African (%)
Ancestries Reported - Swedish (%)
Ancestries Reported - Swiss (%)
Ancestries Reported - Ukrainian (%)
Ancestries Reported - United States (%)
Ancestries Reported - Welsh (%)
Ancestries Reported - West Indian (%)
Ancestries Reported - Other (%)
Geographical mobility - Same house 1 year ago (%)
Geographical mobility - Same house 1 year ago (%) - White
Geographical mobility - Same house 1 year ago (%) - Black or African American
Geographical mobility - Same house 1 year ago (%) - Asian
Geographical mobility - Same house 1 year ago (%) - Hispanic or Latino
Geographical mobility - Same house 1 year ago (%) - American Indian and Alaska Native
Geographical mobility - Same house 1 year ago (%) - Multirace
Geographical mobility - Same house 1 year ago (%) - Other Race
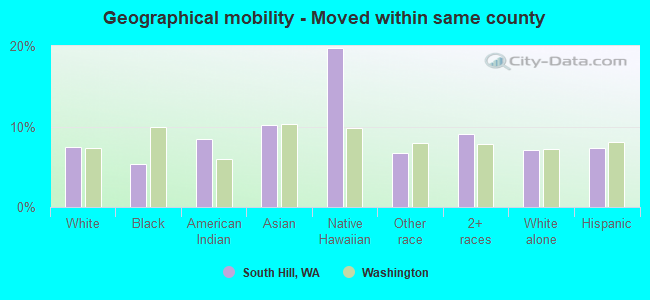
Geographical mobility - Moved within same county (%)
Geographical mobility - Moved within same county (%) - White
Geographical mobility - Moved within same county (%) - Black or African American
Geographical mobility - Moved within same county (%) - Asian
Geographical mobility - Moved within same county (%) - Hispanic or Latino
Geographical mobility - Moved within same county (%) - American Indian and Alaska Native
Geographical mobility - Moved within same county (%) - Multirace
Geographical mobility - Moved within same county (%) - Other Race
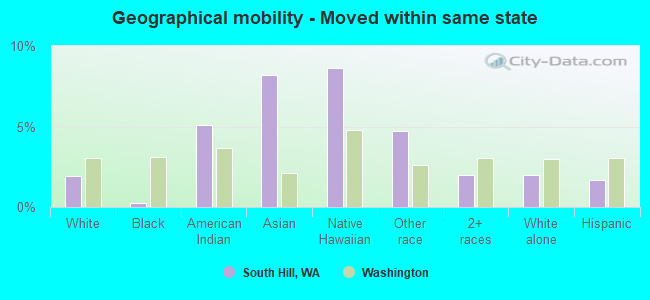
Geographical mobility - Moved from different county within same state (%)
Geographical mobility - Moved from different county within same state (%) - White
Geographical mobility - Moved from different county within same state (%) - Black or African American
Geographical mobility - Moved from different county within same state (%) - Asian
Geographical mobility - Moved from different county within same state (%) - Hispanic or Latino
Geographical mobility - Moved from different county within same state (%) - American Indian and Alaska Native
Geographical mobility - Moved from different county within same state (%) - Multirace
Geographical mobility - Moved from different county within same state (%) - Other Race
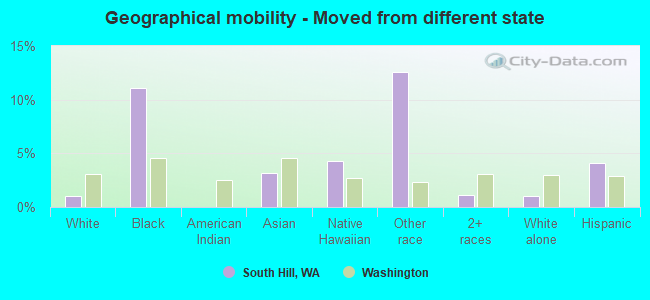
Geographical mobility - Moved from different state (%)
Geographical mobility - Moved from different state (%) - White
Geographical mobility - Moved from different state (%) - Black or African American
Geographical mobility - Moved from different state (%) - Asian
Geographical mobility - Moved from different state (%) - Hispanic or Latino
Geographical mobility - Moved from different state (%) - American Indian and Alaska Native
Geographical mobility - Moved from different state (%) - Multirace
Geographical mobility - Moved from different state (%) - Other Race
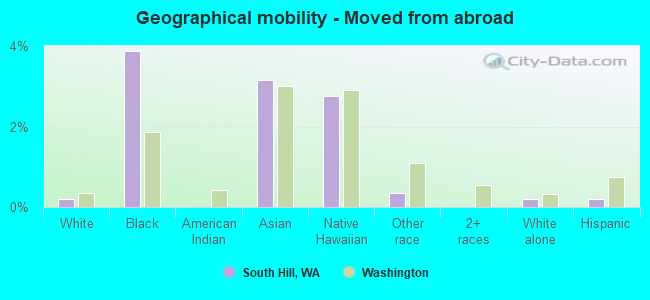
Geographical mobility - Moved from abroad (%)
Geographical mobility - Moved from abroad (%) - White
Geographical mobility - Moved from abroad (%) - Black or African American
Geographical mobility - Moved from abroad (%) - Asian
Geographical mobility - Moved from abroad (%) - Hispanic or Latino
Geographical mobility - Moved from abroad (%) - American Indian and Alaska Native
Geographical mobility - Moved from abroad (%) - Multirace
Geographical mobility - Moved from abroad (%) - Other Race
Place of birth for the foreign-born population - Ireland (%)
Place of birth for the foreign-born population - Denmark (%)
Place of birth for the foreign-born population - Norway (%)
Place of birth for the foreign-born population - Sweden (%)
Place of birth for the foreign-born population - United Kingdom (%)
Place of birth for the foreign-born population - England (%)
Place of birth for the foreign-born population - Scotland (%)
Place of birth for the foreign-born population - Other Northern Europe (%)
Place of birth for the foreign-born population - Austria (%)
Place of birth for the foreign-born population - Belgium (%)
Place of birth for the foreign-born population - France (%)
Place of birth for the foreign-born population - Germany (%)
Place of birth for the foreign-born population - Netherlands (%)
Place of birth for the foreign-born population - Switzerland (%)
Place of birth for the foreign-born population - Other Western Europe (%)
Place of birth for the foreign-born population - Greece (%)
Place of birth for the foreign-born population - Italy (%)
Place of birth for the foreign-born population - Portugal (%)
Place of birth for the foreign-born population - Spain (%)
Place of birth for the foreign-born population - Other Southern Europe (%)
Place of birth for the foreign-born population - Albania (%)
Place of birth for the foreign-born population - Belarus (%)
Place of birth for the foreign-born population - Bosnia and Herzegovina (%)
Place of birth for the foreign-born population - Bulgaria (%)
Place of birth for the foreign-born population - Croatia (%)
Place of birth for the foreign-born population - Czechoslovakia (%)
Place of birth for the foreign-born population - Hungary (%)
Place of birth for the foreign-born population - Latvia (%)
Place of birth for the foreign-born population - Lithuania (%)
Place of birth for the foreign-born population - North Macedonia (Macedonia) (%)
Place of birth for the foreign-born population - Moldova (%)
Place of birth for the foreign-born population - Poland (%)
Place of birth for the foreign-born population - Romania (%)
Place of birth for the foreign-born population - Russia (%)
Place of birth for the foreign-born population - Serbia (%)
Place of birth for the foreign-born population - Ukraine (%)
Place of birth for the foreign-born population - Other Eastern Europe (%)
Place of birth for the foreign-born population - China (%)
Place of birth for the foreign-born population - Hong Kong (%)
Place of birth for the foreign-born population - Taiwan (%)
Place of birth for the foreign-born population - Japan (%)
Place of birth for the foreign-born population - Korea (%)
Place of birth for the foreign-born population - Other Eastern Asia (%)
Place of birth for the foreign-born population - Afghanistan (%)
Place of birth for the foreign-born population - Bangladesh (%)
Place of birth for the foreign-born population - India (%)
Place of birth for the foreign-born population - Iran (%)
Place of birth for the foreign-born population - Kazakhstan (%)
Place of birth for the foreign-born population - Nepal (%)
Place of birth for the foreign-born population - Pakistan (%)
Place of birth for the foreign-born population - Sri Lanka (%)
Place of birth for the foreign-born population - Uzbekistan (%)
Place of birth for the foreign-born population - Other South Central Asia (%)
Place of birth for the foreign-born population - Burma (%)
Place of birth for the foreign-born population - Cambodia (%)
Place of birth for the foreign-born population - Indonesia (%)
Place of birth for the foreign-born population - Laos (%)
Place of birth for the foreign-born population - Malaysia (%)
Place of birth for the foreign-born population - Philippines (%)
Place of birth for the foreign-born population - Singapore (%)
Place of birth for the foreign-born population - Thailand (%)
Place of birth for the foreign-born population - Vietnam (%)
Place of birth for the foreign-born population - Other South Eastern Asia (%)
Place of birth for the foreign-born population - Armenia (%)
Place of birth for the foreign-born population - Iraq (%)
Place of birth for the foreign-born population - Israel (%)
Place of birth for the foreign-born population - Jordan (%)
Place of birth for the foreign-born population - Kuwait (%)
Place of birth for the foreign-born population - Lebanon (%)
Place of birth for the foreign-born population - Saudi Arabia (%)
Place of birth for the foreign-born population - Syria (%)
Place of birth for the foreign-born population - Turkey (%)
Place of birth for the foreign-born population - Yemen (%)
Place of birth for the foreign-born population - Other Western Asia (%)
Place of birth for the foreign-born population - Eritrea (%)
Place of birth for the foreign-born population - Ethiopia (%)
Place of birth for the foreign-born population - Kenya (%)
Place of birth for the foreign-born population - Somalia (%)
Place of birth for the foreign-born population - Uganda (%)
Place of birth for the foreign-born population - Zimbabwe (%)
Place of birth for the foreign-born population - Other Eastern Africa (%)
Place of birth for the foreign-born population - Cameroon (%)
Place of birth for the foreign-born population - Congo (%)
Place of birth for the foreign-born population - Democratic Republic of Congo (Zaire) (%)
Place of birth for the foreign-born population - Other Middle Africa (%)
Place of birth for the foreign-born population - Egypt (%)
Place of birth for the foreign-born population - Morocco (%)
Place of birth for the foreign-born population - Sudan (%)
Place of birth for the foreign-born population - Other Northern Africa (%)
Place of birth for the foreign-born population - South Africa (%)
Place of birth for the foreign-born population - Other Southern Africa (%)
Place of birth for the foreign-born population - Cabo Verde (%)
Place of birth for the foreign-born population - Ghana (%)
Place of birth for the foreign-born population - Liberia (%)
Place of birth for the foreign-born population - Nigeria (%)
Place of birth for the foreign-born population - Senegal (%)
Place of birth for the foreign-born population - Sierra Leone (%)
Place of birth for the foreign-born population - Other Western Africa (%)
Place of birth for the foreign-born population - Australia (%)
Place of birth for the foreign-born population - New Zealand (%)
Place of birth for the foreign-born population - Fiji (%)
Place of birth for the foreign-born population - Micronesia (%)
Place of birth for the foreign-born population - Bahamas (%)
Place of birth for the foreign-born population - Barbados (%)
Place of birth for the foreign-born population - Cuba (%)
Place of birth for the foreign-born population - Dominica (%)
Place of birth for the foreign-born population - Dominican Republic (%)
Place of birth for the foreign-born population - Grenada (%)
Place of birth for the foreign-born population - Haiti (%)
Place of birth for the foreign-born population - Jamaica (%)
Place of birth for the foreign-born population - St. Vincent and the Grenadines (%)
Place of birth for the foreign-born population - Trinidad and Tobago (%)
Place of birth for the foreign-born population - West Indies (%)
Place of birth for the foreign-born population - Other Caribbean (%)
Place of birth for the foreign-born population - Belize (%)
Place of birth for the foreign-born population - Costa Rica (%)
Place of birth for the foreign-born population - El Salvador (%)
Place of birth for the foreign-born population - Guatemala (%)
Place of birth for the foreign-born population - Honduras (%)
Place of birth for the foreign-born population - Mexico (%)
Place of birth for the foreign-born population - Nicaragua (%)
Place of birth for the foreign-born population - Panama (%)
Place of birth for the foreign-born population - Other Central America (%)
Place of birth for the foreign-born population - Argentina (%)
Place of birth for the foreign-born population - Bolivia (%)
Place of birth for the foreign-born population - Brazil (%)
Place of birth for the foreign-born population - Chile (%)
Place of birth for the foreign-born population - Colombia (%)
Place of birth for the foreign-born population - Ecuador (%)
Place of birth for the foreign-born population - Guyana (%)
Place of birth for the foreign-born population - Peru (%)
Place of birth for the foreign-born population - Uruguay (%)
Place of birth for the foreign-born population - Venezuela (%)
Place of birth for the foreign-born population - Other South America (%)
Place of birth for the foreign-born population - Canada (%)
Place of birth for the foreign-born population - Other Northern America (%)
Place of birth for the foreign-born population - Other (%)
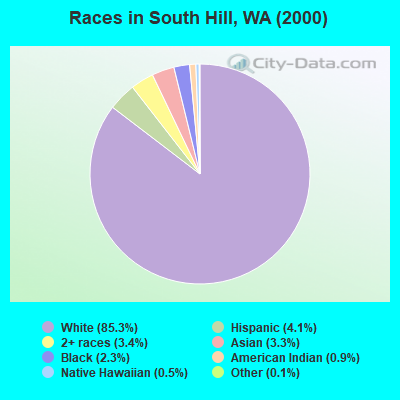
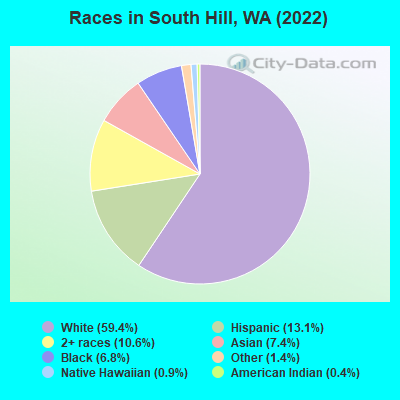
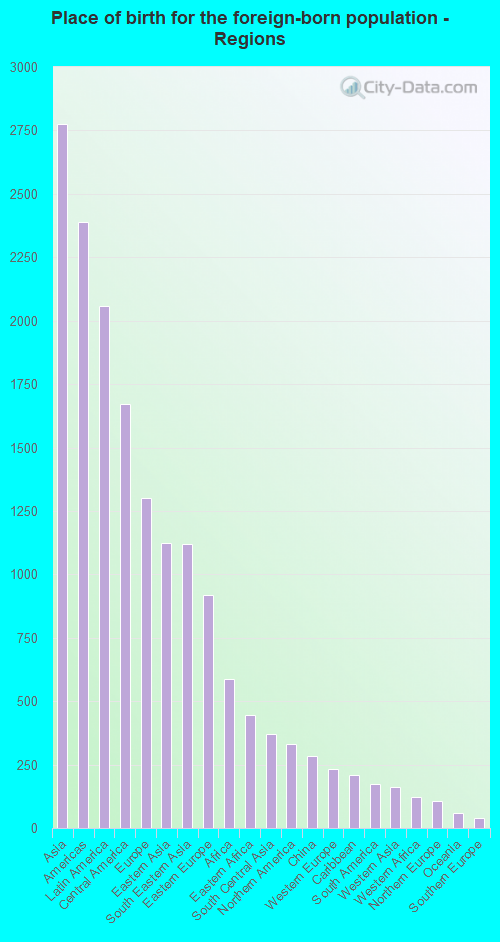
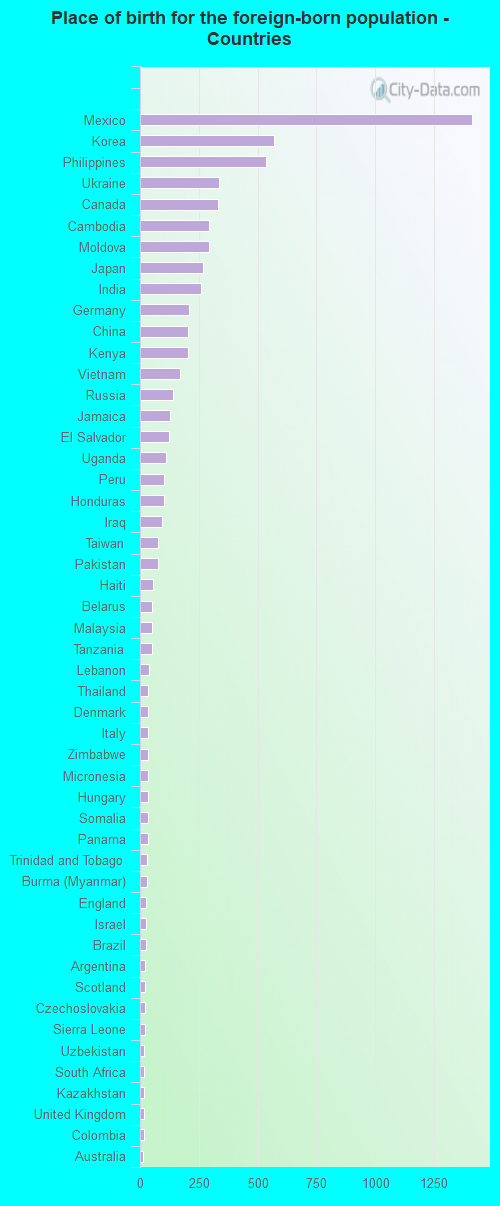
According to 2022 data, the most numerous races in South Hill, WA are White alone (38,418 residents), Hispanic (8,493 residents), and Asian alone (4,757 residents). 86.9% of South Hill residents speak English at home. 10.4% of South Hill, WA residents are foreign-born (3.9% born in Asia, 2.9% born in Latin America, 1.8% born in Europe), which is 44.4% less than the foreign-born rate of 15.0% across the entire state of Washington.
Race distribution in South Hill
2000 2022
4,652,490 78.9% White alone 441,509 7.5% Hispanic 319,401 5.4% Asian alone 184,631 3.1% Black alone 175,926 3.0% Two or more races 85,396 1.4% American Indian alone 22,779 0.4% Native Hawaiian and Other 11,989 0.2% Other race alone
4,941,456 63.5% White alone 1,093,313 14.0% Hispanic 755,832 9.7% Asian alone 523,448 6.7% Two or more races 299,537 3.8% Black alone 69,024 0.9% American Indian alone 52,231 0.7% Native Hawaiian and Other 50,945 0.7% Other race alone
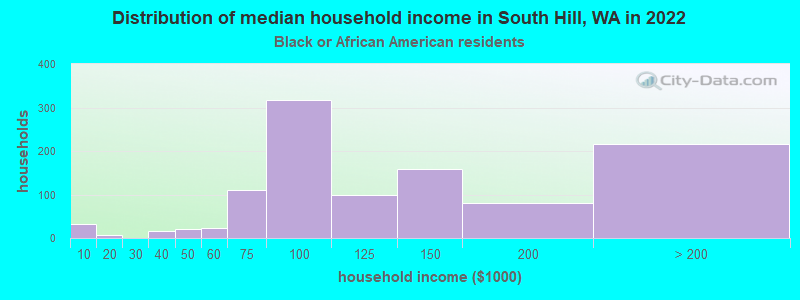
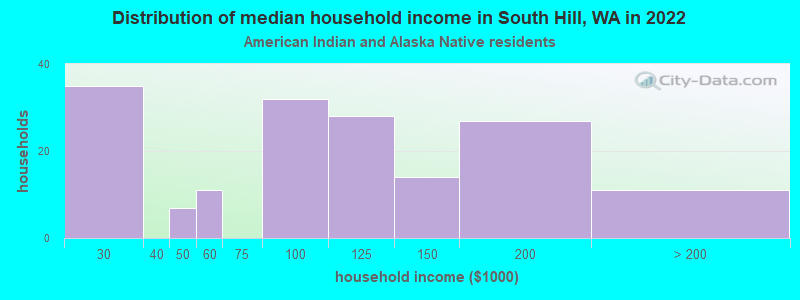
Income and house value in South Hill Median household income in 2022 $112,825 White non-Hispanic householders$113,241 Black householders$91,625 Asian householders$105,224 Native Hawaiian and other Pacific Islander householders$130,757 Some other race householders$98,430 Two or more races householders$108,898 Hispanic or Latino race householdersMedian 2022 house value $582,752 White Non-Hispanic householders$623,001 Black or African American householders$545,255 American Indian or Alaska Native householders $606,833 Asian householders$365,682 Native Hawaiian and other Pacific Islander householders$506,038 Some other race householders$538,031 Two or more races householders$482,989 Hispanic or Latino householders
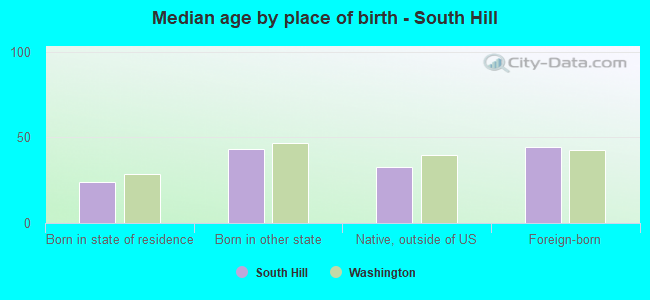
Median age by race in South Hill
38.1 Median age for White residents38.2 38.0 36.4 Median age for Black or African American residents36.3 37.0 19.4 Median age for American Indian / Alaska Native residents19.5 18.0 43.7 Median age for Asian residents43.2 45.5 36.0 Median age for Native Hawaiian / Pacific Islander residents36.0 34.4 23.7 Median age for Other race residents23.7 27.0 16.6 Median age for Two or more races residents17.0 16.0 38.5 Median age for White alone residents38.5 38.5 19.9 Median age for Hispanic or Latino residents19.5 20.6
Owner/renter occupied households by race in South Hill
House owners and renters - White residents 11,532 71.9% Owner occupied4,510 28.1% Renter occupiedHouse owners and renters - Black or African American residents 863 56.6% Owner occupied662 43.4% Renter occupiedHouse owners and renters - American Indian / Alaska Native residents 92 75.0% Owner occupied31 25.0% Renter occupiedHouse owners and renters - Asian residents 831 57.0% Owner occupied626 43.0% Renter occupiedHouse owners and renters - Native Hawaiian / Pacific Islander residents 168 49.1% Owner occupied174 50.9% Renter occupiedHouse owners and renters - Other race residents 337 56.2% Owner occupied263 43.8% Renter occupiedHouse owners and renters - Two or more races residents 1,878 78.6% Owner occupied511 21.4% Renter occupiedHouse owners and renters - White alone residents 11,164 71.9% Owner occupied4,366 28.1% Renter occupiedHouse owners and renters - Hispanic or Latino residents 1,215 70.0% Owner occupied520 30.0% Renter occupied
Language usage in South Hill
English speakers - Total 86.9% of residents of South Hill speak English at home.
4.8% of residents speak Spanish at home 2,386 82.2% Speak English very well517 17.8% Speak English less than very well8.3% of residents speak other language at home 3,734 73.9% Speak English very well1,322 26.1% Speak English less than very well
English speakers - Born in the United States 97.4% of residents of South Hill speak English at home.
2.1% of residents speak Spanish at home 467 100.0% Speak English very well0.5% of residents speak other language at home 76 63.9% Speak English very well43 36.1% Speak English less than very well
English speakers - Native, born elsewhere 49.7% of residents of South Hill speak English at home.
22.3% of residents speak Spanish at home 420 100.0% Speak English very well28.0% of residents speak other language at home 526 100.0% Speak English very well
English speakers - Foreign-born 24.7% of residents of South Hill speak English at home.
17.7% of residents speak Spanish at home 696 57.4% Speak English very well517 42.6% Speak English less than very well57.6% of residents speak other language at home 2,712 68.8% Speak English very well1,231 31.2% Speak English less than very well
White (Caucasian) - Speak only English Native:
99.2% (36,997)Foreign-born:
36.4% (277)
White (Caucasian) - Speak another language Native:
0.8% (298)Foreign-born:
63.6% (485)
Black or African American - Speak only English Native:
95.9% (2,644)Foreign-born:
46.5% (706)
Black or African American - Speak another language Native:
4.1% (114)Foreign-born:
53.5% (811)
American Indian / Alaska Native - Speak another language Native:
16.4% (46)Foreign-born:
100.0% (223)
Asian - Speak only English Native:
75.4% (936)Foreign-born:
19.1% (658)
Asian - Speak another language Native:
24.6% (305)Foreign-born:
80.9% (2,792)
Native Hawaiian / Pacific Islander - Speak only English Native:
66.5% (446)Foreign-born:
48.1% (21)
Native Hawaiian / Pacific Islander - Speak another language Native:
33.2% (223)Foreign-born:
61.2% (27)
Other race - Speak only English Native:
59.6% (904)Foreign-born:
6.1% (44)
Other race - Speak another language Native:
40.8% (619)Foreign-born:
93.5% (684)
Two or more races - Speak only English Native:
87.8% (9,234)Foreign-born:
7.6% (86)
Two or more races - Speak another language Native:
11.6% (1,218)Foreign-born:
95.5% (1,078)
White alone - Speak only English Native:
99.3% (35,775)Foreign-born:
36.4% (277)
White alone - Speak another language Native:
0.7% (253)Foreign-born:
63.6% (485)
Hispanic or Latino - Speak only English Native:
80.1% (5,341)Foreign-born:
4.8% (52)
Hispanic or Latino - Speak another language Native:
19.9% (1,329)Foreign-born:
95.2% (1,028)
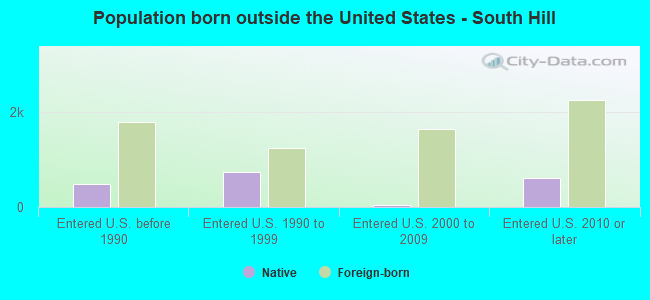
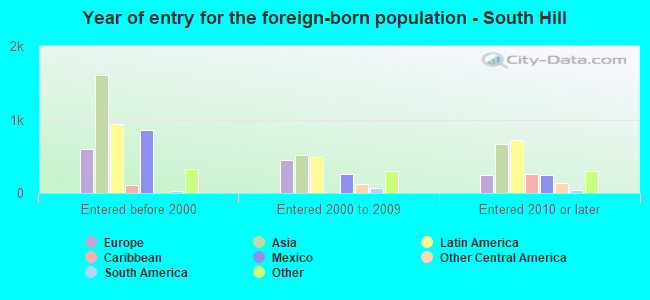
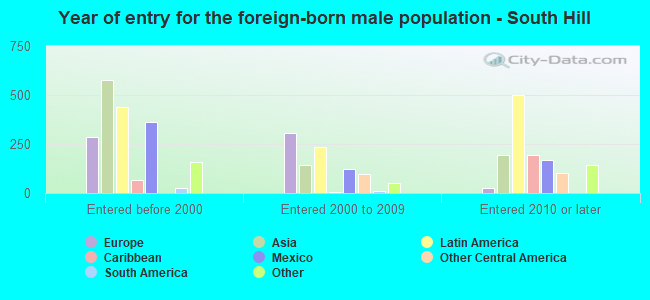
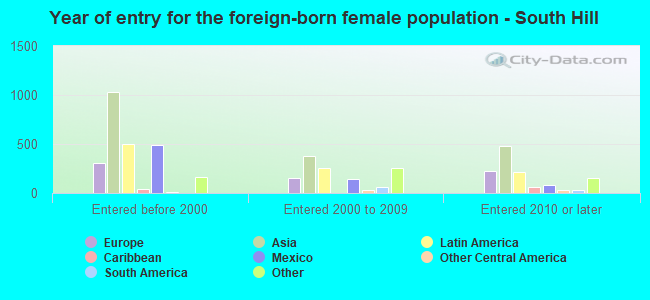
Foreign-born residents in South Hill 7,112 residents are foreign born (3.9% Asia , 2.9% Latin America , 1.8% Europe ).
This city:
10.4%Washington:
14.9%
Marital status for residents in South Hill Marital status - White (Caucasian) population 15 years and over
Males 28.8% Never married58.4% Now married2.3% Separated1.5% Widowed9.0% DivorcedFemales 25.5% Never married55.9% Now married0.9% Separated7.7% Widowed10.0% DivorcedWomen who gave birth in the past 12 months Now married:
100.0% (512)Unmarried:
0.0% (0)
Women who did not give birth in the past 12 months Now married:
53.8% (4,720)Unmarried:
46.2% (4,050)
Marital status - Black or African American population 15 years and over
Males 34.4% Never married43.0% Now married7.4% Separated2.3% Widowed12.9% DivorcedFemales 45.9% Never married30.7% Now married2.7% Separated5.1% Widowed15.6% DivorcedWomen who gave birth in the past 12 months Now married:
100.0% (22)Unmarried:
0.0% (0)
Women who did not give birth in the past 12 months Now married:
30.9% (290)Unmarried:
69.1% (649)
Marital status - American Indian / Alaska Native population 15 years and over
Males 35.1% Never married64.9% Now married0.0% Separated0.0% Widowed0.0% DivorcedFemales 56.0% Never married37.5% Now married0.0% Separated1.2% Widowed5.4% DivorcedWomen who gave birth in the past 12 months Now married:
0.0% (0)Unmarried:
100.0% (32)
Women who did not give birth in the past 12 months Now married:
23.0% (30)Unmarried:
77.0% (102)
Marital status - Asian population 15 years and over
Males 27.9% Never married51.6% Now married4.0% Separated0.0% Widowed16.4% DivorcedFemales 18.0% Never married47.9% Now married8.4% Separated10.5% Widowed15.2% DivorcedWomen who gave birth in the past 12 months Now married:
60.5% (51)Unmarried:
39.5% (33)
Women who did not give birth in the past 12 months Now married:
61.6% (906)Unmarried:
38.4% (566)
Marital status - Native Hawaiian / Pacific Islander population 15 years and over
Males 58.0% Never married40.3% Now married0.0% Separated0.0% Widowed1.7% DivorcedFemales 38.1% Never married42.4% Now married6.0% Separated0.0% Widowed13.6% DivorcedWomen who gave birth in the past 12 months Now married:
0.0% (0)Unmarried:
100.0% (24)
Women who did not give birth in the past 12 months Now married:
32.5% (73)Unmarried:
67.5% (152)
Marital status - Other race population 15 years and over
Males 57.0% Never married40.2% Now married1.0% Separated0.0% Widowed1.9% DivorcedFemales 35.0% Never married53.0% Now married1.2% Separated1.7% Widowed9.1% DivorcedWomen who gave birth in the past 12 months Now married:
100.0% (72)Unmarried:
0.0% (0)
Women who did not give birth in the past 12 months Now married:
45.8% (276)Unmarried:
54.2% (327)
Marital status - Two or more races population 15 years and over
Males 58.7% Never married32.7% Now married0.0% Separated0.0% Widowed8.7% DivorcedFemales 44.8% Never married42.7% Now married0.0% Separated2.5% Widowed10.0% DivorcedWomen who gave birth in the past 12 months Now married:
100.0% (99)Unmarried:
0.0% (0)
Women who did not give birth in the past 12 months Now married:
37.7% (851)Unmarried:
62.3% (1,407)
Marital status - White alone, not Hispanic / Latino population 15 years and over
Males 28.2% Never married58.8% Now married2.3% Separated1.6% Widowed9.0% DivorcedFemales 25.1% Never married56.0% Now married1.0% Separated7.9% Widowed10.1% DivorcedWomen who gave birth in the past 12 months Now married:
100.0% (512)Unmarried:
0.0% (0)
Women who did not give birth in the past 12 months Now married:
53.9% (4,479)Unmarried:
46.1% (3,826)
Marital status - Hispanic or Latino population 15 years and over
Males 55.5% Never married38.1% Now married2.3% Separated0.0% Widowed4.2% DivorcedFemales 33.2% Never married55.4% Now married3.1% Separated1.4% Widowed6.9% DivorcedWomen who gave birth in the past 12 months Now married:
100.0% (102)Unmarried:
0.0% (0)
Women who did not give birth in the past 12 months Now married:
57.0% (1,245)Unmarried:
43.0% (938)
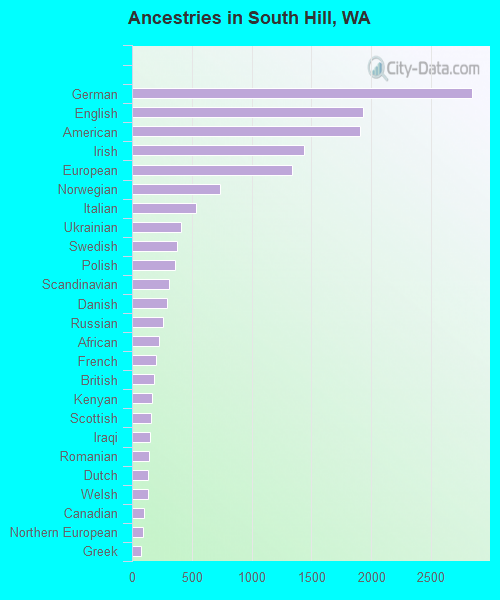
Ancestries in South Hill
2,845 10.6% German1,937 7.2% English1,905 7.1% American1,443 5.4% Irish1,341 5.0% European733 2.7% Norwegian532 2.0% Italian409 1.5% Ukrainian373 1.4% Swedish358 1.3% Polish313 1.2% Scandinavian295 1.1% Danish263 1.0% Russian227 0.8% African203 0.8% French186 0.7% British169 0.6% Kenyan159 0.6% Scottish147 0.5% Iraqi141 0.5% Romanian138 0.5% Dutch130 0.5% Welsh102 0.4% Canadian94 0.4% Northern European79 0.3% Greek71 0.3% Somali63 0.2% Scotch-Irish50 0.2% Eastern European47 0.2% Lebanese46 0.2% Belgian45 0.2% Finnish40 0.1% Brazilian38 0.1% French Canadian34 0.1% Swiss31 0.1% Iranian29 0.1% Czechoslovakian29 0.1% South African24 0.09% Portuguese21 0.08% Czech20 0.07% Trinidadian and Tobagonian14 0.05% Austrian13 0.05% Hungarian12 0.04% Haitian12 0.04% Slovak10 0.04% Latvian9 0.03% Sierra Leonean9 0.03% Slavic8 0.03% Slovene7 0.03% Croatian4 0.01% Lithuanian3 0.01% Pennsylvania German
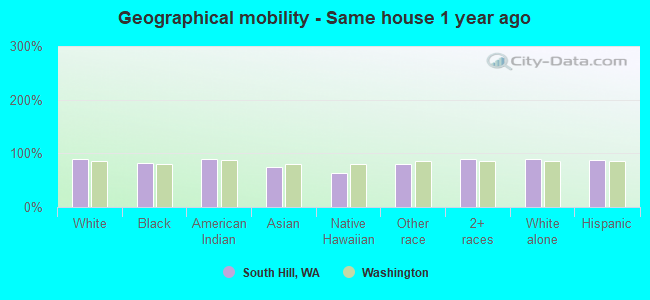
Geographical mobility in South Hill Same house 1 year ago 35,354 89.4% White (Caucasian)2,748 82.8% Black or African American382 88.9% American Indian / Alaska Native3,585 75.4% Asian417 62.8% Native Hawaiian / Pacific Islander1,930 80.6% Other race11,852 89.1% Two or more races34,151 89.7% White alone, not Hispanic / Latino7,590 87.2% Hispanic or LatinoMoved within same county 2,936 7.4% White / Caucasian179 5.4% Black or African American36 8.4% American Indian / Alaska Native483 10.2% Asian131 19.8% Native Hawaiian / Pacific Islander159 6.7% Other race1,206 9.1% Two or more races2,676 7.0% White alone, not Hispanic / Latino635 7.3% Hispanic or LatinoMoved within same state 754 1.9% White / Caucasian8 0.2% Black or African American22 5.1% American Indian / Alaska Native389 8.2% Asian57 8.6% Native Hawaiian / Pacific Islander113 4.7% Other race265 2.0% Two or more races754 2.0% White alone, not Hispanic / Latino146 1.7% Hispanic or LatinoMoved from different state 404 1.0% White / Caucasian367 11.1% Black or African American150 3.2% Asian28 4.3% Native Hawaiian / Pacific Islander301 12.6% Other race147 1.1% Two or more races404 1.1% White alone, not Hispanic / Latino357 4.1% Hispanic or LatinoMoved from abroad 76 0.2% White128 3.9% Black or African American150 3.2% Asian18 2.8% Native Hawaiian / Pacific Islander9 0.4% Other race76 0.2% White alone, not Hispanic / Latino18 0.2% Hispanic or Latino
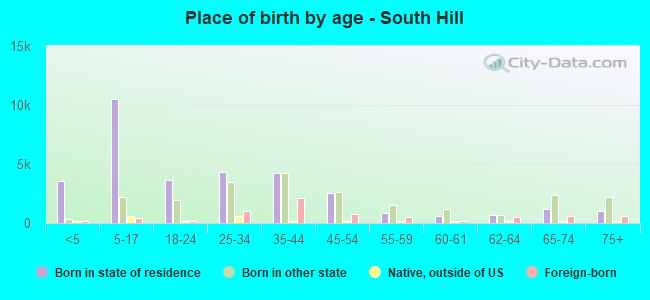
Children Nativity (place of birth) in South Hill
Children under 6 years - Living with two parents Both parents native 3,308 100.0% NativeBoth parents foreign-born 188 100.0% NativeOne native, one foreign-born parent 576 100.0% NativeChildren under 6 years - Living with one parent Native parent 674 100.0% NativeForeign-born parent 215 68.5% Native99 31.5% Foreign-bornChildren 6 to 17 years - Living with two parents Both parents native 6,281 100.0% NativeBoth parents foreign-born 219 42.5% Native296 57.5% Foreign-bornOne native, one foreign-born parent 1,256 91.9% Native110 8.1% Foreign-bornChildren 6 to 17 years - Living with one parent Native parent 2,519 100.0% NativeForeign-born parent 1,618 50.0% Native1,618 50.0% Foreign-born
Grandparents responsible for own grandchildren in South Hill
Grandparents (30 to 59 years) White / Caucasian 164 21.7% Responsible for grandchildren592 78.3% Not responsible for grandchildrenBlack or African American 90 53.9% Responsible for grandchildren77 46.1% Not responsible for grandchildrenOther race 10 100.0% Responsible for grandchildrenTwo or more races 12 100.0% Not responsible for grandchildrenWhite alone, not Hispanic / Latino 143 19.1% Responsible for grandchildren609 80.9% Not responsible for grandchildrenHispanic or Latino 20 54.7% Responsible for grandchildren17 45.3% Not responsible for grandchildrenGrandparents (60 years and over) White / Caucasian 57 16.3% Responsible for grandchildren293 83.7% Not responsible for grandchildrenBlack or African American 14 25.3% Responsible for grandchildren42 74.7% Not responsible for grandchildrenOther race 14 29.8% Responsible for grandchildren34 70.2% Not responsible for grandchildrenTwo or more races 10 6.0% Responsible for grandchildren157 94.0% Not responsible for grandchildrenWhite alone, not Hispanic / Latino 60 17.3% Responsible for grandchildren285 82.7% Not responsible for grandchildrenHispanic or Latino 14 11.5% Responsible for grandchildren105 88.5% Not responsible for grandchildren