Races in South Holland, Illinois (IL) Detailed Stats
Data:
Races - White alone (%)
Races - White alone (% change since 2000)
Races - Black alone (%)
Races - Black alone (% change since 2000)
Races - American Indian alone (%)
Races - American Indian alone (% change since 2000)
Races - Asian alone (%)
Races - Asian alone (% change since 2000)
Races - Hispanic (%)
Races - Hispanic (% change since 2000)
Races - Native Hawaiian and Other Pacific Islander alone (%)
Races - Native Hawaiian and Other Pacific Islander alone (% change since 2000)
Races - Two or more races(%)
Races - Two or more races(% change since 2000)
Races - Other race alone (%)
Races - Other race alone (% change since 2000)
Racial diversity
Place of birth - Born in state of residence (%)
Place of birth - Born in state of residence (%) - White
Place of birth - Born in state of residence (%) - Black or African American
Place of birth - Born in state of residence (%) - Asian
Place of birth - Born in state of residence (%) - Hispanic or Latino
Place of birth - Born in state of residence (%) - American Indian and Alaska Native
Place of birth - Born in state of residence (%) - Multirace
Place of birth - Born in state of residence (%) - Other Race
Place of birth - Born in other state (%)
Place of birth - Born in other state (%) - White
Place of birth - Born in other state (%) - Black or African American
Place of birth - Born in other state (%) - Asian
Place of birth - Born in other state (%) - Hispanic or Latino
Place of birth - Born in other state (%) - American Indian and Alaska Native
Place of birth - Born in other state (%) - Multirace
Place of birth - Born in other state (%) - Other Race
Place of birth - Native, outside of US (%)
Place of birth - Native, outside of US (%) - White
Place of birth - Native, outside of US (%) - Black or African American
Place of birth - Native, outside of US (%) - Asian
Place of birth - Native, outside of US (%) - Hispanic or Latino
Place of birth - Native, outside of US (%) - American Indian and Alaska Native
Place of birth - Native, outside of US (%) - Multirace
Place of birth - Native, outside of US (%) - Other Race
Place of birth - Foreign born (%)
Place of birth - Foreign born (%) - White
Place of birth - Foreign born (%) - Black or African American
Place of birth - Foreign born (%) - Asian
Place of birth - Foreign born (%) - Hispanic or Latino
Place of birth - Foreign born (%) - American Indian and Alaska Native
Place of birth - Foreign born (%) - Multirace
Place of birth - Foreign born (%) - Other Race
Residents speaking English at home (%)
Residents speaking English at home - Born in the United States (%)
Residents speaking English at home - Native, born elsewhere (%)
Residents speaking English at home - Foreign born (%)
Residents speaking Spanish at home (%)
Residents speaking Spanish at home - Born in the United States (%)
Residents speaking Spanish at home - Native, born elsewhere (%)
Residents speaking Spanish at home - Foreign born (%)
Residents speaking other language at home (%)
Residents speaking other language at home - Born in the United States (%)
Residents speaking other language at home - Native, born elsewhere (%)
Residents speaking other language at home - Foreign born (%)
Marital status - Never married (%)
Marital status - Now married (%)
Marital status - Separated (%)
Marital status - Widowed (%)
Marital status - Divorced (%)
Ancestries Reported - Arab (%)
Ancestries Reported - Czech (%)
Ancestries Reported - Danish (%)
Ancestries Reported - Dutch (%)
Ancestries Reported - English (%)
Ancestries Reported - French (%)
Ancestries Reported - French Canadian (%)
Ancestries Reported - German (%)
Ancestries Reported - Greek (%)
Ancestries Reported - Hungarian (%)
Ancestries Reported - Irish (%)
Ancestries Reported - Italian (%)
Ancestries Reported - Lithuanian (%)
Ancestries Reported - Norwegian (%)
Ancestries Reported - Polish (%)
Ancestries Reported - Portuguese (%)
Ancestries Reported - Russian (%)
Ancestries Reported - Scotch-Irish (%)
Ancestries Reported - Scottish (%)
Ancestries Reported - Slovak (%)
Ancestries Reported - Subsaharan African (%)
Ancestries Reported - Swedish (%)
Ancestries Reported - Swiss (%)
Ancestries Reported - Ukrainian (%)
Ancestries Reported - United States (%)
Ancestries Reported - Welsh (%)
Ancestries Reported - West Indian (%)
Ancestries Reported - Other (%)
Geographical mobility - Same house 1 year ago (%)
Geographical mobility - Same house 1 year ago (%) - White
Geographical mobility - Same house 1 year ago (%) - Black or African American
Geographical mobility - Same house 1 year ago (%) - Asian
Geographical mobility - Same house 1 year ago (%) - Hispanic or Latino
Geographical mobility - Same house 1 year ago (%) - American Indian and Alaska Native
Geographical mobility - Same house 1 year ago (%) - Multirace
Geographical mobility - Same house 1 year ago (%) - Other Race
Geographical mobility - Moved within same county (%)
Geographical mobility - Moved within same county (%) - White
Geographical mobility - Moved within same county (%) - Black or African American
Geographical mobility - Moved within same county (%) - Asian
Geographical mobility - Moved within same county (%) - Hispanic or Latino
Geographical mobility - Moved within same county (%) - American Indian and Alaska Native
Geographical mobility - Moved within same county (%) - Multirace
Geographical mobility - Moved within same county (%) - Other Race
Geographical mobility - Moved from different county within same state (%)
Geographical mobility - Moved from different county within same state (%) - White
Geographical mobility - Moved from different county within same state (%) - Black or African American
Geographical mobility - Moved from different county within same state (%) - Asian
Geographical mobility - Moved from different county within same state (%) - Hispanic or Latino
Geographical mobility - Moved from different county within same state (%) - American Indian and Alaska Native
Geographical mobility - Moved from different county within same state (%) - Multirace
Geographical mobility - Moved from different county within same state (%) - Other Race
Geographical mobility - Moved from different state (%)
Geographical mobility - Moved from different state (%) - White
Geographical mobility - Moved from different state (%) - Black or African American
Geographical mobility - Moved from different state (%) - Asian
Geographical mobility - Moved from different state (%) - Hispanic or Latino
Geographical mobility - Moved from different state (%) - American Indian and Alaska Native
Geographical mobility - Moved from different state (%) - Multirace
Geographical mobility - Moved from different state (%) - Other Race
Geographical mobility - Moved from abroad (%)
Geographical mobility - Moved from abroad (%) - White
Geographical mobility - Moved from abroad (%) - Black or African American
Geographical mobility - Moved from abroad (%) - Asian
Geographical mobility - Moved from abroad (%) - Hispanic or Latino
Geographical mobility - Moved from abroad (%) - American Indian and Alaska Native
Geographical mobility - Moved from abroad (%) - Multirace
Geographical mobility - Moved from abroad (%) - Other Race
Place of birth for the foreign-born population - Ireland (%)
Place of birth for the foreign-born population - Denmark (%)
Place of birth for the foreign-born population - Norway (%)
Place of birth for the foreign-born population - Sweden (%)
Place of birth for the foreign-born population - United Kingdom (%)
Place of birth for the foreign-born population - England (%)
Place of birth for the foreign-born population - Scotland (%)
Place of birth for the foreign-born population - Other Northern Europe (%)
Place of birth for the foreign-born population - Austria (%)
Place of birth for the foreign-born population - Belgium (%)
Place of birth for the foreign-born population - France (%)
Place of birth for the foreign-born population - Germany (%)
Place of birth for the foreign-born population - Netherlands (%)
Place of birth for the foreign-born population - Switzerland (%)
Place of birth for the foreign-born population - Other Western Europe (%)
Place of birth for the foreign-born population - Greece (%)
Place of birth for the foreign-born population - Italy (%)
Place of birth for the foreign-born population - Portugal (%)
Place of birth for the foreign-born population - Spain (%)
Place of birth for the foreign-born population - Other Southern Europe (%)
Place of birth for the foreign-born population - Albania (%)
Place of birth for the foreign-born population - Belarus (%)
Place of birth for the foreign-born population - Bosnia and Herzegovina (%)
Place of birth for the foreign-born population - Bulgaria (%)
Place of birth for the foreign-born population - Croatia (%)
Place of birth for the foreign-born population - Czechoslovakia (%)
Place of birth for the foreign-born population - Hungary (%)
Place of birth for the foreign-born population - Latvia (%)
Place of birth for the foreign-born population - Lithuania (%)
Place of birth for the foreign-born population - North Macedonia (Macedonia) (%)
Place of birth for the foreign-born population - Moldova (%)
Place of birth for the foreign-born population - Poland (%)
Place of birth for the foreign-born population - Romania (%)
Place of birth for the foreign-born population - Russia (%)
Place of birth for the foreign-born population - Serbia (%)
Place of birth for the foreign-born population - Ukraine (%)
Place of birth for the foreign-born population - Other Eastern Europe (%)
Place of birth for the foreign-born population - China (%)
Place of birth for the foreign-born population - Hong Kong (%)
Place of birth for the foreign-born population - Taiwan (%)
Place of birth for the foreign-born population - Japan (%)
Place of birth for the foreign-born population - Korea (%)
Place of birth for the foreign-born population - Other Eastern Asia (%)
Place of birth for the foreign-born population - Afghanistan (%)
Place of birth for the foreign-born population - Bangladesh (%)
Place of birth for the foreign-born population - India (%)
Place of birth for the foreign-born population - Iran (%)
Place of birth for the foreign-born population - Kazakhstan (%)
Place of birth for the foreign-born population - Nepal (%)
Place of birth for the foreign-born population - Pakistan (%)
Place of birth for the foreign-born population - Sri Lanka (%)
Place of birth for the foreign-born population - Uzbekistan (%)
Place of birth for the foreign-born population - Other South Central Asia (%)
Place of birth for the foreign-born population - Burma (%)
Place of birth for the foreign-born population - Cambodia (%)
Place of birth for the foreign-born population - Indonesia (%)
Place of birth for the foreign-born population - Laos (%)
Place of birth for the foreign-born population - Malaysia (%)
Place of birth for the foreign-born population - Philippines (%)
Place of birth for the foreign-born population - Singapore (%)
Place of birth for the foreign-born population - Thailand (%)
Place of birth for the foreign-born population - Vietnam (%)
Place of birth for the foreign-born population - Other South Eastern Asia (%)
Place of birth for the foreign-born population - Armenia (%)
Place of birth for the foreign-born population - Iraq (%)
Place of birth for the foreign-born population - Israel (%)
Place of birth for the foreign-born population - Jordan (%)
Place of birth for the foreign-born population - Kuwait (%)
Place of birth for the foreign-born population - Lebanon (%)
Place of birth for the foreign-born population - Saudi Arabia (%)
Place of birth for the foreign-born population - Syria (%)
Place of birth for the foreign-born population - Turkey (%)
Place of birth for the foreign-born population - Yemen (%)
Place of birth for the foreign-born population - Other Western Asia (%)
Place of birth for the foreign-born population - Eritrea (%)
Place of birth for the foreign-born population - Ethiopia (%)
Place of birth for the foreign-born population - Kenya (%)
Place of birth for the foreign-born population - Somalia (%)
Place of birth for the foreign-born population - Uganda (%)
Place of birth for the foreign-born population - Zimbabwe (%)
Place of birth for the foreign-born population - Other Eastern Africa (%)
Place of birth for the foreign-born population - Cameroon (%)
Place of birth for the foreign-born population - Congo (%)
Place of birth for the foreign-born population - Democratic Republic of Congo (Zaire) (%)
Place of birth for the foreign-born population - Other Middle Africa (%)
Place of birth for the foreign-born population - Egypt (%)
Place of birth for the foreign-born population - Morocco (%)
Place of birth for the foreign-born population - Sudan (%)
Place of birth for the foreign-born population - Other Northern Africa (%)
Place of birth for the foreign-born population - South Africa (%)
Place of birth for the foreign-born population - Other Southern Africa (%)
Place of birth for the foreign-born population - Cabo Verde (%)
Place of birth for the foreign-born population - Ghana (%)
Place of birth for the foreign-born population - Liberia (%)
Place of birth for the foreign-born population - Nigeria (%)
Place of birth for the foreign-born population - Senegal (%)
Place of birth for the foreign-born population - Sierra Leone (%)
Place of birth for the foreign-born population - Other Western Africa (%)
Place of birth for the foreign-born population - Australia (%)
Place of birth for the foreign-born population - New Zealand (%)
Place of birth for the foreign-born population - Fiji (%)
Place of birth for the foreign-born population - Micronesia (%)
Place of birth for the foreign-born population - Bahamas (%)
Place of birth for the foreign-born population - Barbados (%)
Place of birth for the foreign-born population - Cuba (%)
Place of birth for the foreign-born population - Dominica (%)
Place of birth for the foreign-born population - Dominican Republic (%)
Place of birth for the foreign-born population - Grenada (%)
Place of birth for the foreign-born population - Haiti (%)
Place of birth for the foreign-born population - Jamaica (%)
Place of birth for the foreign-born population - St. Vincent and the Grenadines (%)
Place of birth for the foreign-born population - Trinidad and Tobago (%)
Place of birth for the foreign-born population - West Indies (%)
Place of birth for the foreign-born population - Other Caribbean (%)
Place of birth for the foreign-born population - Belize (%)
Place of birth for the foreign-born population - Costa Rica (%)
Place of birth for the foreign-born population - El Salvador (%)
Place of birth for the foreign-born population - Guatemala (%)
Place of birth for the foreign-born population - Honduras (%)
Place of birth for the foreign-born population - Mexico (%)
Place of birth for the foreign-born population - Nicaragua (%)
Place of birth for the foreign-born population - Panama (%)
Place of birth for the foreign-born population - Other Central America (%)
Place of birth for the foreign-born population - Argentina (%)
Place of birth for the foreign-born population - Bolivia (%)
Place of birth for the foreign-born population - Brazil (%)
Place of birth for the foreign-born population - Chile (%)
Place of birth for the foreign-born population - Colombia (%)
Place of birth for the foreign-born population - Ecuador (%)
Place of birth for the foreign-born population - Guyana (%)
Place of birth for the foreign-born population - Peru (%)
Place of birth for the foreign-born population - Uruguay (%)
Place of birth for the foreign-born population - Venezuela (%)
Place of birth for the foreign-born population - Other South America (%)
Place of birth for the foreign-born population - Canada (%)
Place of birth for the foreign-born population - Other Northern America (%)
Place of birth for the foreign-born population - Other (%)
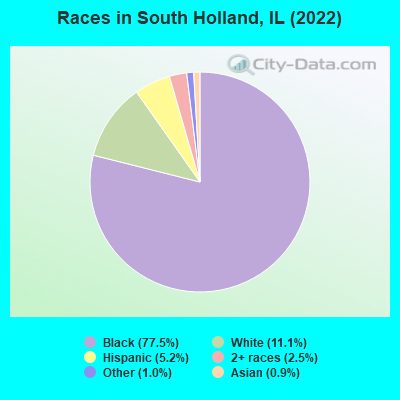
According to 2022 data, the most numerous races in South Holland, IL are White alone (2,311 residents), Hispanic (1,077 residents), and Black alone (16,122 residents). 90.1% of South Holland residents speak English at home. 4.9% of South Holland, IL residents are foreign-born (2.2% born in Africa, 1.7% born in Latin America), which is 186.8% less than the foreign-born rate of 14.0% across the entire state of Illinois.
Race distribution in South Holland
2000 2022
8,424,140 67.8% White alone 1,856,152 14.9% Black alone 1,530,262 12.3% Hispanic 419,916 3.4% Asian alone 153,996 1.2% Two or more races 13,479 0.1% Other race alone 18,232 0.1% American Indian alone 3,116 0.03% Native Hawaiian and Other
7,356,301 58.5% White alone 2,299,726 18.3% Hispanic 1,660,423 13.2% Black alone 747,296 5.9% Asian alone 458,599 3.6% Two or more races 45,386 0.4% Other race alone 10,405 0.08% American Indian alone 3,896 0.03% Native Hawaiian and Other
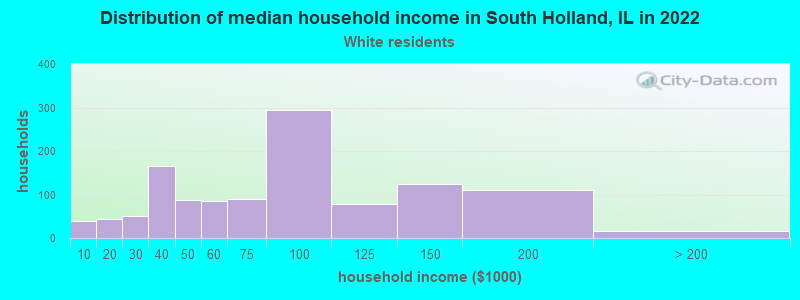
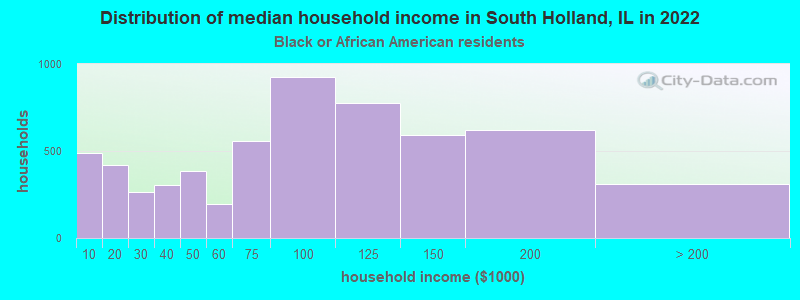
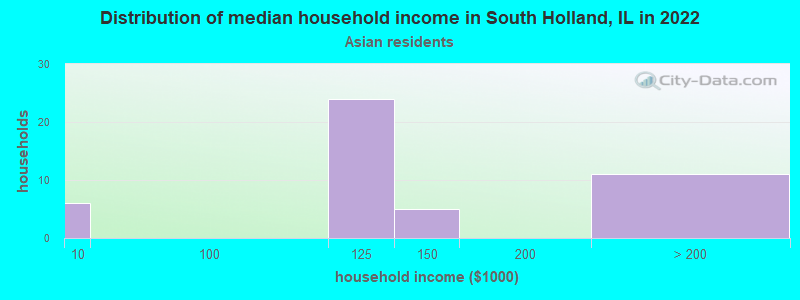
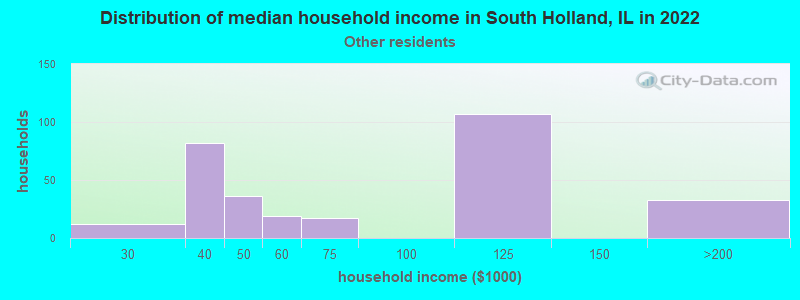
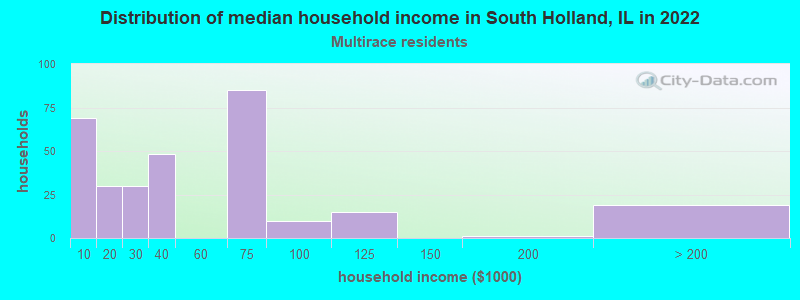
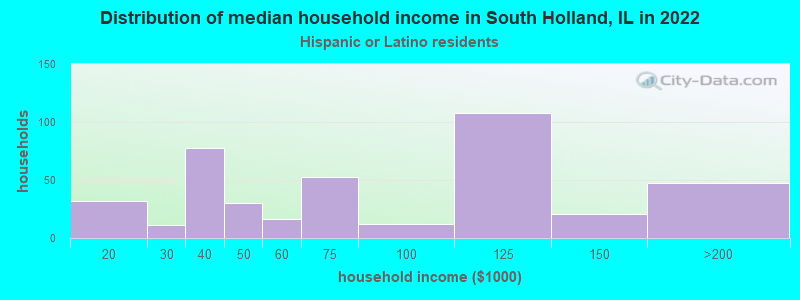
Income and house value in South Holland Median household income in 2022 $72,962 White non-Hispanic householders$82,087 Black householders$105,672 Asian householdersMedian 2022 house value $169,189 White Non-Hispanic householders$202,358 Black or African American householders$429,664 American Indian or Alaska Native householders $192,882 Asian householders$178,527 Some other race householders$190,373 Two or more races householders$179,502 Hispanic or Latino householders
Median age by race in South Holland
64.8 Median age for White residents62.8 65.5 39.9 Median age for Black or African American residents40.4 40.5 -680,473,372.1 Median age for American Indian / Alaska Native residents-736,736,736.0 -641,399,416.3 52.9 Median age for Asian residents53.5 48.1 -687,999,999.3 Median age for Native Hawaiian / Pacific Islander residents-918,721,460.3 -610,229,276.3 37.4 Median age for Other race residents39.9 34.1 26.5 Median age for Two or more races residents26.5 25.0 63.4 Median age for White alone residents62.0 63.9 34.9 Median age for Hispanic or Latino residents37.5 34.4
Owner/renter occupied households by race in South Holland
House owners and renters - White residents 1,164 97.4% Owner occupied32 2.6% Renter occupiedHouse owners and renters - Black or African American residents 4,782 81.1% Owner occupied1,116 18.9% Renter occupiedHouse owners and renters - American Indian / Alaska Native residents 19 100.0% Owner occupiedHouse owners and renters - Asian residents 47 87.4% Owner occupied7 12.6% Renter occupiedHouse owners and renters - Other race residents 226 73.0% Owner occupied83 27.0% Renter occupiedHouse owners and renters - Two or more races residents 164 55.7% Owner occupied130 44.3% Renter occupiedHouse owners and renters - White alone residents 1,183 97.1% Owner occupied35 2.9% Renter occupiedHouse owners and renters - Hispanic or Latino residents 299 71.7% Owner occupied118 28.3% Renter occupied
Language usage in South Holland
English speakers - Total 90.1% of residents of South Holland speak English at home.
4.3% of residents speak Spanish at home 624 73.8% Speak English very well222 26.2% Speak English less than very well4.9% of residents speak other language at home 813 82.9% Speak English very well168 17.1% Speak English less than very well
English speakers - Born in the United States 92.5% of residents of South Holland speak English at home.
6.5% of residents speak Spanish at home 215 97.3% Speak English very well6 2.7% Speak English less than very well0.3% of residents speak other language at home 7 77.8% Speak English very well2 22.2% Speak English less than very well
English speakers - Native, born elsewhere 57.7% of residents of South Holland speak English at home.
41.8% of residents speak other language at home 76 100.0% Speak English very well
English speakers - Foreign-born 23.3% of residents of South Holland speak English at home.
24.6% of residents speak Spanish at home 74 29.6% Speak English very well176 70.4% Speak English less than very well51.0% of residents speak other language at home 414 79.9% Speak English very well104 20.1% Speak English less than very well
White (Caucasian) - Speak only English Native:
95.4% (1,984)Foreign-born:
24.0% (31)
White (Caucasian) - Speak another language Native:
6.5% (135)Foreign-born:
76.7% (100)
Black or African American - Speak only English Native:
97.9% (14,774)Foreign-born:
31.4% (152)
Black or African American - Speak another language Native:
2.1% (311)Foreign-born:
67.2% (325)
Asian - Speak another language Native:
69.5% (87)Foreign-born:
100.0% (68)
Other race - Speak only English Native:
45.7% (303)Foreign-born:
30.8% (76)
Other race - Speak another language Native:
56.1% (372)Foreign-born:
65.8% (162)
Two or more races - Speak only English Native:
72.2% (485)Foreign-born:
10.6% (7)
Two or more races - Speak another language Native:
25.9% (174)Foreign-born:
89.4% (61)
White alone - Speak only English Native:
93.5% (2,025)Foreign-born:
42.4% (35)
White alone - Speak another language Native:
6.3% (137)Foreign-born:
54.5% (45)
Hispanic or Latino - Speak only English Native:
21.9% (139)Foreign-born:
21.5% (70)
Hispanic or Latino - Speak another language Native:
77.4% (490)Foreign-born:
76.5% (251)
Foreign-born residents in South Holland 1,016 residents are foreign born (2.2% Africa , 1.7% Latin America ).
This city:
4.9%Illinois:
14.1%
Marital status for residents in South Holland Marital status - White (Caucasian) population 15 years and over
Males 25.0% Never married49.5% Now married0.0% Separated14.3% Widowed11.2% DivorcedFemales 15.1% Never married51.3% Now married0.6% Separated24.3% Widowed8.7% DivorcedWomen who gave birth in the past 12 months Now married:
100.0% (19)Unmarried:
0.0% (0)
Women who did not give birth in the past 12 months Now married:
40.7% (63)Unmarried:
59.3% (92)
Marital status - Black or African American population 15 years and over
Males 44.5% Never married44.3% Now married1.2% Separated3.8% Widowed6.2% DivorcedFemales 46.8% Never married33.1% Now married2.6% Separated5.8% Widowed11.7% DivorcedWomen who gave birth in the past 12 months Now married:
5.4% (8)Unmarried:
94.6% (149)
Women who did not give birth in the past 12 months Now married:
23.3% (958)Unmarried:
76.7% (3,151)
Marital status - Asian population 15 years and over
Males 46.7% Never married37.8% Now married0.0% Separated0.0% Widowed15.6% DivorcedFemales 51.8% Never married29.8% Now married0.0% Separated18.4% Widowed0.0% DivorcedWomen who did not give birth in the past 12 months Now married:
0.0% (0)Unmarried:
100.0% (74)
Marital status - Other race population 15 years and over
Males 55.1% Never married36.4% Now married0.0% Separated0.0% Widowed8.5% DivorcedFemales 50.1% Never married38.7% Now married0.0% Separated0.0% Widowed11.1% DivorcedWomen who gave birth in the past 12 months Now married:
0.0% (0)Unmarried:
100.0% (15)
Women who did not give birth in the past 12 months Now married:
39.8% (113)Unmarried:
60.2% (171)
Marital status - Two or more races population 15 years and over
Males 51.7% Never married43.2% Now married2.1% Separated0.0% Widowed3.0% DivorcedFemales 44.7% Never married18.2% Now married4.4% Separated14.5% Widowed18.2% DivorcedWomen who did not give birth in the past 12 months Now married:
32.2% (40)Unmarried:
67.8% (85)
Marital status - White alone, not Hispanic / Latino population 15 years and over
Males 24.2% Never married48.4% Now married0.0% Separated15.4% Widowed12.0% DivorcedFemales 15.1% Never married49.4% Now married0.7% Separated25.9% Widowed9.0% DivorcedWomen who gave birth in the past 12 months Now married:
100.0% (21)Unmarried:
0.0% (0)
Women who did not give birth in the past 12 months Now married:
37.8% (53)Unmarried:
62.2% (88)
Marital status - Hispanic or Latino population 15 years and over
Males 37.7% Never married56.3% Now married1.0% Separated0.0% Widowed5.0% DivorcedFemales 36.6% Never married50.9% Now married0.0% Separated0.0% Widowed12.5% DivorcedWomen who gave birth in the past 12 months Now married:
0.0% (0)Unmarried:
100.0% (13)
Women who did not give birth in the past 12 months Now married:
51.1% (118)Unmarried:
48.9% (113)
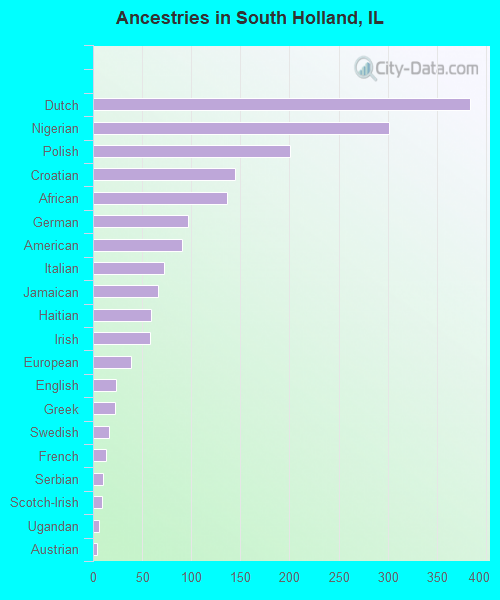
Ancestries in South Holland
384 2.7% Dutch301 2.1% Nigerian201 1.4% Polish145 1.0% Croatian136 1.0% African97 0.7% German91 0.6% American72 0.5% Italian66 0.5% Jamaican59 0.4% Haitian58 0.4% Irish39 0.3% European23 0.2% English22 0.2% Greek16 0.1% Swedish13 0.09% French10 0.07% Serbian9 0.06% Scotch-Irish6 0.04% Ugandan4 0.03% Austrian3 0.02% Lebanese1 0.01% Hungarian1 0.01% Lithuanian
Children Nativity (place of birth) in South Holland
Children under 6 years - Living with two parents Both parents native 400 100.0% NativeBoth parents foreign-born 45 100.0% NativeOne native, one foreign-born parent 69 100.0% NativeChildren under 6 years - Living with one parent Native parent 722 100.0% NativeChildren 6 to 17 years - Living with two parents Both parents native 767 100.0% NativeBoth parents foreign-born 64 38.1% Native105 61.9% Foreign-bornOne native, one foreign-born parent 67 100.0% NativeChildren 6 to 17 years - Living with one parent Native parent 2,089 100.0% Native
Grandparents responsible for own grandchildren in South Holland
Grandparents (30 to 59 years) White / Caucasian 4 100.0% Not responsible for grandchildrenBlack or African American 122 53.7% Responsible for grandchildren105 46.3% Not responsible for grandchildrenOther race 57 100.0% Not responsible for grandchildrenTwo or more races 9 100.0% Not responsible for grandchildrenHispanic or Latino 6 100.0% Not responsible for grandchildrenGrandparents (60 years and over) White / Caucasian 6 17.9% Responsible for grandchildren28 82.1% Not responsible for grandchildrenBlack or African American 98 26.9% Responsible for grandchildren267 73.1% Not responsible for grandchildrenTwo or more races 2 8.0% Responsible for grandchildren24 92.0% Not responsible for grandchildren