Races in South Jordan, Utah (UT) Detailed Stats
Data:
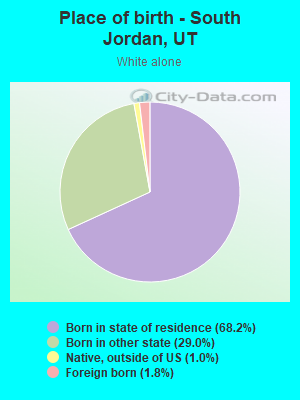
Races - White alone (%)
Races - White alone (% change since 2000)
Races - Black alone (%)
Races - Black alone (% change since 2000)
Races - American Indian alone (%)
Races - American Indian alone (% change since 2000)
Races - Asian alone (%)
Races - Asian alone (% change since 2000)
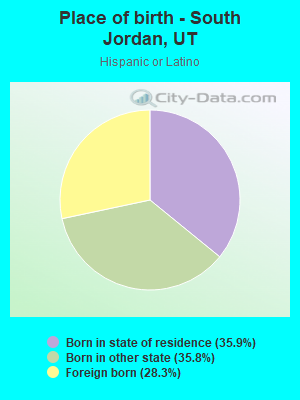
Races - Hispanic (%)
Races - Hispanic (% change since 2000)
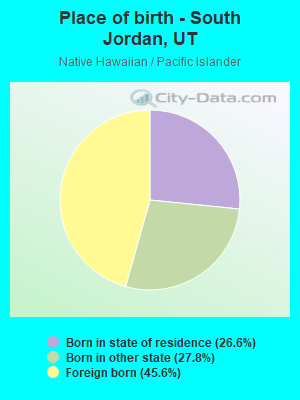
Races - Native Hawaiian and Other Pacific Islander alone (%)
Races - Native Hawaiian and Other Pacific Islander alone (% change since 2000)
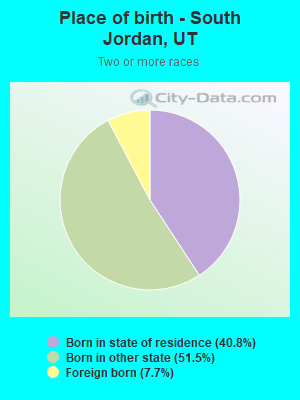
Races - Two or more races(%)
Races - Two or more races(% change since 2000)
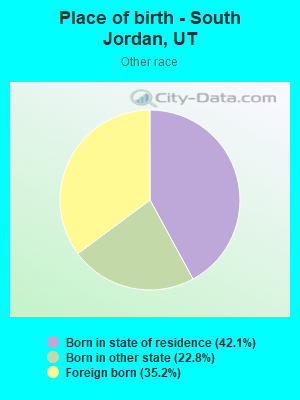
Races - Other race alone (%)
Races - Other race alone (% change since 2000)
Racial diversity
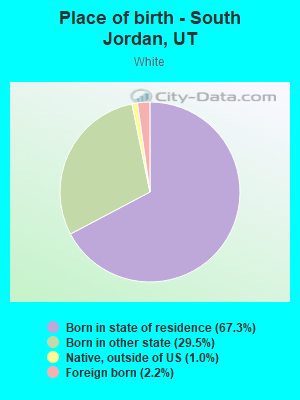
Place of birth - Born in state of residence (%)
Place of birth - Born in state of residence (%) - White
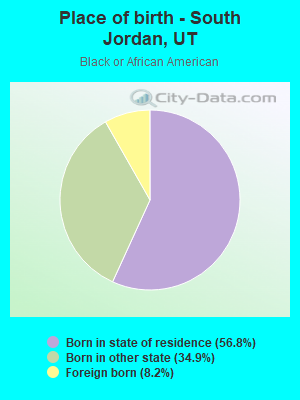
Place of birth - Born in state of residence (%) - Black or African American
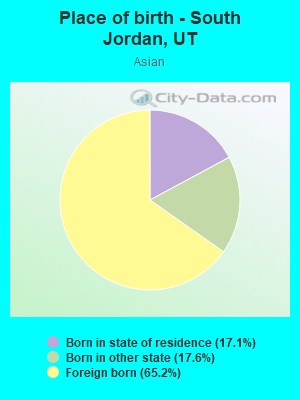
Place of birth - Born in state of residence (%) - Asian
Place of birth - Born in state of residence (%) - Hispanic or Latino
Place of birth - Born in state of residence (%) - American Indian and Alaska Native
Place of birth - Born in state of residence (%) - Multirace
Place of birth - Born in state of residence (%) - Other Race
Place of birth - Born in other state (%)
Place of birth - Born in other state (%) - White
Place of birth - Born in other state (%) - Black or African American
Place of birth - Born in other state (%) - Asian
Place of birth - Born in other state (%) - Hispanic or Latino
Place of birth - Born in other state (%) - American Indian and Alaska Native
Place of birth - Born in other state (%) - Multirace
Place of birth - Born in other state (%) - Other Race
Place of birth - Native, outside of US (%)
Place of birth - Native, outside of US (%) - White
Place of birth - Native, outside of US (%) - Black or African American
Place of birth - Native, outside of US (%) - Asian
Place of birth - Native, outside of US (%) - Hispanic or Latino
Place of birth - Native, outside of US (%) - American Indian and Alaska Native
Place of birth - Native, outside of US (%) - Multirace
Place of birth - Native, outside of US (%) - Other Race
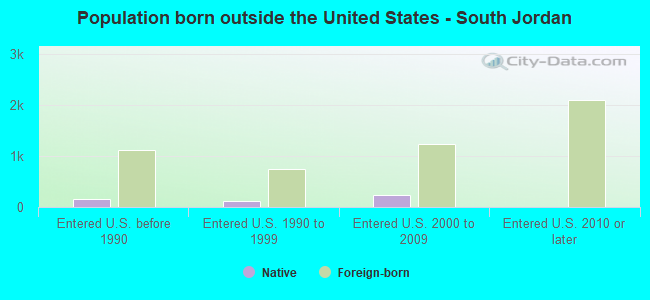
Place of birth - Foreign born (%)
Place of birth - Foreign born (%) - White
Place of birth - Foreign born (%) - Black or African American
Place of birth - Foreign born (%) - Asian
Place of birth - Foreign born (%) - Hispanic or Latino
Place of birth - Foreign born (%) - American Indian and Alaska Native
Place of birth - Foreign born (%) - Multirace
Place of birth - Foreign born (%) - Other Race
Residents speaking English at home (%)
Residents speaking English at home - Born in the United States (%)
Residents speaking English at home - Native, born elsewhere (%)
Residents speaking English at home - Foreign born (%)
Residents speaking Spanish at home (%)
Residents speaking Spanish at home - Born in the United States (%)
Residents speaking Spanish at home - Native, born elsewhere (%)
Residents speaking Spanish at home - Foreign born (%)
Residents speaking other language at home (%)
Residents speaking other language at home - Born in the United States (%)
Residents speaking other language at home - Native, born elsewhere (%)
Residents speaking other language at home - Foreign born (%)
Marital status - Never married (%)
Marital status - Now married (%)
Marital status - Separated (%)
Marital status - Widowed (%)
Marital status - Divorced (%)
Ancestries Reported - Arab (%)
Ancestries Reported - Czech (%)
Ancestries Reported - Danish (%)
Ancestries Reported - Dutch (%)
Ancestries Reported - English (%)
Ancestries Reported - French (%)
Ancestries Reported - French Canadian (%)
Ancestries Reported - German (%)
Ancestries Reported - Greek (%)
Ancestries Reported - Hungarian (%)
Ancestries Reported - Irish (%)
Ancestries Reported - Italian (%)
Ancestries Reported - Lithuanian (%)
Ancestries Reported - Norwegian (%)
Ancestries Reported - Polish (%)
Ancestries Reported - Portuguese (%)
Ancestries Reported - Russian (%)
Ancestries Reported - Scotch-Irish (%)
Ancestries Reported - Scottish (%)
Ancestries Reported - Slovak (%)
Ancestries Reported - Subsaharan African (%)
Ancestries Reported - Swedish (%)
Ancestries Reported - Swiss (%)
Ancestries Reported - Ukrainian (%)
Ancestries Reported - United States (%)
Ancestries Reported - Welsh (%)
Ancestries Reported - West Indian (%)
Ancestries Reported - Other (%)
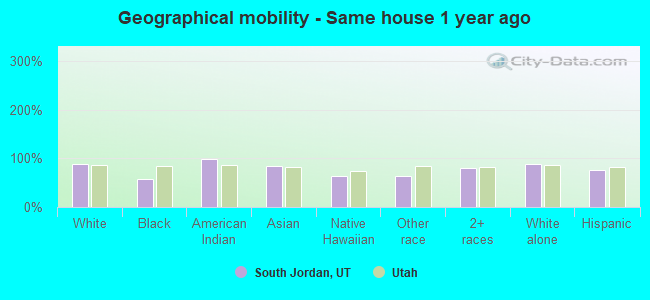
Geographical mobility - Same house 1 year ago (%)
Geographical mobility - Same house 1 year ago (%) - White
Geographical mobility - Same house 1 year ago (%) - Black or African American
Geographical mobility - Same house 1 year ago (%) - Asian
Geographical mobility - Same house 1 year ago (%) - Hispanic or Latino
Geographical mobility - Same house 1 year ago (%) - American Indian and Alaska Native
Geographical mobility - Same house 1 year ago (%) - Multirace
Geographical mobility - Same house 1 year ago (%) - Other Race
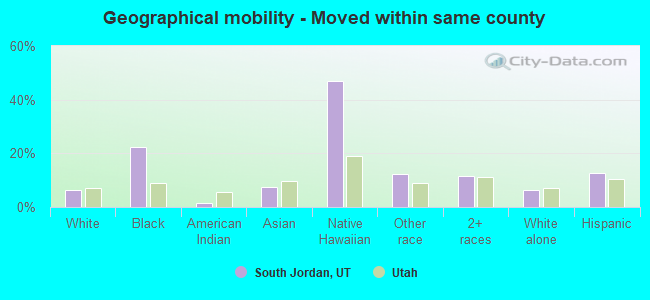
Geographical mobility - Moved within same county (%)
Geographical mobility - Moved within same county (%) - White
Geographical mobility - Moved within same county (%) - Black or African American
Geographical mobility - Moved within same county (%) - Asian
Geographical mobility - Moved within same county (%) - Hispanic or Latino
Geographical mobility - Moved within same county (%) - American Indian and Alaska Native
Geographical mobility - Moved within same county (%) - Multirace
Geographical mobility - Moved within same county (%) - Other Race
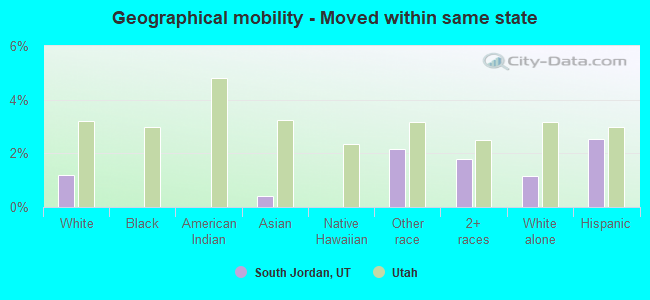
Geographical mobility - Moved from different county within same state (%)
Geographical mobility - Moved from different county within same state (%) - White
Geographical mobility - Moved from different county within same state (%) - Black or African American
Geographical mobility - Moved from different county within same state (%) - Asian
Geographical mobility - Moved from different county within same state (%) - Hispanic or Latino
Geographical mobility - Moved from different county within same state (%) - American Indian and Alaska Native
Geographical mobility - Moved from different county within same state (%) - Multirace
Geographical mobility - Moved from different county within same state (%) - Other Race
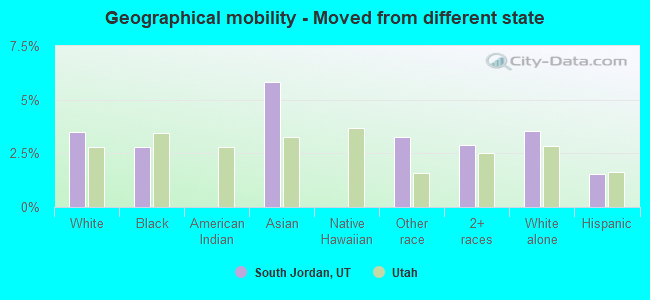
Geographical mobility - Moved from different state (%)
Geographical mobility - Moved from different state (%) - White
Geographical mobility - Moved from different state (%) - Black or African American
Geographical mobility - Moved from different state (%) - Asian
Geographical mobility - Moved from different state (%) - Hispanic or Latino
Geographical mobility - Moved from different state (%) - American Indian and Alaska Native
Geographical mobility - Moved from different state (%) - Multirace
Geographical mobility - Moved from different state (%) - Other Race
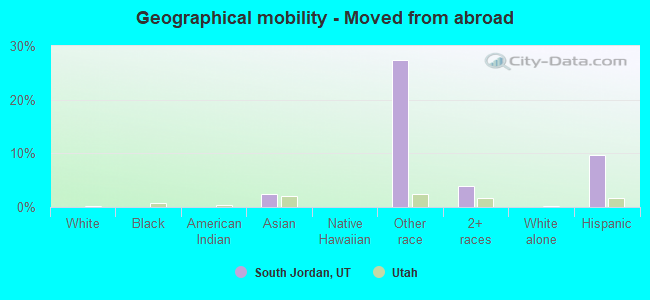
Geographical mobility - Moved from abroad (%)
Geographical mobility - Moved from abroad (%) - White
Geographical mobility - Moved from abroad (%) - Black or African American
Geographical mobility - Moved from abroad (%) - Asian
Geographical mobility - Moved from abroad (%) - Hispanic or Latino
Geographical mobility - Moved from abroad (%) - American Indian and Alaska Native
Geographical mobility - Moved from abroad (%) - Multirace
Geographical mobility - Moved from abroad (%) - Other Race
Place of birth for the foreign-born population - Ireland (%)
Place of birth for the foreign-born population - Denmark (%)
Place of birth for the foreign-born population - Norway (%)
Place of birth for the foreign-born population - Sweden (%)
Place of birth for the foreign-born population - United Kingdom (%)
Place of birth for the foreign-born population - England (%)
Place of birth for the foreign-born population - Scotland (%)
Place of birth for the foreign-born population - Other Northern Europe (%)
Place of birth for the foreign-born population - Austria (%)
Place of birth for the foreign-born population - Belgium (%)
Place of birth for the foreign-born population - France (%)
Place of birth for the foreign-born population - Germany (%)
Place of birth for the foreign-born population - Netherlands (%)
Place of birth for the foreign-born population - Switzerland (%)
Place of birth for the foreign-born population - Other Western Europe (%)
Place of birth for the foreign-born population - Greece (%)
Place of birth for the foreign-born population - Italy (%)
Place of birth for the foreign-born population - Portugal (%)
Place of birth for the foreign-born population - Spain (%)
Place of birth for the foreign-born population - Other Southern Europe (%)
Place of birth for the foreign-born population - Albania (%)
Place of birth for the foreign-born population - Belarus (%)
Place of birth for the foreign-born population - Bosnia and Herzegovina (%)
Place of birth for the foreign-born population - Bulgaria (%)
Place of birth for the foreign-born population - Croatia (%)
Place of birth for the foreign-born population - Czechoslovakia (%)
Place of birth for the foreign-born population - Hungary (%)
Place of birth for the foreign-born population - Latvia (%)
Place of birth for the foreign-born population - Lithuania (%)
Place of birth for the foreign-born population - North Macedonia (Macedonia) (%)
Place of birth for the foreign-born population - Moldova (%)
Place of birth for the foreign-born population - Poland (%)
Place of birth for the foreign-born population - Romania (%)
Place of birth for the foreign-born population - Russia (%)
Place of birth for the foreign-born population - Serbia (%)
Place of birth for the foreign-born population - Ukraine (%)
Place of birth for the foreign-born population - Other Eastern Europe (%)
Place of birth for the foreign-born population - China (%)
Place of birth for the foreign-born population - Hong Kong (%)
Place of birth for the foreign-born population - Taiwan (%)
Place of birth for the foreign-born population - Japan (%)
Place of birth for the foreign-born population - Korea (%)
Place of birth for the foreign-born population - Other Eastern Asia (%)
Place of birth for the foreign-born population - Afghanistan (%)
Place of birth for the foreign-born population - Bangladesh (%)
Place of birth for the foreign-born population - India (%)
Place of birth for the foreign-born population - Iran (%)
Place of birth for the foreign-born population - Kazakhstan (%)
Place of birth for the foreign-born population - Nepal (%)
Place of birth for the foreign-born population - Pakistan (%)
Place of birth for the foreign-born population - Sri Lanka (%)
Place of birth for the foreign-born population - Uzbekistan (%)
Place of birth for the foreign-born population - Other South Central Asia (%)
Place of birth for the foreign-born population - Burma (%)
Place of birth for the foreign-born population - Cambodia (%)
Place of birth for the foreign-born population - Indonesia (%)
Place of birth for the foreign-born population - Laos (%)
Place of birth for the foreign-born population - Malaysia (%)
Place of birth for the foreign-born population - Philippines (%)
Place of birth for the foreign-born population - Singapore (%)
Place of birth for the foreign-born population - Thailand (%)
Place of birth for the foreign-born population - Vietnam (%)
Place of birth for the foreign-born population - Other South Eastern Asia (%)
Place of birth for the foreign-born population - Armenia (%)
Place of birth for the foreign-born population - Iraq (%)
Place of birth for the foreign-born population - Israel (%)
Place of birth for the foreign-born population - Jordan (%)
Place of birth for the foreign-born population - Kuwait (%)
Place of birth for the foreign-born population - Lebanon (%)
Place of birth for the foreign-born population - Saudi Arabia (%)
Place of birth for the foreign-born population - Syria (%)
Place of birth for the foreign-born population - Turkey (%)
Place of birth for the foreign-born population - Yemen (%)
Place of birth for the foreign-born population - Other Western Asia (%)
Place of birth for the foreign-born population - Eritrea (%)
Place of birth for the foreign-born population - Ethiopia (%)
Place of birth for the foreign-born population - Kenya (%)
Place of birth for the foreign-born population - Somalia (%)
Place of birth for the foreign-born population - Uganda (%)
Place of birth for the foreign-born population - Zimbabwe (%)
Place of birth for the foreign-born population - Other Eastern Africa (%)
Place of birth for the foreign-born population - Cameroon (%)
Place of birth for the foreign-born population - Congo (%)
Place of birth for the foreign-born population - Democratic Republic of Congo (Zaire) (%)
Place of birth for the foreign-born population - Other Middle Africa (%)
Place of birth for the foreign-born population - Egypt (%)
Place of birth for the foreign-born population - Morocco (%)
Place of birth for the foreign-born population - Sudan (%)
Place of birth for the foreign-born population - Other Northern Africa (%)
Place of birth for the foreign-born population - South Africa (%)
Place of birth for the foreign-born population - Other Southern Africa (%)
Place of birth for the foreign-born population - Cabo Verde (%)
Place of birth for the foreign-born population - Ghana (%)
Place of birth for the foreign-born population - Liberia (%)
Place of birth for the foreign-born population - Nigeria (%)
Place of birth for the foreign-born population - Senegal (%)
Place of birth for the foreign-born population - Sierra Leone (%)
Place of birth for the foreign-born population - Other Western Africa (%)
Place of birth for the foreign-born population - Australia (%)
Place of birth for the foreign-born population - New Zealand (%)
Place of birth for the foreign-born population - Fiji (%)
Place of birth for the foreign-born population - Micronesia (%)
Place of birth for the foreign-born population - Bahamas (%)
Place of birth for the foreign-born population - Barbados (%)
Place of birth for the foreign-born population - Cuba (%)
Place of birth for the foreign-born population - Dominica (%)
Place of birth for the foreign-born population - Dominican Republic (%)
Place of birth for the foreign-born population - Grenada (%)
Place of birth for the foreign-born population - Haiti (%)
Place of birth for the foreign-born population - Jamaica (%)
Place of birth for the foreign-born population - St. Vincent and the Grenadines (%)
Place of birth for the foreign-born population - Trinidad and Tobago (%)
Place of birth for the foreign-born population - West Indies (%)
Place of birth for the foreign-born population - Other Caribbean (%)
Place of birth for the foreign-born population - Belize (%)
Place of birth for the foreign-born population - Costa Rica (%)
Place of birth for the foreign-born population - El Salvador (%)
Place of birth for the foreign-born population - Guatemala (%)
Place of birth for the foreign-born population - Honduras (%)
Place of birth for the foreign-born population - Mexico (%)
Place of birth for the foreign-born population - Nicaragua (%)
Place of birth for the foreign-born population - Panama (%)
Place of birth for the foreign-born population - Other Central America (%)
Place of birth for the foreign-born population - Argentina (%)
Place of birth for the foreign-born population - Bolivia (%)
Place of birth for the foreign-born population - Brazil (%)
Place of birth for the foreign-born population - Chile (%)
Place of birth for the foreign-born population - Colombia (%)
Place of birth for the foreign-born population - Ecuador (%)
Place of birth for the foreign-born population - Guyana (%)
Place of birth for the foreign-born population - Peru (%)
Place of birth for the foreign-born population - Uruguay (%)
Place of birth for the foreign-born population - Venezuela (%)
Place of birth for the foreign-born population - Other South America (%)
Place of birth for the foreign-born population - Canada (%)
Place of birth for the foreign-born population - Other Northern America (%)
Place of birth for the foreign-born population - Other (%)
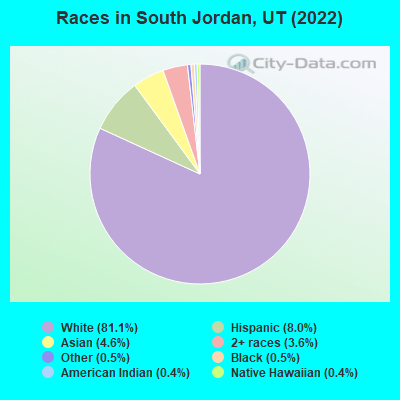
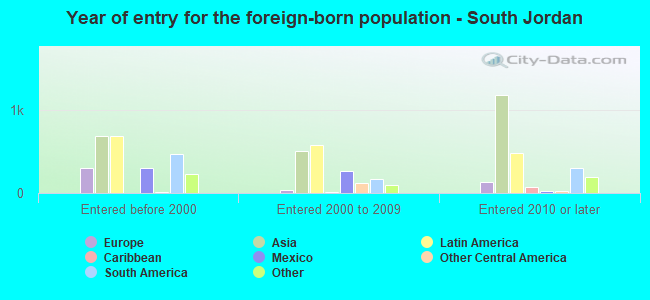
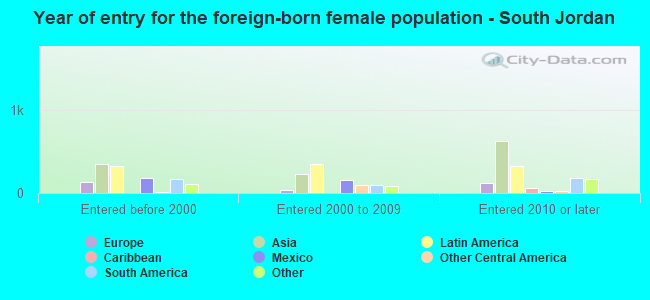
According to 2022 data, the most numerous races in South Jordan, UT are White alone (63,684 residents), Hispanic (6,317 residents), and Two or more races (2,822 residents). 89.4% of South Jordan residents speak English at home. 6.7% of South Jordan, UT residents are foreign-born (2.9% born in Asia, 2.2% born in Latin America), which is 19.6% less than the foreign-born rate of 8.0% across the entire state of Utah.
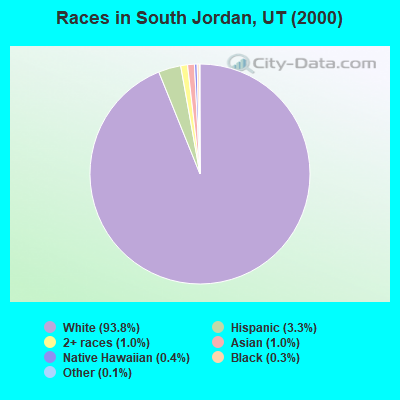
Race distribution in South Jordan
2000 2022
1,904,265 85.3% White alone 201,559 9.0% Hispanic 36,483 1.6% Asian alone 31,308 1.4% Two or more races 26,663 1.2% American Indian alone 14,806 0.7% Native Hawaiian and Other 16,137 0.7% Black alone 1,948 0.09% Other race alone
2,557,466 75.6% White alone 512,086 15.1% Hispanic 119,308 3.5% Two or more races 82,388 2.4% Asian alone 36,978 1.1% Native Hawaiian and Other 34,873 1.0% Black alone 22,803 0.7% American Indian alone 14,898 0.4% Other race alone
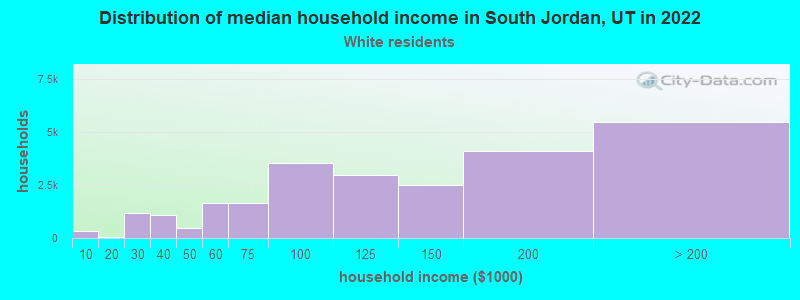
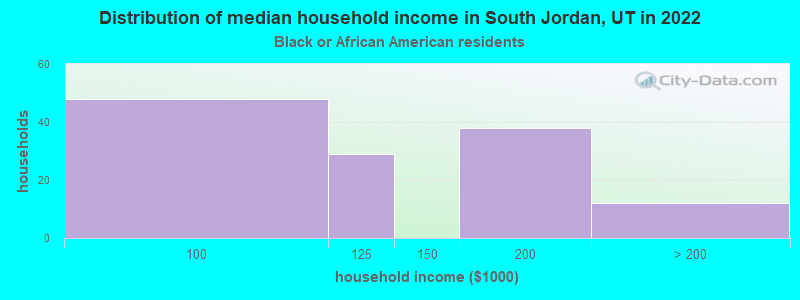
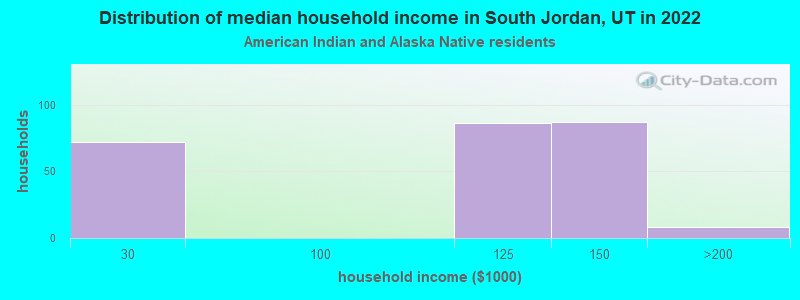
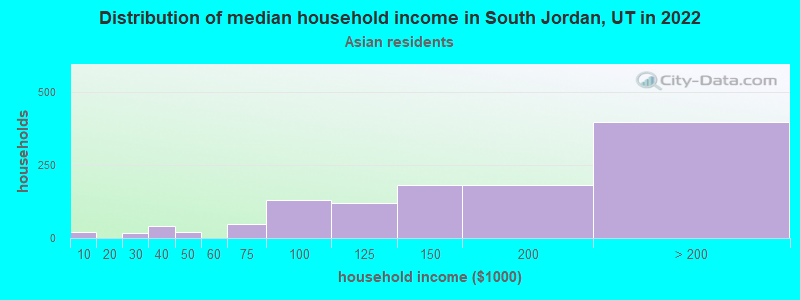
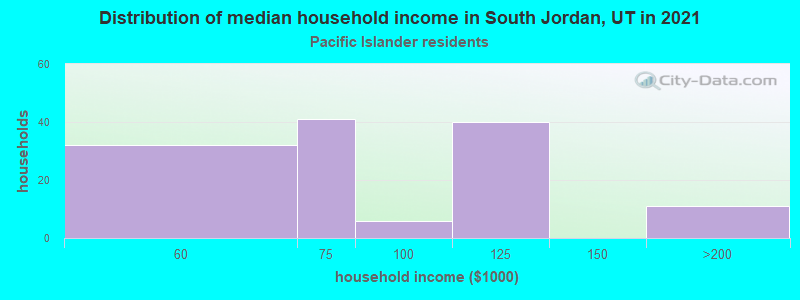
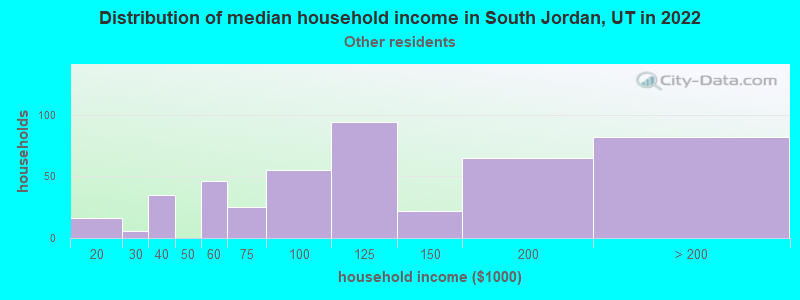
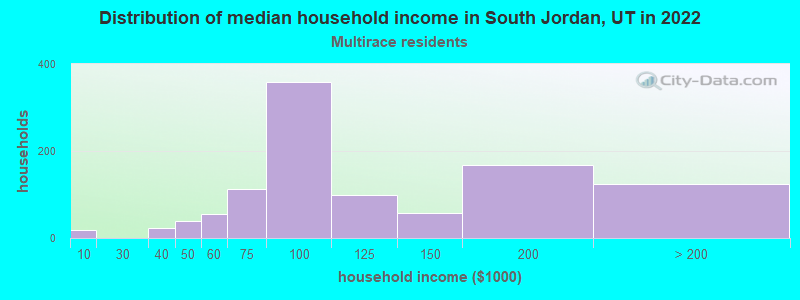
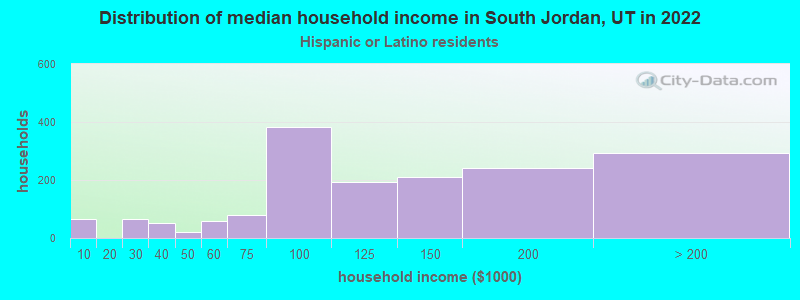
Income and house value in South Jordan Median household income in 2022 $119,613 White non-Hispanic householdersover $200,000 Asian householders$125,078 Some other race householders$100,763 Two or more races householders$100,756 Hispanic or Latino race householdersMedian 2022 house value $642,311 White Non-Hispanic householders$512,175 Black or African American householders$324,618 American Indian or Alaska Native householders $560,074 Asian householders$613,167 Native Hawaiian and other Pacific Islander householders$499,190 Some other race householders$476,106 Two or more races householders$611,148 Hispanic or Latino householders
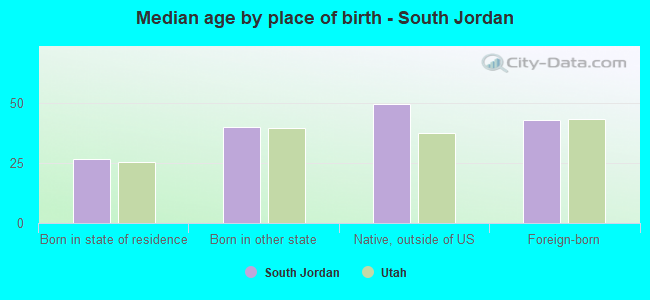
Median age by race in South Jordan
36.6 Median age for White residents36.3 36.9 3.6 Median age for Black or African American residents-666,666,666.0 -666,666,666.0 44.0 Median age for American Indian / Alaska Native residents-666,666,666.0 21.7 37.4 Median age for Asian residents40.2 36.2 -666,666,666.0 Median age for Native Hawaiian / Pacific Islander residents-666,666,666.0 -666,666,666.0 25.4 Median age for Other race residents16.2 25.7 19.0 Median age for Two or more races residents16.7 20.0 36.5 Median age for White alone residents36.0 36.9 31.3 Median age for Hispanic or Latino residents29.5 31.8
Owner/renter occupied households by race in South Jordan
House owners and renters - White residents 20,042 80.3% Owner occupied4,927 19.7% Renter occupiedHouse owners and renters - Black or African American residents 91 70.2% Owner occupied39 29.8% Renter occupiedHouse owners and renters - American Indian / Alaska Native residents 191 82.2% Owner occupied41 17.8% Renter occupiedHouse owners and renters - Asian residents 926 80.7% Owner occupied221 19.3% Renter occupiedHouse owners and renters - Native Hawaiian / Pacific Islander residents 88 65.1% Owner occupied47 34.9% Renter occupiedHouse owners and renters - Other race residents 426 90.7% Owner occupied43 9.3% Renter occupiedHouse owners and renters - Two or more races residents 839 77.4% Owner occupied245 22.6% Renter occupiedHouse owners and renters - White alone residents 19,514 81.2% Owner occupied4,509 18.8% Renter occupiedHouse owners and renters - Hispanic or Latino residents 1,171 71.8% Owner occupied461 28.2% Renter occupied
Language usage in South Jordan
English speakers - Total 89.4% of residents of South Jordan speak English at home.
3.5% of residents speak Spanish at home 2,007 72.6% Speak English very well758 27.4% Speak English less than very well7.0% of residents speak other language at home 4,096 73.9% Speak English very well1,450 26.1% Speak English less than very well
English speakers - Born in the United States 92.2% of residents of South Jordan speak English at home.
4.1% of residents speak Spanish at home 976 95.8% Speak English very well43 4.2% Speak English less than very well3.8% of residents speak other language at home 785 83.9% Speak English very well151 16.1% Speak English less than very well
English speakers - Native, born elsewhere 93.3% of residents of South Jordan speak English at home.
6.7% of residents speak Spanish at home 47 100.0% Speak English very well
English speakers - Foreign-born 15.2% of residents of South Jordan speak English at home.
22.2% of residents speak Spanish at home 697 55.6% Speak English very well557 44.4% Speak English less than very well62.6% of residents speak other language at home 2,401 67.8% Speak English very well1,139 32.2% Speak English less than very well
White (Caucasian) - Speak only English Native:
96.2% (62,969)Foreign-born:
27.1% (423)
White (Caucasian) - Speak another language Native:
3.8% (2,466)Foreign-born:
72.9% (1,138)
Black or African American - Speak another language Native:
18.8% (60)Foreign-born:
92.8% (20)
American Indian / Alaska Native - Speak another language Native:
64.6% (409)Foreign-born:
94.0% (249)
Asian - Speak only English Native:
85.2% (1,235)Foreign-born:
15.4% (436)
Asian - Speak another language Native:
14.8% (214)Foreign-born:
84.6% (2,395)
Other race - Speak only English Native:
50.7% (651)Foreign-born:
23.9% (214)
Other race - Speak another language Native:
44.0% (564)Foreign-born:
82.8% (743)
Two or more races - Speak only English Native:
87.8% (3,412)Foreign-born:
17.5% (107)
Two or more races - Speak another language Native:
12.1% (470)Foreign-born:
76.0% (467)
White alone - Speak only English Native:
96.3% (62,303)Foreign-born:
33.0% (423)
White alone - Speak another language Native:
3.7% (2,418)Foreign-born:
67.0% (858)
Hispanic or Latino - Speak another language Native:
17.4% (477)Foreign-born:
100.0% (1,254)
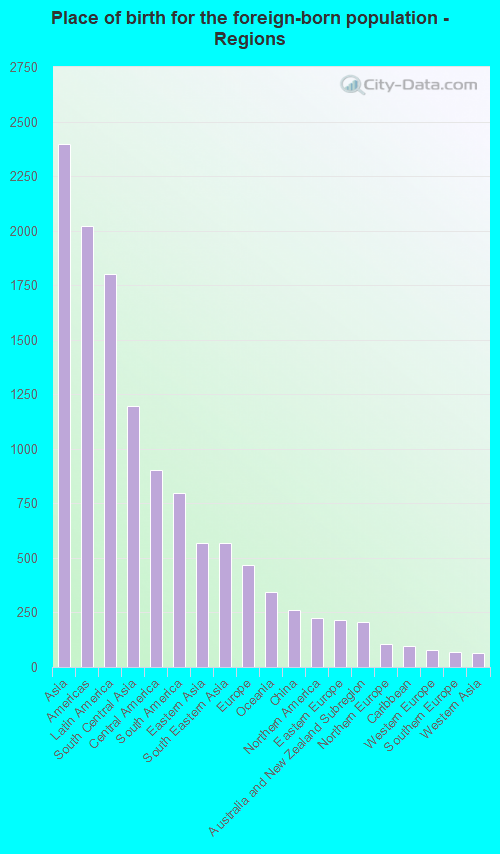
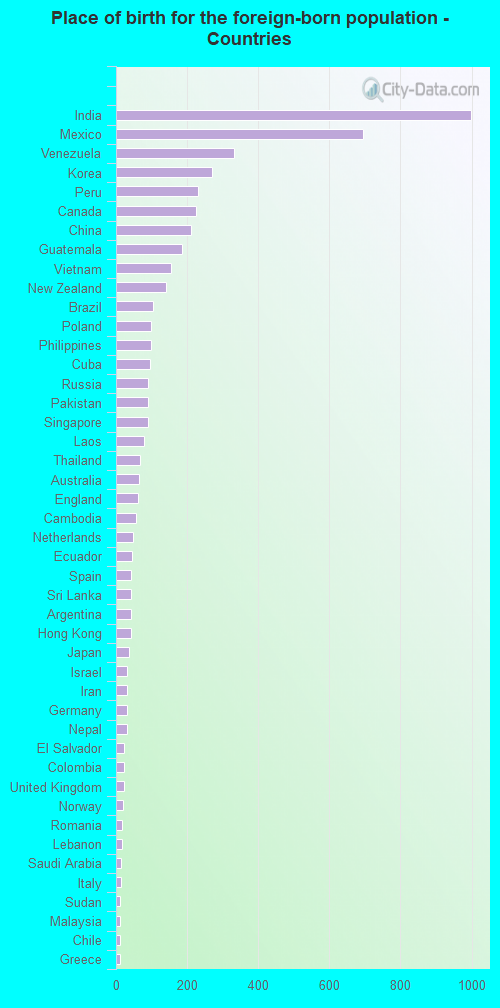
Foreign-born residents in South Jordan 5,249 residents are foreign born (2.9% Asia , 2.2% Latin America ).
Marital status for residents in South Jordan Marital status - White (Caucasian) population 15 years and over
Males 29.8% Never married64.0% Now married0.4% Separated0.6% Widowed5.2% DivorcedFemales 27.5% Never married58.5% Now married0.0% Separated4.9% Widowed9.2% DivorcedWomen who gave birth in the past 12 months Now married:
100.0% (367)Unmarried:
0.0% (0)
Women who did not give birth in the past 12 months Now married:
50.4% (8,972)Unmarried:
49.6% (8,836)
Marital status - Black or African American population 15 years and over
Males 26.9% Never married73.1% Now married0.0% Separated0.0% Widowed0.0% DivorcedFemales 7.0% Never married93.0% Now married0.0% Separated0.0% Widowed0.0% DivorcedWomen who did not give birth in the past 12 months Now married:
90.9% (38)Unmarried:
9.1% (4)
Marital status - American Indian / Alaska Native population 15 years and over
Males 82.6% Never married17.4% Now married0.0% Separated0.0% Widowed0.0% DivorcedFemales 21.3% Never married78.7% Now married0.0% Separated0.0% Widowed0.0% DivorcedWomen who gave birth in the past 12 months Now married:
100.0% (48)Unmarried:
0.0% (0)
Women who did not give birth in the past 12 months Now married:
58.8% (117)Unmarried:
41.2% (82)
Marital status - Asian population 15 years and over
Males 32.7% Never married62.3% Now married5.0% Separated0.0% Widowed0.0% DivorcedFemales 27.5% Never married59.9% Now married0.0% Separated3.1% Widowed9.5% DivorcedWomen who gave birth in the past 12 months Now married:
100.0% (98)Unmarried:
0.0% (0)
Women who did not give birth in the past 12 months Now married:
56.9% (663)Unmarried:
43.1% (502)
Marital status - Native Hawaiian / Pacific Islander population 15 years and over
Males 0.0% Never married100.0% Now married0.0% Separated0.0% Widowed0.0% DivorcedFemales 68.5% Never married31.5% Now married0.0% Separated0.0% Widowed0.0% DivorcedWomen who did not give birth in the past 12 months Now married:
17.3% (28)Unmarried:
82.7% (132)
Marital status - Other race population 15 years and over
Males 44.9% Never married46.0% Now married0.0% Separated0.0% Widowed9.1% DivorcedFemales 47.6% Never married47.1% Now married0.0% Separated0.8% Widowed4.5% DivorcedWomen who gave birth in the past 12 months Now married:
100.0% (86)Unmarried:
0.0% (0)
Women who did not give birth in the past 12 months Now married:
41.9% (282)Unmarried:
58.1% (392)
Marital status - Two or more races population 15 years and over
Males 38.4% Never married55.7% Now married2.1% Separated0.0% Widowed3.8% DivorcedFemales 27.8% Never married57.2% Now married0.7% Separated0.6% Widowed13.8% DivorcedWomen who gave birth in the past 12 months Now married:
100.0% (137)Unmarried:
0.0% (0)
Women who did not give birth in the past 12 months Now married:
47.4% (720)Unmarried:
52.6% (797)
Marital status - White alone, not Hispanic / Latino population 15 years and over
Males 30.0% Never married63.8% Now married0.4% Separated0.6% Widowed5.2% DivorcedFemales 26.8% Never married59.8% Now married0.0% Separated5.0% Widowed8.5% DivorcedWomen who gave birth in the past 12 months Now married:
100.0% (367)Unmarried:
0.0% (0)
Women who did not give birth in the past 12 months Now married:
51.4% (8,972)Unmarried:
48.6% (8,470)
Marital status - Hispanic or Latino population 15 years and over
Males 43.1% Never married46.6% Now married0.8% Separated1.8% Widowed7.7% DivorcedFemales 30.5% Never married56.5% Now married0.6% Separated0.9% Widowed11.5% DivorcedWomen who gave birth in the past 12 months Now married:
95.3% (211)Unmarried:
4.7% (10)
Women who did not give birth in the past 12 months Now married:
48.5% (816)Unmarried:
51.5% (867)
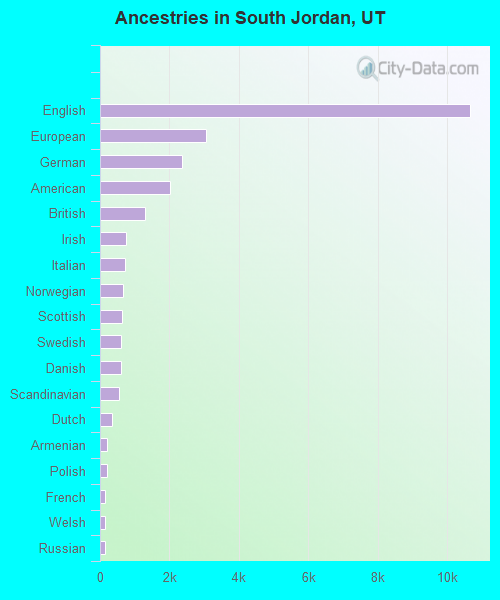
Ancestries in South Jordan
10,670 29.3% English3,061 8.4% European2,360 6.5% German2,004 5.5% American1,285 3.5% British754 2.1% Irish732 2.0% Italian655 1.8% Norwegian620 1.7% Scottish614 1.7% Swedish602 1.7% Danish555 1.5% Scandinavian355 1.0% Dutch206 0.6% Armenian201 0.6% Polish156 0.4% French153 0.4% Welsh139 0.4% Russian95 0.3% Swiss87 0.2% Brazilian84 0.2% Greek81 0.2% Northern European73 0.2% Finnish71 0.2% Scotch-Irish62 0.2% Palestinian56 0.2% Canadian48 0.1% Iranian46 0.1% Belgian31 0.09% Czechoslovakian27 0.07% Eastern European26 0.07% Lebanese21 0.06% Belizean20 0.05% Israeli18 0.05% Basque18 0.05% Ukrainian16 0.04% Austrian14 0.04% Romanian12 0.03% Portuguese12 0.03% Somali10 0.03% French Canadian7 0.02% Sudanese6 0.02% Croatian6 0.02% Australian4 0.01% Icelander
Geographical mobility in South Jordan Same house 1 year ago 62,193 88.8% White (Caucasian)215 57.5% Black or African American739 98.2% American Indian / Alaska Native3,126 84.1% Asian209 64.2% Native Hawaiian / Pacific Islander1,572 63.8% Other race4,168 80.7% Two or more races61,443 89.0% White alone, not Hispanic / Latino4,645 76.1% Hispanic or LatinoMoved within same county 4,504 6.4% White / Caucasian83 22.2% Black or African American12 1.6% American Indian / Alaska Native273 7.3% Asian153 46.9% Native Hawaiian / Pacific Islander307 12.4% Other race592 11.5% Two or more races4,312 6.2% White alone, not Hispanic / Latino782 12.8% Hispanic or LatinoMoved within same state 847 1.2% White / Caucasian15 0.4% Asian53 2.2% Other race92 1.8% Two or more races795 1.2% White alone, not Hispanic / Latino155 2.5% Hispanic or LatinoMoved from different state 2,455 3.5% White / Caucasian10 2.8% Black or African American216 5.8% Asian81 3.3% Other race149 2.9% Two or more races2,455 3.6% White alone, not Hispanic / Latino93 1.5% Hispanic or LatinoMoved from abroad 89 2.4% Asian673 27.3% Other race204 4.0% Two or more races592 9.7% Hispanic or Latino
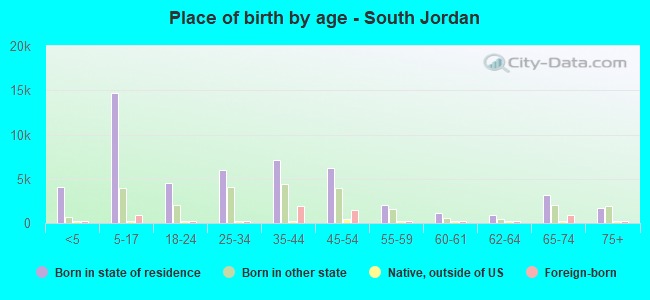
Children Nativity (place of birth) in South Jordan
Children under 6 years - Living with two parents Both parents native 4,872 100.0% NativeBoth parents foreign-born 314 100.0% NativeOne native, one foreign-born parent 318 100.0% NativeChildren under 6 years - Living with one parent Native parent 691 100.0% NativeForeign-born parent 34 100.0% NativeChildren 6 to 17 years - Living with two parents Both parents native 12,134 99.4% Native74 0.6% Foreign-bornBoth parents foreign-born 623 72.9% Native232 27.1% Foreign-bornOne native, one foreign-born parent 683 92.2% Native58 7.8% Foreign-bornChildren 6 to 17 years - Living with one parent Native parent 1,936 100.0% NativeForeign-born parent 228 51.5% Native214 48.5% Foreign-born
Grandparents responsible for own grandchildren in South Jordan
Grandparents (30 to 59 years) White / Caucasian 40 10.1% Responsible for grandchildren359 89.9% Not responsible for grandchildrenWhite alone, not Hispanic / Latino 49 11.2% Responsible for grandchildren391 88.8% Not responsible for grandchildrenGrandparents (60 years and over) White / Caucasian 51 6.1% Responsible for grandchildren794 93.9% Not responsible for grandchildrenWhite alone, not Hispanic / Latino 52 5.9% Responsible for grandchildren826 94.1% Not responsible for grandchildren