Races in South Laurel, Maryland (MD) Detailed Stats
Data:
Races - White alone (%)
Races - White alone (% change since 2000)
Races - Black alone (%)
Races - Black alone (% change since 2000)
Races - American Indian alone (%)
Races - American Indian alone (% change since 2000)
Races - Asian alone (%)
Races - Asian alone (% change since 2000)
Races - Hispanic (%)
Races - Hispanic (% change since 2000)
Races - Native Hawaiian and Other Pacific Islander alone (%)
Races - Native Hawaiian and Other Pacific Islander alone (% change since 2000)
Races - Two or more races(%)
Races - Two or more races(% change since 2000)
Races - Other race alone (%)
Races - Other race alone (% change since 2000)
Racial diversity
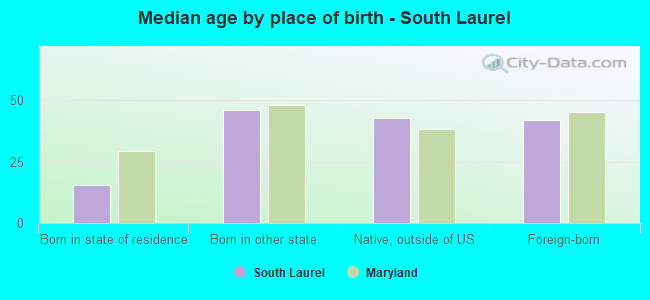
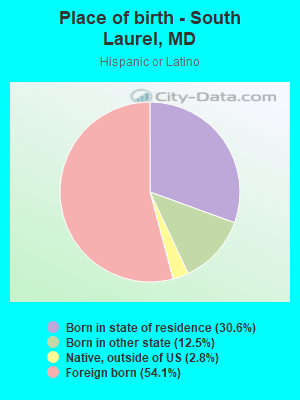
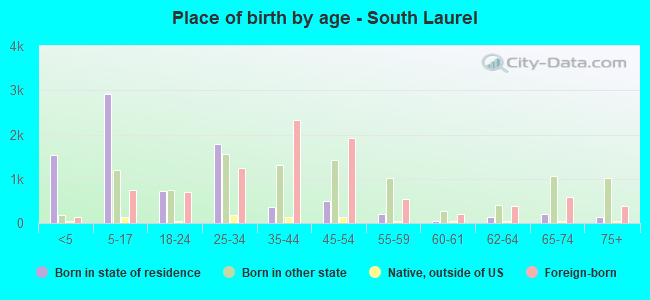
Place of birth - Born in state of residence (%)
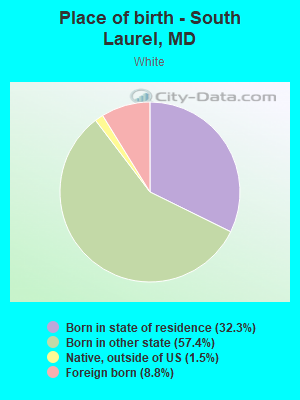
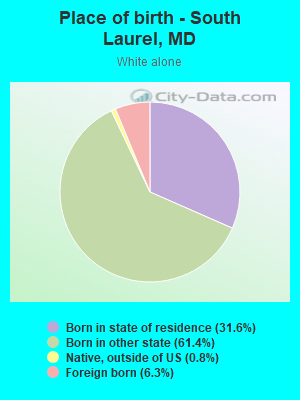
Place of birth - Born in state of residence (%) - White
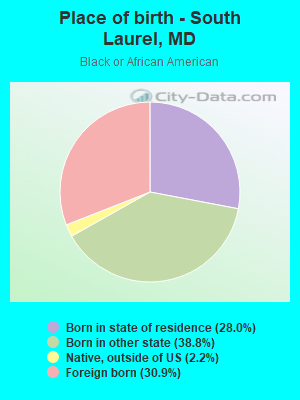
Place of birth - Born in state of residence (%) - Black or African American
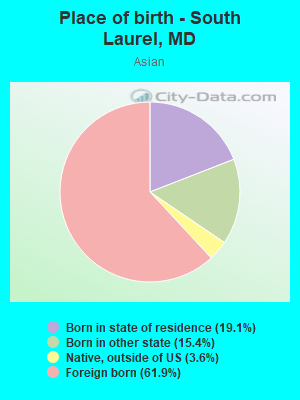
Place of birth - Born in state of residence (%) - Asian
Place of birth - Born in state of residence (%) - Hispanic or Latino
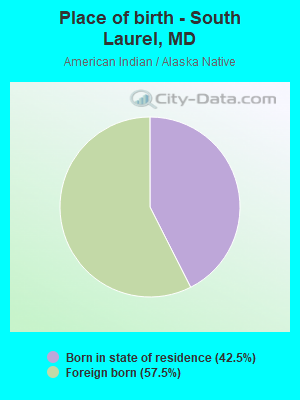
Place of birth - Born in state of residence (%) - American Indian and Alaska Native
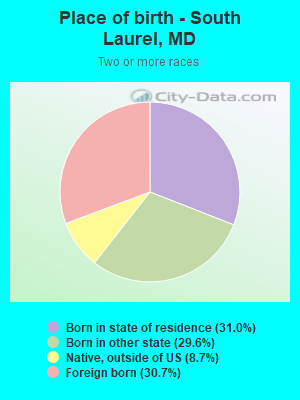
Place of birth - Born in state of residence (%) - Multirace
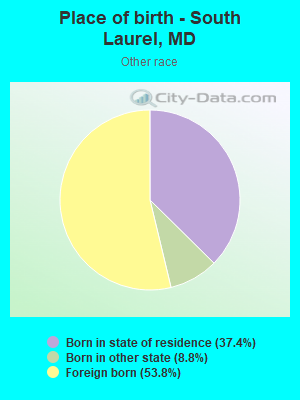
Place of birth - Born in state of residence (%) - Other Race
Place of birth - Born in other state (%)
Place of birth - Born in other state (%) - White
Place of birth - Born in other state (%) - Black or African American
Place of birth - Born in other state (%) - Asian
Place of birth - Born in other state (%) - Hispanic or Latino
Place of birth - Born in other state (%) - American Indian and Alaska Native
Place of birth - Born in other state (%) - Multirace
Place of birth - Born in other state (%) - Other Race
Place of birth - Native, outside of US (%)
Place of birth - Native, outside of US (%) - White
Place of birth - Native, outside of US (%) - Black or African American
Place of birth - Native, outside of US (%) - Asian
Place of birth - Native, outside of US (%) - Hispanic or Latino
Place of birth - Native, outside of US (%) - American Indian and Alaska Native
Place of birth - Native, outside of US (%) - Multirace
Place of birth - Native, outside of US (%) - Other Race
Place of birth - Foreign born (%)
Place of birth - Foreign born (%) - White
Place of birth - Foreign born (%) - Black or African American
Place of birth - Foreign born (%) - Asian
Place of birth - Foreign born (%) - Hispanic or Latino
Place of birth - Foreign born (%) - American Indian and Alaska Native
Place of birth - Foreign born (%) - Multirace
Place of birth - Foreign born (%) - Other Race
Residents speaking English at home (%)
Residents speaking English at home - Born in the United States (%)
Residents speaking English at home - Native, born elsewhere (%)
Residents speaking English at home - Foreign born (%)
Residents speaking Spanish at home (%)
Residents speaking Spanish at home - Born in the United States (%)
Residents speaking Spanish at home - Native, born elsewhere (%)
Residents speaking Spanish at home - Foreign born (%)
Residents speaking other language at home (%)
Residents speaking other language at home - Born in the United States (%)
Residents speaking other language at home - Native, born elsewhere (%)
Residents speaking other language at home - Foreign born (%)
Marital status - Never married (%)
Marital status - Now married (%)
Marital status - Separated (%)
Marital status - Widowed (%)
Marital status - Divorced (%)
Ancestries Reported - Arab (%)
Ancestries Reported - Czech (%)
Ancestries Reported - Danish (%)
Ancestries Reported - Dutch (%)
Ancestries Reported - English (%)
Ancestries Reported - French (%)
Ancestries Reported - French Canadian (%)
Ancestries Reported - German (%)
Ancestries Reported - Greek (%)
Ancestries Reported - Hungarian (%)
Ancestries Reported - Irish (%)
Ancestries Reported - Italian (%)
Ancestries Reported - Lithuanian (%)
Ancestries Reported - Norwegian (%)
Ancestries Reported - Polish (%)
Ancestries Reported - Portuguese (%)
Ancestries Reported - Russian (%)
Ancestries Reported - Scotch-Irish (%)
Ancestries Reported - Scottish (%)
Ancestries Reported - Slovak (%)
Ancestries Reported - Subsaharan African (%)
Ancestries Reported - Swedish (%)
Ancestries Reported - Swiss (%)
Ancestries Reported - Ukrainian (%)
Ancestries Reported - United States (%)
Ancestries Reported - Welsh (%)
Ancestries Reported - West Indian (%)
Ancestries Reported - Other (%)
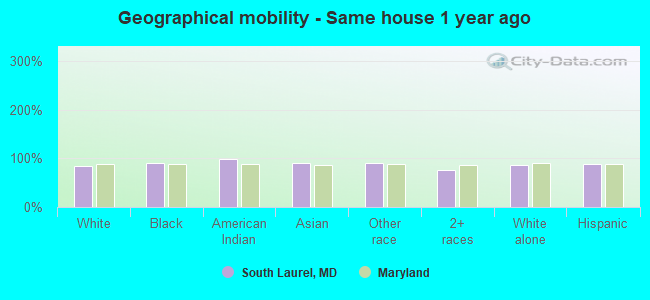
Geographical mobility - Same house 1 year ago (%)
Geographical mobility - Same house 1 year ago (%) - White
Geographical mobility - Same house 1 year ago (%) - Black or African American
Geographical mobility - Same house 1 year ago (%) - Asian
Geographical mobility - Same house 1 year ago (%) - Hispanic or Latino
Geographical mobility - Same house 1 year ago (%) - American Indian and Alaska Native
Geographical mobility - Same house 1 year ago (%) - Multirace
Geographical mobility - Same house 1 year ago (%) - Other Race
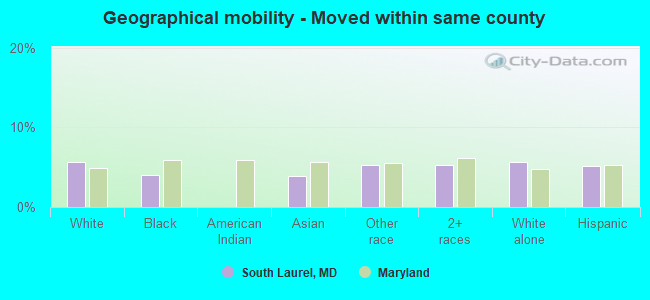
Geographical mobility - Moved within same county (%)
Geographical mobility - Moved within same county (%) - White
Geographical mobility - Moved within same county (%) - Black or African American
Geographical mobility - Moved within same county (%) - Asian
Geographical mobility - Moved within same county (%) - Hispanic or Latino
Geographical mobility - Moved within same county (%) - American Indian and Alaska Native
Geographical mobility - Moved within same county (%) - Multirace
Geographical mobility - Moved within same county (%) - Other Race
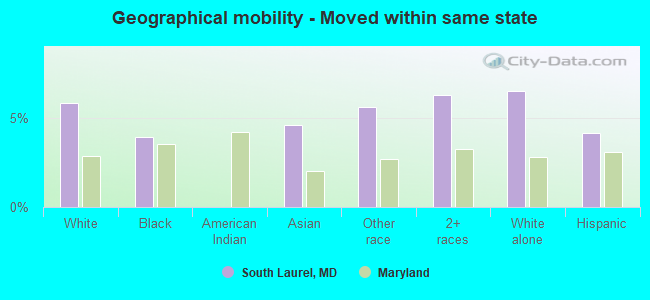
Geographical mobility - Moved from different county within same state (%)
Geographical mobility - Moved from different county within same state (%) - White
Geographical mobility - Moved from different county within same state (%) - Black or African American
Geographical mobility - Moved from different county within same state (%) - Asian
Geographical mobility - Moved from different county within same state (%) - Hispanic or Latino
Geographical mobility - Moved from different county within same state (%) - American Indian and Alaska Native
Geographical mobility - Moved from different county within same state (%) - Multirace
Geographical mobility - Moved from different county within same state (%) - Other Race
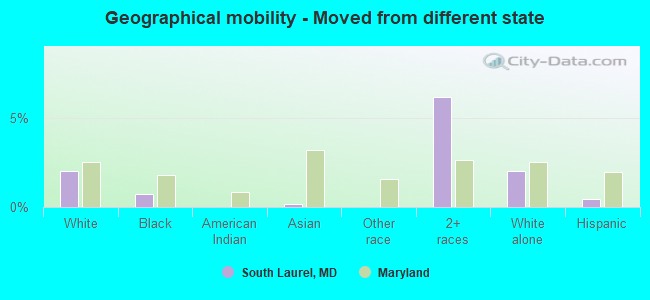
Geographical mobility - Moved from different state (%)
Geographical mobility - Moved from different state (%) - White
Geographical mobility - Moved from different state (%) - Black or African American
Geographical mobility - Moved from different state (%) - Asian
Geographical mobility - Moved from different state (%) - Hispanic or Latino
Geographical mobility - Moved from different state (%) - American Indian and Alaska Native
Geographical mobility - Moved from different state (%) - Multirace
Geographical mobility - Moved from different state (%) - Other Race
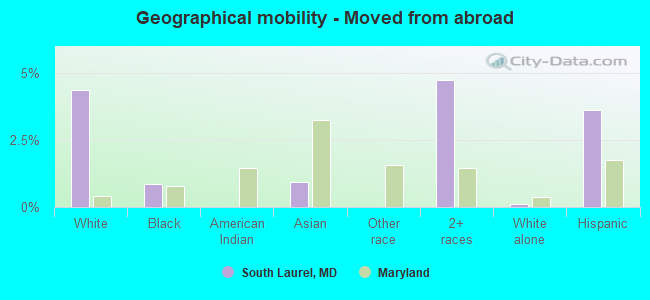
Geographical mobility - Moved from abroad (%)
Geographical mobility - Moved from abroad (%) - White
Geographical mobility - Moved from abroad (%) - Black or African American
Geographical mobility - Moved from abroad (%) - Asian
Geographical mobility - Moved from abroad (%) - Hispanic or Latino
Geographical mobility - Moved from abroad (%) - American Indian and Alaska Native
Geographical mobility - Moved from abroad (%) - Multirace
Geographical mobility - Moved from abroad (%) - Other Race
Place of birth for the foreign-born population - Ireland (%)
Place of birth for the foreign-born population - Denmark (%)
Place of birth for the foreign-born population - Norway (%)
Place of birth for the foreign-born population - Sweden (%)
Place of birth for the foreign-born population - United Kingdom (%)
Place of birth for the foreign-born population - England (%)
Place of birth for the foreign-born population - Scotland (%)
Place of birth for the foreign-born population - Other Northern Europe (%)
Place of birth for the foreign-born population - Austria (%)
Place of birth for the foreign-born population - Belgium (%)
Place of birth for the foreign-born population - France (%)
Place of birth for the foreign-born population - Germany (%)
Place of birth for the foreign-born population - Netherlands (%)
Place of birth for the foreign-born population - Switzerland (%)
Place of birth for the foreign-born population - Other Western Europe (%)
Place of birth for the foreign-born population - Greece (%)
Place of birth for the foreign-born population - Italy (%)
Place of birth for the foreign-born population - Portugal (%)
Place of birth for the foreign-born population - Spain (%)
Place of birth for the foreign-born population - Other Southern Europe (%)
Place of birth for the foreign-born population - Albania (%)
Place of birth for the foreign-born population - Belarus (%)
Place of birth for the foreign-born population - Bosnia and Herzegovina (%)
Place of birth for the foreign-born population - Bulgaria (%)
Place of birth for the foreign-born population - Croatia (%)
Place of birth for the foreign-born population - Czechoslovakia (%)
Place of birth for the foreign-born population - Hungary (%)
Place of birth for the foreign-born population - Latvia (%)
Place of birth for the foreign-born population - Lithuania (%)
Place of birth for the foreign-born population - North Macedonia (Macedonia) (%)
Place of birth for the foreign-born population - Moldova (%)
Place of birth for the foreign-born population - Poland (%)
Place of birth for the foreign-born population - Romania (%)
Place of birth for the foreign-born population - Russia (%)
Place of birth for the foreign-born population - Serbia (%)
Place of birth for the foreign-born population - Ukraine (%)
Place of birth for the foreign-born population - Other Eastern Europe (%)
Place of birth for the foreign-born population - China (%)
Place of birth for the foreign-born population - Hong Kong (%)
Place of birth for the foreign-born population - Taiwan (%)
Place of birth for the foreign-born population - Japan (%)
Place of birth for the foreign-born population - Korea (%)
Place of birth for the foreign-born population - Other Eastern Asia (%)
Place of birth for the foreign-born population - Afghanistan (%)
Place of birth for the foreign-born population - Bangladesh (%)
Place of birth for the foreign-born population - India (%)
Place of birth for the foreign-born population - Iran (%)
Place of birth for the foreign-born population - Kazakhstan (%)
Place of birth for the foreign-born population - Nepal (%)
Place of birth for the foreign-born population - Pakistan (%)
Place of birth for the foreign-born population - Sri Lanka (%)
Place of birth for the foreign-born population - Uzbekistan (%)
Place of birth for the foreign-born population - Other South Central Asia (%)
Place of birth for the foreign-born population - Burma (%)
Place of birth for the foreign-born population - Cambodia (%)
Place of birth for the foreign-born population - Indonesia (%)
Place of birth for the foreign-born population - Laos (%)
Place of birth for the foreign-born population - Malaysia (%)
Place of birth for the foreign-born population - Philippines (%)
Place of birth for the foreign-born population - Singapore (%)
Place of birth for the foreign-born population - Thailand (%)
Place of birth for the foreign-born population - Vietnam (%)
Place of birth for the foreign-born population - Other South Eastern Asia (%)
Place of birth for the foreign-born population - Armenia (%)
Place of birth for the foreign-born population - Iraq (%)
Place of birth for the foreign-born population - Israel (%)
Place of birth for the foreign-born population - Jordan (%)
Place of birth for the foreign-born population - Kuwait (%)
Place of birth for the foreign-born population - Lebanon (%)
Place of birth for the foreign-born population - Saudi Arabia (%)
Place of birth for the foreign-born population - Syria (%)
Place of birth for the foreign-born population - Turkey (%)
Place of birth for the foreign-born population - Yemen (%)
Place of birth for the foreign-born population - Other Western Asia (%)
Place of birth for the foreign-born population - Eritrea (%)
Place of birth for the foreign-born population - Ethiopia (%)
Place of birth for the foreign-born population - Kenya (%)
Place of birth for the foreign-born population - Somalia (%)
Place of birth for the foreign-born population - Uganda (%)
Place of birth for the foreign-born population - Zimbabwe (%)
Place of birth for the foreign-born population - Other Eastern Africa (%)
Place of birth for the foreign-born population - Cameroon (%)
Place of birth for the foreign-born population - Congo (%)
Place of birth for the foreign-born population - Democratic Republic of Congo (Zaire) (%)
Place of birth for the foreign-born population - Other Middle Africa (%)
Place of birth for the foreign-born population - Egypt (%)
Place of birth for the foreign-born population - Morocco (%)
Place of birth for the foreign-born population - Sudan (%)
Place of birth for the foreign-born population - Other Northern Africa (%)
Place of birth for the foreign-born population - South Africa (%)
Place of birth for the foreign-born population - Other Southern Africa (%)
Place of birth for the foreign-born population - Cabo Verde (%)
Place of birth for the foreign-born population - Ghana (%)
Place of birth for the foreign-born population - Liberia (%)
Place of birth for the foreign-born population - Nigeria (%)
Place of birth for the foreign-born population - Senegal (%)
Place of birth for the foreign-born population - Sierra Leone (%)
Place of birth for the foreign-born population - Other Western Africa (%)
Place of birth for the foreign-born population - Australia (%)
Place of birth for the foreign-born population - New Zealand (%)
Place of birth for the foreign-born population - Fiji (%)
Place of birth for the foreign-born population - Micronesia (%)
Place of birth for the foreign-born population - Bahamas (%)
Place of birth for the foreign-born population - Barbados (%)
Place of birth for the foreign-born population - Cuba (%)
Place of birth for the foreign-born population - Dominica (%)
Place of birth for the foreign-born population - Dominican Republic (%)
Place of birth for the foreign-born population - Grenada (%)
Place of birth for the foreign-born population - Haiti (%)
Place of birth for the foreign-born population - Jamaica (%)
Place of birth for the foreign-born population - St. Vincent and the Grenadines (%)
Place of birth for the foreign-born population - Trinidad and Tobago (%)
Place of birth for the foreign-born population - West Indies (%)
Place of birth for the foreign-born population - Other Caribbean (%)
Place of birth for the foreign-born population - Belize (%)
Place of birth for the foreign-born population - Costa Rica (%)
Place of birth for the foreign-born population - El Salvador (%)
Place of birth for the foreign-born population - Guatemala (%)
Place of birth for the foreign-born population - Honduras (%)
Place of birth for the foreign-born population - Mexico (%)
Place of birth for the foreign-born population - Nicaragua (%)
Place of birth for the foreign-born population - Panama (%)
Place of birth for the foreign-born population - Other Central America (%)
Place of birth for the foreign-born population - Argentina (%)
Place of birth for the foreign-born population - Bolivia (%)
Place of birth for the foreign-born population - Brazil (%)
Place of birth for the foreign-born population - Chile (%)
Place of birth for the foreign-born population - Colombia (%)
Place of birth for the foreign-born population - Ecuador (%)
Place of birth for the foreign-born population - Guyana (%)
Place of birth for the foreign-born population - Peru (%)
Place of birth for the foreign-born population - Uruguay (%)
Place of birth for the foreign-born population - Venezuela (%)
Place of birth for the foreign-born population - Other South America (%)
Place of birth for the foreign-born population - Canada (%)
Place of birth for the foreign-born population - Other Northern America (%)
Place of birth for the foreign-born population - Other (%)
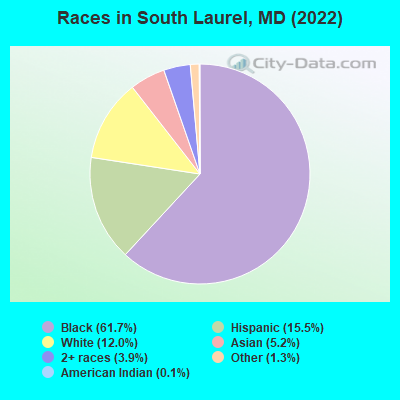
According to 2022 data, the most numerous races in South Laurel, MD are White alone (3,380 residents), Black alone (17,341 residents), and Hispanic (4,353 residents). 67.3% of South Laurel residents speak English at home. 32.0% of South Laurel, MD residents are foreign-born (12.9% born in Africa, 12.6% born in Latin America, 3.6% born in Asia), which is 50.0% greater than the foreign-born rate of 16.0% across the entire state of Maryland.
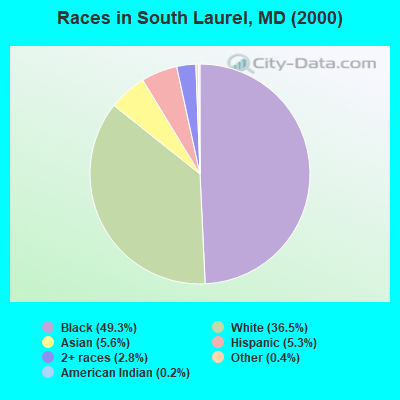
Race distribution in South Laurel
2000 2022
3,286,547 62.1% White alone 1,464,735 27.7% Black alone 227,916 4.3% Hispanic 209,738 4.0% Asian alone 82,946 1.6% Two or more races 13,312 0.3% American Indian alone 9,379 0.2% Other race alone 1,913 0.04% Native Hawaiian and Other
2,906,492 47.1% White alone 1,800,914 29.2% Black alone 705,842 11.4% Hispanic 401,818 6.5% Asian alone 291,317 4.7% Two or more races 46,930 0.8% Other race alone 8,930 0.1% American Indian alone 2,417 0.04% Native Hawaiian and Other
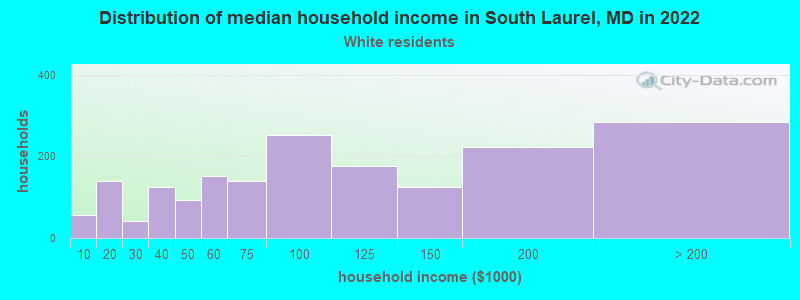
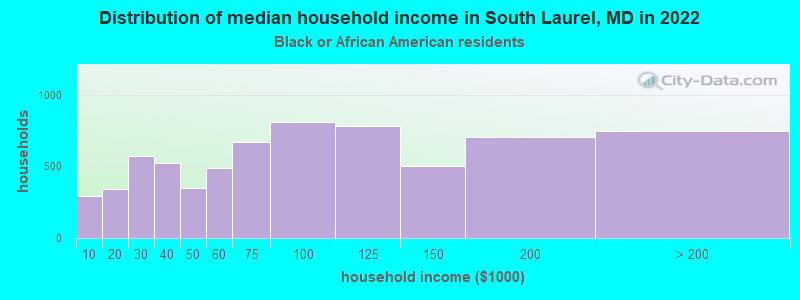
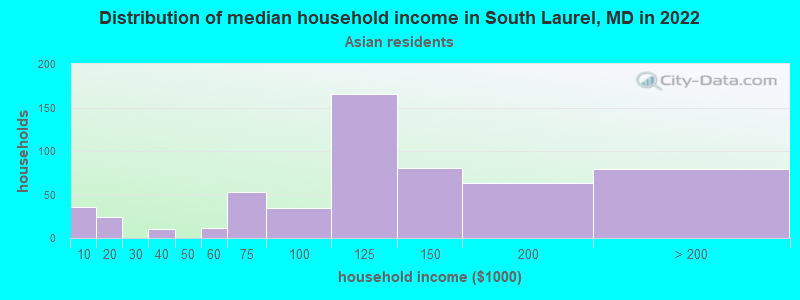
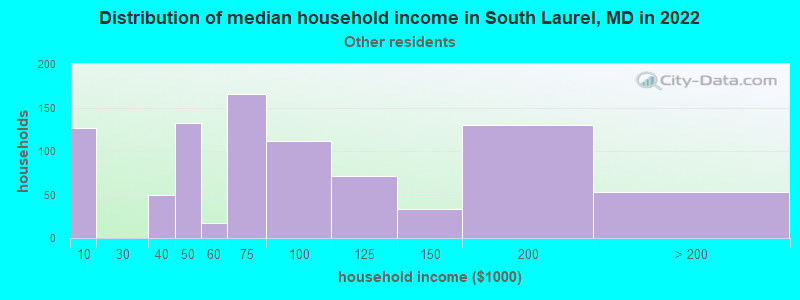
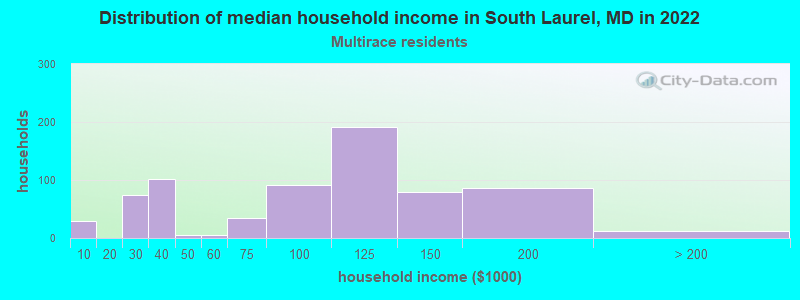
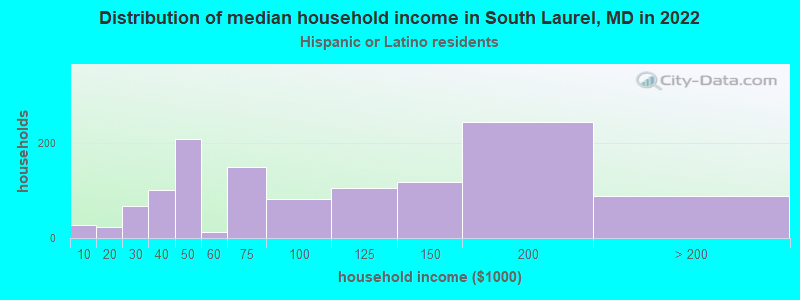
Income and house value in South Laurel Median household income in 2022 $89,266 White non-Hispanic householders$77,167 Black householders$95,218 Asian householders$71,797 Some other race householders$95,469 Two or more races householders$94,655 Hispanic or Latino race householdersMedian 2022 house value $471,493 White Non-Hispanic householders$465,340 Black or African American householders $430,664 Asian householders$314,608 Some other race householders$435,138 Hispanic or Latino householders
Median age by race in South Laurel
50.2 Median age for White residents51.2 49.8 35.8 Median age for Black or African American residents36.9 35.2 49.5 Median age for American Indian / Alaska Native residents-888,297,871.5 16.1 43.8 Median age for Asian residents37.0 46.2 -571,600,480.8 Median age for Native Hawaiian / Pacific Islander residents-720,061,021.4 -760,942,760.2 30.3 Median age for Other race residents29.4 31.3 31.7 Median age for Two or more races residents28.7 32.7 54.7 Median age for White alone residents52.5 60.1 31.1 Median age for Hispanic or Latino residents31.6 31.2
Owner/renter occupied households by race in South Laurel
House owners and renters - White residents 1,086 57.9% Owner occupied790 42.1% Renter occupiedHouse owners and renters - Black or African American residents 2,216 32.3% Owner occupied4,642 67.7% Renter occupiedHouse owners and renters - American Indian / Alaska Native residents 19 100.0% Owner occupiedHouse owners and renters - Asian residents 470 75.2% Owner occupied155 24.8% Renter occupiedHouse owners and renters - Other race residents 244 27.3% Owner occupied650 72.7% Renter occupiedHouse owners and renters - Two or more races residents 356 50.5% Owner occupied349 49.5% Renter occupiedHouse owners and renters - White alone residents 1,048 61.7% Owner occupied651 38.3% Renter occupiedHouse owners and renters - Hispanic or Latino residents 433 35.9% Owner occupied775 64.1% Renter occupied
Language usage in South Laurel
English speakers - Total 67.3% of residents of South Laurel speak English at home.
13.9% of residents speak Spanish at home 1,897 52.1% Speak English very well1,746 47.9% Speak English less than very well20.0% of residents speak other language at home 4,313 82.2% Speak English very well936 17.8% Speak English less than very well
English speakers - Born in the United States 90.9% of residents of South Laurel speak English at home.
3.2% of residents speak Spanish at home 258 80.1% Speak English very well64 19.9% Speak English less than very well6.6% of residents speak other language at home 599 89.8% Speak English very well68 10.2% Speak English less than very well
English speakers - Native, born elsewhere 78.9% of residents of South Laurel speak English at home.
24.4% of residents speak Spanish at home 13 8.5% Speak English very well140 91.5% Speak English less than very well11.0% of residents speak other language at home 3 4.3% Speak English very well66 95.7% Speak English less than very well
English speakers - Foreign-born 28.3% of residents of South Laurel speak English at home.
25.3% of residents speak Spanish at home 744 32.7% Speak English very well1,528 67.3% Speak English less than very well48.5% of residents speak other language at home 3,544 81.4% Speak English very well812 18.6% Speak English less than very well
White (Caucasian) - Speak only English Native:
92.7% (3,122)Foreign-born:
13.2% (43)
White (Caucasian) - Speak another language Native:
7.5% (253)Foreign-born:
82.5% (266)
Black or African American - Speak only English Native:
94.7% (10,771)Foreign-born:
39.1% (2,148)
Black or African American - Speak another language Native:
5.5% (627)Foreign-born:
60.7% (3,331)
American Indian / Alaska Native - Speak another language Native:
100.0% (20)Foreign-born:
99.9% (127)
Asian - Speak only English Native:
43.1% (229)Foreign-born:
19.3% (176)
Asian - Speak another language Native:
55.0% (292)Foreign-born:
81.7% (747)
Other race - Speak only English Native:
32.2% (342)Foreign-born:
3.9% (65)
Other race - Speak another language Native:
70.1% (745)Foreign-born:
96.0% (1,604)
Two or more races - Speak only English Native:
72.2% (806)Foreign-born:
20.0% (121)
Two or more races - Speak another language Native:
28.4% (316)Foreign-born:
80.2% (486)
White alone - Speak only English Native:
95.4% (2,944)Foreign-born:
23.2% (48)
White alone - Speak another language Native:
4.4% (136)Foreign-born:
76.3% (156)
Hispanic or Latino - Speak only English Native:
31.2% (473)Foreign-born:
2.6% (62)
Hispanic or Latino - Speak another language Native:
69.5% (1,053)Foreign-born:
97.6% (2,286)
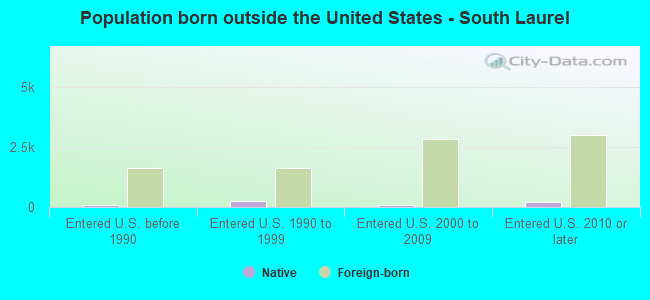
Foreign-born residents in South Laurel 8,992 residents are foreign born (12.9% Africa , 12.6% Latin America , 3.6% Asia ).
This city:
32.0%Maryland:
15.7%
Marital status for residents in South Laurel Marital status - White (Caucasian) population 15 years and over
Males 30.8% Never married49.6% Now married5.8% Separated2.9% Widowed10.9% DivorcedFemales 32.9% Never married40.0% Now married1.8% Separated13.9% Widowed11.4% DivorcedWomen who gave birth in the past 12 months Now married:
26.3% (13)Unmarried:
73.7% (36)
Women who did not give birth in the past 12 months Now married:
30.4% (202)Unmarried:
69.6% (462)
Marital status - Black or African American population 15 years and over
Males 33.3% Never married45.5% Now married3.4% Separated0.6% Widowed17.2% DivorcedFemales 47.8% Never married27.8% Now married5.4% Separated7.0% Widowed12.0% DivorcedWomen who gave birth in the past 12 months Now married:
88.8% (141)Unmarried:
11.2% (18)
Women who did not give birth in the past 12 months Now married:
29.5% (1,488)Unmarried:
70.5% (3,562)
Marital status - American Indian / Alaska Native population 15 years and over
Males 0.0% Never married0.0% Now married0.0% Separated0.0% Widowed100.0% DivorcedFemales 53.8% Never married46.2% Now married0.0% Separated0.0% Widowed0.0% DivorcedWomen who gave birth in the past 12 months Now married:
0.0% (0)Unmarried:
100.0% (19)
Women who did not give birth in the past 12 months Now married:
61.5% (36)Unmarried:
38.5% (22)
Marital status - Asian population 15 years and over
Males 40.6% Never married56.5% Now married0.0% Separated0.0% Widowed2.9% DivorcedFemales 21.4% Never married60.1% Now married0.0% Separated9.4% Widowed9.1% DivorcedWomen who gave birth in the past 12 months Now married:
100.0% (13)Unmarried:
0.0% (0)
Women who did not give birth in the past 12 months Now married:
52.8% (170)Unmarried:
47.2% (151)
Marital status - Other race population 15 years and over
Males 38.8% Never married40.8% Now married3.2% Separated0.0% Widowed17.2% DivorcedFemales 41.7% Never married49.0% Now married3.1% Separated0.8% Widowed5.3% DivorcedWomen who gave birth in the past 12 months Now married:
67.9% (40)Unmarried:
32.1% (19)
Women who did not give birth in the past 12 months Now married:
44.9% (341)Unmarried:
55.1% (418)
Marital status - Two or more races population 15 years and over
Males 39.8% Never married54.9% Now married0.0% Separated3.4% Widowed1.9% DivorcedFemales 28.5% Never married49.2% Now married2.1% Separated0.8% Widowed19.5% DivorcedWomen who gave birth in the past 12 months Now married:
23.1% (16)Unmarried:
76.9% (54)
Women who did not give birth in the past 12 months Now married:
59.5% (194)Unmarried:
40.5% (132)
Marital status - White alone, not Hispanic / Latino population 15 years and over
Males 27.8% Never married50.0% Now married6.6% Separated3.3% Widowed12.3% DivorcedFemales 29.1% Never married42.7% Now married0.5% Separated16.4% Widowed11.4% DivorcedWomen who gave birth in the past 12 months Now married:
15.2% (5)Unmarried:
84.8% (27)
Women who did not give birth in the past 12 months Now married:
31.7% (170)Unmarried:
68.3% (367)
Marital status - Hispanic or Latino population 15 years and over
Males 41.8% Never married43.3% Now married2.5% Separated0.8% Widowed11.6% DivorcedFemales 42.2% Never married44.6% Now married4.6% Separated1.5% Widowed7.0% DivorcedWomen who gave birth in the past 12 months Now married:
56.9% (60)Unmarried:
43.1% (45)
Women who did not give birth in the past 12 months Now married:
48.0% (482)Unmarried:
52.0% (522)
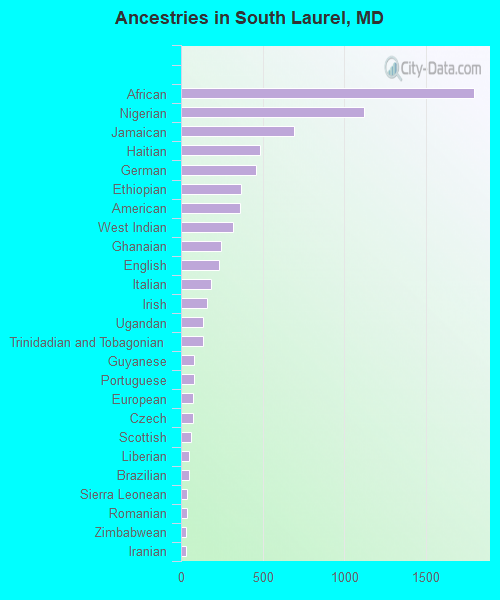
Ancestries in South Laurel
1,797 9.3% African1,124 5.8% Nigerian693 3.6% Jamaican485 2.5% Haitian458 2.4% German370 1.9% Ethiopian359 1.9% American320 1.7% West Indian247 1.3% Ghanaian235 1.2% English181 0.9% Italian158 0.8% Irish134 0.7% Ugandan133 0.7% Trinidadian and Tobagonian81 0.4% Guyanese79 0.4% Portuguese75 0.4% European73 0.4% Czech62 0.3% Scottish51 0.3% Liberian50 0.3% Brazilian36 0.2% Sierra Leonean35 0.2% Romanian33 0.2% Zimbabwean31 0.2% Iranian22 0.1% Scotch-Irish22 0.1% Polish21 0.1% Norwegian20 0.1% U.S. Virgin Islander18 0.09% Egyptian15 0.08% French14 0.07% Russian12 0.06% Dutch11 0.06% Finnish10 0.05% Greek10 0.05% Swedish9 0.05% British8 0.04% Kenyan4 0.02% Eastern European3 0.02% Lithuanian
Geographical mobility in South Laurel Same house 1 year ago 3,138 84.2% White (Caucasian)15,838 91.4% Black or African American155 98.9% American Indian / Alaska Native1,357 91.0% Asian2,770 90.0% Other race1,455 77.0% Two or more races2,870 86.0% White alone, not Hispanic / Latino3,786 88.3% Hispanic or LatinoMoved within same county 210 5.6% White / Caucasian701 4.0% Black or African American58 3.9% Asian163 5.3% Other race99 5.2% Two or more races186 5.6% White alone, not Hispanic / Latino219 5.1% Hispanic or LatinoMoved within same state 217 5.8% White / Caucasian679 3.9% Black or African American68 4.6% Asian173 5.6% Other race118 6.3% Two or more races217 6.5% White alone, not Hispanic / Latino177 4.1% Hispanic or LatinoMoved from different state 75 2.0% White / Caucasian121 0.7% Black or African American2 0.2% Asian117 6.2% Two or more races68 2.0% White alone, not Hispanic / Latino19 0.5% Hispanic or LatinoMoved from abroad 162 4.3% White150 0.9% Black or African American14 0.9% Asian89 4.7% Two or more races3 0.1% White alone, not Hispanic / Latino155 3.6% Hispanic or Latino
Children Nativity (place of birth) in South Laurel
Children under 6 years - Living with two parents Both parents native 171 100.0% NativeBoth parents foreign-born 431 84.1% Native81 15.9% Foreign-bornOne native, one foreign-born parent 335 100.0% NativeChildren under 6 years - Living with one parent Native parent 449 99.9% Native0 0.1% Foreign-bornForeign-born parent 599 90.5% Native63 9.5% Foreign-bornChildren 6 to 17 years - Living with two parents Both parents native 478 99.8% Native1 0.2% Foreign-bornBoth parents foreign-born 603 72.0% Native234 28.0% Foreign-bornOne native, one foreign-born parent 473 100.0% NativeChildren 6 to 17 years - Living with one parent Native parent 1,282 100.0% NativeForeign-born parent 704 59.9% Native472 40.1% Foreign-born
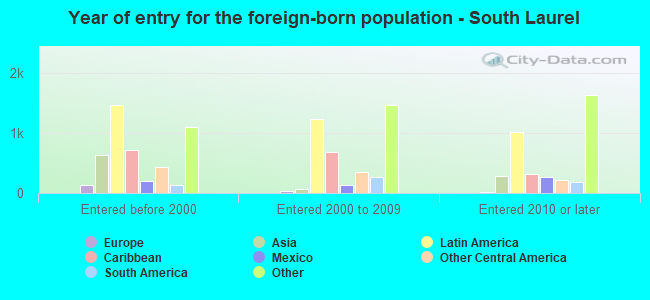
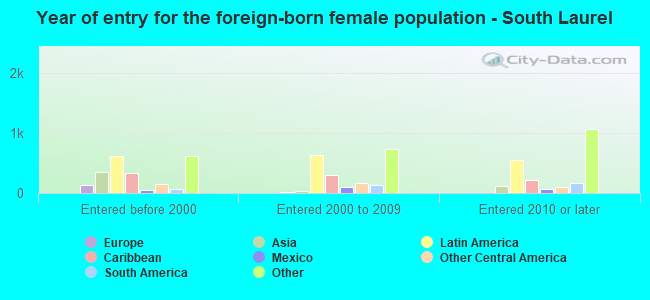
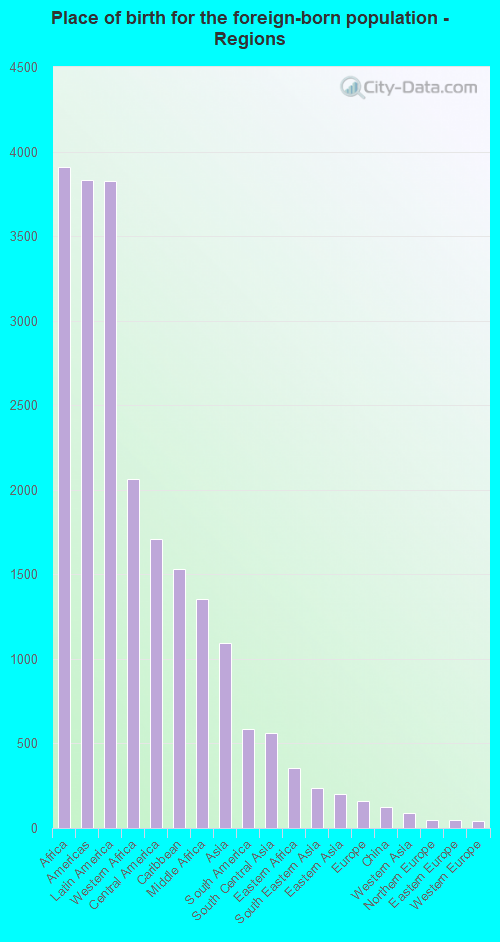
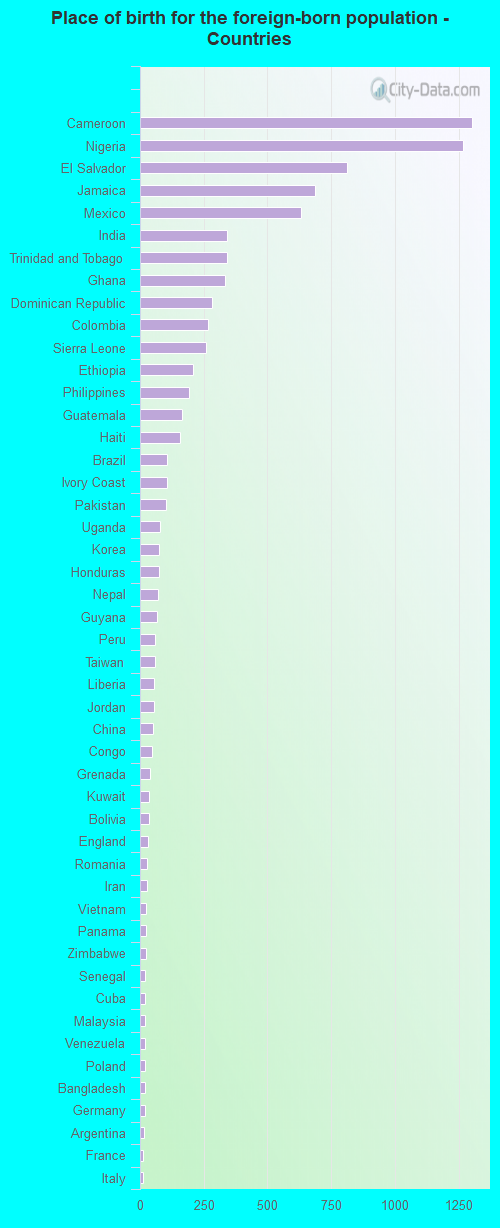
Place of birth for residents in South Laurel 3,906 Africa3,832 Americas3,828 Latin America2,065 Western Africa1,709 Central America1,532 Caribbean1,353 Middle Africa1,093 Asia586 South America563 South Central Asia354 Eastern Africa237 South Eastern Asia200 Eastern Asia159 Europe122 China91 Western Asia45 Northern Europe45 Eastern Europe42 Western Europe25 Southern Europe10 Southern Africa6 Northern Africa4 Northern America1,304 Cameroon1,269 Nigeria811 El Salvador687 Jamaica632 Mexico342 India341 Trinidad and Tobago332 Ghana284 Dominican Republic267 Colombia259 Sierra Leone209 Ethiopia191 Philippines166 Guatemala155 Haiti107 Brazil105 Ivory Coast102 Pakistan77 Uganda74 Korea73 Honduras72 Nepal65 Guyana59 Peru58 Taiwan54 Liberia54 Jordan52 China49 Congo38 Grenada37 Kuwait34 Bolivia30 England26 Romania26 Iran25 Vietnam25 Panama24 Zimbabwe21 Senegal20 Cuba20 Malaysia20 Venezuela19 Poland19 Bangladesh18 Germany14 Argentina13 France13 Italy11 Hong Kong11 Greece10 Netherlands10 Eritrea10 South Africa8 Ireland7 Kenya6 United Kingdom6 Egypt4 Canada3 Japan
Grandparents responsible for own grandchildren in South Laurel
Grandparents (30 to 59 years) Black or African American 19 21.0% Responsible for grandchildren71 79.0% Not responsible for grandchildrenOther race 38 100.0% Not responsible for grandchildrenHispanic or Latino 40 100.0% Not responsible for grandchildren
Grandparents (60 years and over) Black or African American 78 100.0% Not responsible for grandchildrenOther race 25 100.0% Not responsible for grandchildrenHispanic or Latino 77 100.0% Not responsible for grandchildren