Races in South Miami, Florida (FL) Detailed Stats
Data:
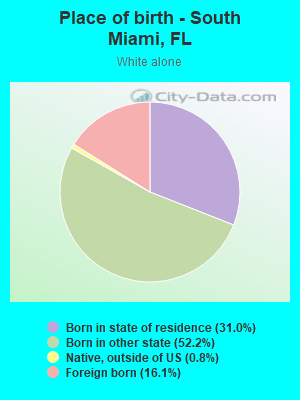
Races - White alone (%)
Races - White alone (% change since 2000)
Races - Black alone (%)
Races - Black alone (% change since 2000)
Races - American Indian alone (%)
Races - American Indian alone (% change since 2000)
Races - Asian alone (%)
Races - Asian alone (% change since 2000)
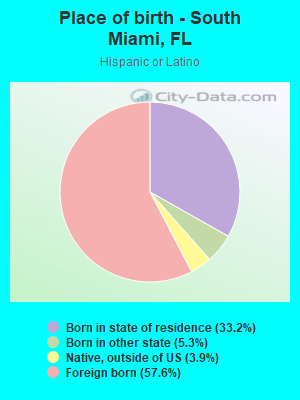
Races - Hispanic (%)
Races - Hispanic (% change since 2000)
Races - Native Hawaiian and Other Pacific Islander alone (%)
Races - Native Hawaiian and Other Pacific Islander alone (% change since 2000)
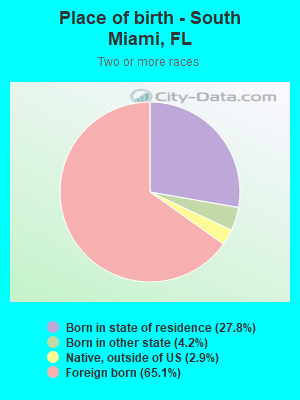
Races - Two or more races(%)
Races - Two or more races(% change since 2000)
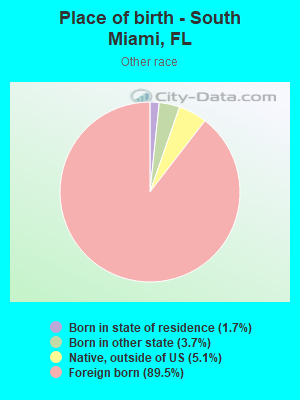
Races - Other race alone (%)
Races - Other race alone (% change since 2000)
Racial diversity
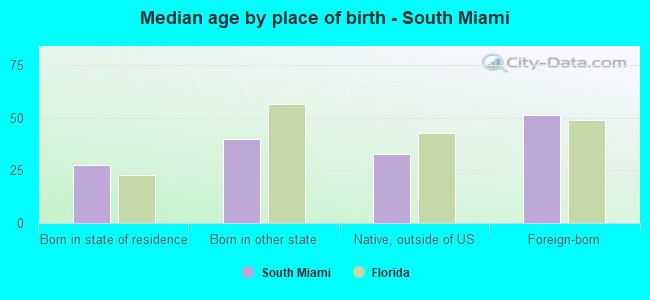
Place of birth - Born in state of residence (%)
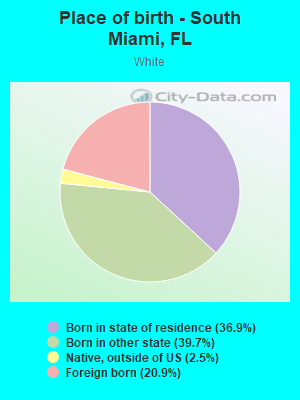
Place of birth - Born in state of residence (%) - White
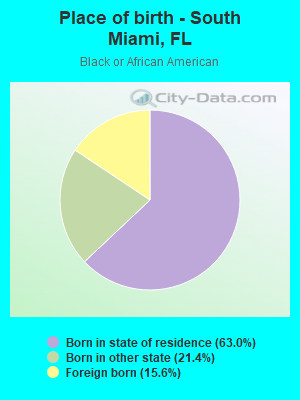
Place of birth - Born in state of residence (%) - Black or African American
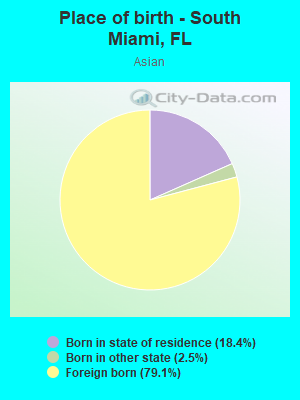
Place of birth - Born in state of residence (%) - Asian
Place of birth - Born in state of residence (%) - Hispanic or Latino
Place of birth - Born in state of residence (%) - American Indian and Alaska Native
Place of birth - Born in state of residence (%) - Multirace
Place of birth - Born in state of residence (%) - Other Race
Place of birth - Born in other state (%)
Place of birth - Born in other state (%) - White
Place of birth - Born in other state (%) - Black or African American
Place of birth - Born in other state (%) - Asian
Place of birth - Born in other state (%) - Hispanic or Latino
Place of birth - Born in other state (%) - American Indian and Alaska Native
Place of birth - Born in other state (%) - Multirace
Place of birth - Born in other state (%) - Other Race
Place of birth - Native, outside of US (%)
Place of birth - Native, outside of US (%) - White
Place of birth - Native, outside of US (%) - Black or African American
Place of birth - Native, outside of US (%) - Asian
Place of birth - Native, outside of US (%) - Hispanic or Latino
Place of birth - Native, outside of US (%) - American Indian and Alaska Native
Place of birth - Native, outside of US (%) - Multirace
Place of birth - Native, outside of US (%) - Other Race
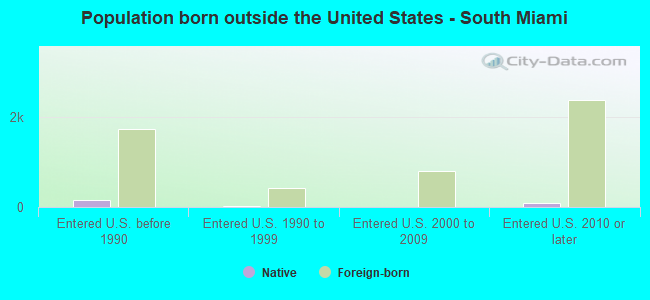
Place of birth - Foreign born (%)
Place of birth - Foreign born (%) - White
Place of birth - Foreign born (%) - Black or African American
Place of birth - Foreign born (%) - Asian
Place of birth - Foreign born (%) - Hispanic or Latino
Place of birth - Foreign born (%) - American Indian and Alaska Native
Place of birth - Foreign born (%) - Multirace
Place of birth - Foreign born (%) - Other Race
Residents speaking English at home (%)
Residents speaking English at home - Born in the United States (%)
Residents speaking English at home - Native, born elsewhere (%)
Residents speaking English at home - Foreign born (%)
Residents speaking Spanish at home (%)
Residents speaking Spanish at home - Born in the United States (%)
Residents speaking Spanish at home - Native, born elsewhere (%)
Residents speaking Spanish at home - Foreign born (%)
Residents speaking other language at home (%)
Residents speaking other language at home - Born in the United States (%)
Residents speaking other language at home - Native, born elsewhere (%)
Residents speaking other language at home - Foreign born (%)
Marital status - Never married (%)
Marital status - Now married (%)
Marital status - Separated (%)
Marital status - Widowed (%)
Marital status - Divorced (%)
Ancestries Reported - Arab (%)
Ancestries Reported - Czech (%)
Ancestries Reported - Danish (%)
Ancestries Reported - Dutch (%)
Ancestries Reported - English (%)
Ancestries Reported - French (%)
Ancestries Reported - French Canadian (%)
Ancestries Reported - German (%)
Ancestries Reported - Greek (%)
Ancestries Reported - Hungarian (%)
Ancestries Reported - Irish (%)
Ancestries Reported - Italian (%)
Ancestries Reported - Lithuanian (%)
Ancestries Reported - Norwegian (%)
Ancestries Reported - Polish (%)
Ancestries Reported - Portuguese (%)
Ancestries Reported - Russian (%)
Ancestries Reported - Scotch-Irish (%)
Ancestries Reported - Scottish (%)
Ancestries Reported - Slovak (%)
Ancestries Reported - Subsaharan African (%)
Ancestries Reported - Swedish (%)
Ancestries Reported - Swiss (%)
Ancestries Reported - Ukrainian (%)
Ancestries Reported - United States (%)
Ancestries Reported - Welsh (%)
Ancestries Reported - West Indian (%)
Ancestries Reported - Other (%)
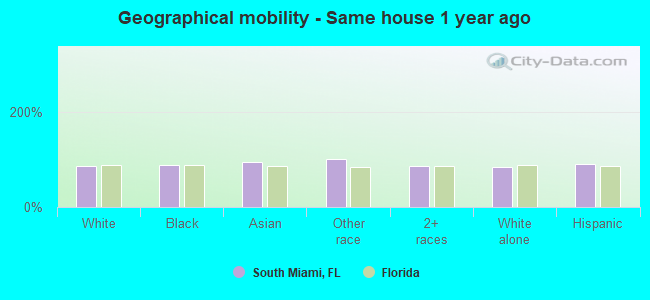
Geographical mobility - Same house 1 year ago (%)
Geographical mobility - Same house 1 year ago (%) - White
Geographical mobility - Same house 1 year ago (%) - Black or African American
Geographical mobility - Same house 1 year ago (%) - Asian
Geographical mobility - Same house 1 year ago (%) - Hispanic or Latino
Geographical mobility - Same house 1 year ago (%) - American Indian and Alaska Native
Geographical mobility - Same house 1 year ago (%) - Multirace
Geographical mobility - Same house 1 year ago (%) - Other Race
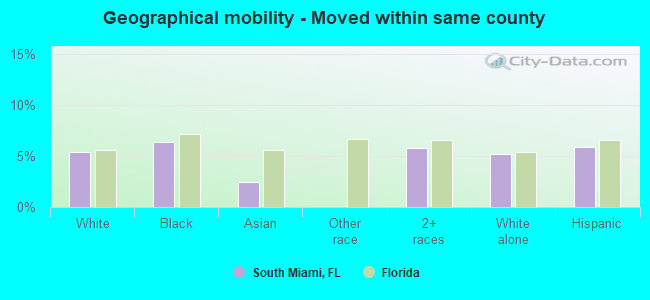
Geographical mobility - Moved within same county (%)
Geographical mobility - Moved within same county (%) - White
Geographical mobility - Moved within same county (%) - Black or African American
Geographical mobility - Moved within same county (%) - Asian
Geographical mobility - Moved within same county (%) - Hispanic or Latino
Geographical mobility - Moved within same county (%) - American Indian and Alaska Native
Geographical mobility - Moved within same county (%) - Multirace
Geographical mobility - Moved within same county (%) - Other Race
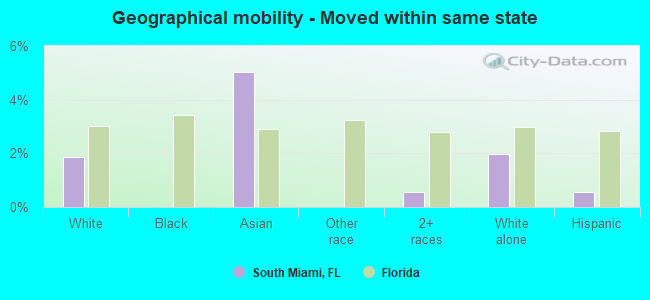
Geographical mobility - Moved from different county within same state (%)
Geographical mobility - Moved from different county within same state (%) - White
Geographical mobility - Moved from different county within same state (%) - Black or African American
Geographical mobility - Moved from different county within same state (%) - Asian
Geographical mobility - Moved from different county within same state (%) - Hispanic or Latino
Geographical mobility - Moved from different county within same state (%) - American Indian and Alaska Native
Geographical mobility - Moved from different county within same state (%) - Multirace
Geographical mobility - Moved from different county within same state (%) - Other Race
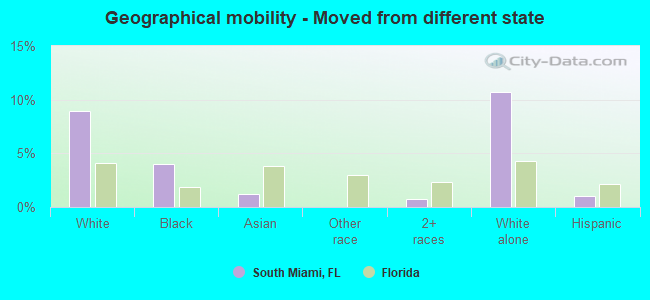
Geographical mobility - Moved from different state (%)
Geographical mobility - Moved from different state (%) - White
Geographical mobility - Moved from different state (%) - Black or African American
Geographical mobility - Moved from different state (%) - Asian
Geographical mobility - Moved from different state (%) - Hispanic or Latino
Geographical mobility - Moved from different state (%) - American Indian and Alaska Native
Geographical mobility - Moved from different state (%) - Multirace
Geographical mobility - Moved from different state (%) - Other Race
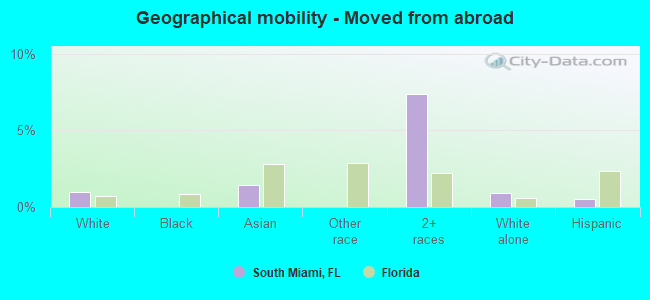
Geographical mobility - Moved from abroad (%)
Geographical mobility - Moved from abroad (%) - White
Geographical mobility - Moved from abroad (%) - Black or African American
Geographical mobility - Moved from abroad (%) - Asian
Geographical mobility - Moved from abroad (%) - Hispanic or Latino
Geographical mobility - Moved from abroad (%) - American Indian and Alaska Native
Geographical mobility - Moved from abroad (%) - Multirace
Geographical mobility - Moved from abroad (%) - Other Race
Place of birth for the foreign-born population - Ireland (%)
Place of birth for the foreign-born population - Denmark (%)
Place of birth for the foreign-born population - Norway (%)
Place of birth for the foreign-born population - Sweden (%)
Place of birth for the foreign-born population - United Kingdom (%)
Place of birth for the foreign-born population - England (%)
Place of birth for the foreign-born population - Scotland (%)
Place of birth for the foreign-born population - Other Northern Europe (%)
Place of birth for the foreign-born population - Austria (%)
Place of birth for the foreign-born population - Belgium (%)
Place of birth for the foreign-born population - France (%)
Place of birth for the foreign-born population - Germany (%)
Place of birth for the foreign-born population - Netherlands (%)
Place of birth for the foreign-born population - Switzerland (%)
Place of birth for the foreign-born population - Other Western Europe (%)
Place of birth for the foreign-born population - Greece (%)
Place of birth for the foreign-born population - Italy (%)
Place of birth for the foreign-born population - Portugal (%)
Place of birth for the foreign-born population - Spain (%)
Place of birth for the foreign-born population - Other Southern Europe (%)
Place of birth for the foreign-born population - Albania (%)
Place of birth for the foreign-born population - Belarus (%)
Place of birth for the foreign-born population - Bosnia and Herzegovina (%)
Place of birth for the foreign-born population - Bulgaria (%)
Place of birth for the foreign-born population - Croatia (%)
Place of birth for the foreign-born population - Czechoslovakia (%)
Place of birth for the foreign-born population - Hungary (%)
Place of birth for the foreign-born population - Latvia (%)
Place of birth for the foreign-born population - Lithuania (%)
Place of birth for the foreign-born population - North Macedonia (Macedonia) (%)
Place of birth for the foreign-born population - Moldova (%)
Place of birth for the foreign-born population - Poland (%)
Place of birth for the foreign-born population - Romania (%)
Place of birth for the foreign-born population - Russia (%)
Place of birth for the foreign-born population - Serbia (%)
Place of birth for the foreign-born population - Ukraine (%)
Place of birth for the foreign-born population - Other Eastern Europe (%)
Place of birth for the foreign-born population - China (%)
Place of birth for the foreign-born population - Hong Kong (%)
Place of birth for the foreign-born population - Taiwan (%)
Place of birth for the foreign-born population - Japan (%)
Place of birth for the foreign-born population - Korea (%)
Place of birth for the foreign-born population - Other Eastern Asia (%)
Place of birth for the foreign-born population - Afghanistan (%)
Place of birth for the foreign-born population - Bangladesh (%)
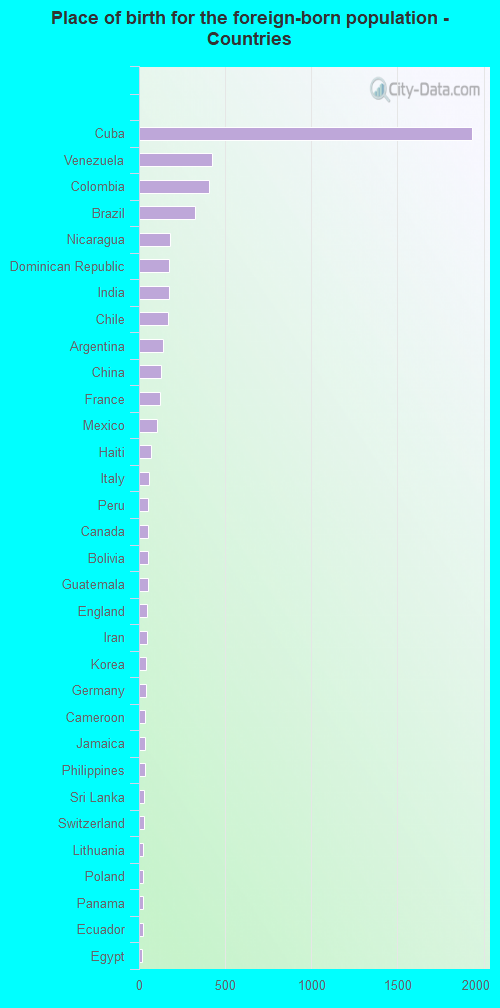
Place of birth for the foreign-born population - India (%)
Place of birth for the foreign-born population - Iran (%)
Place of birth for the foreign-born population - Kazakhstan (%)
Place of birth for the foreign-born population - Nepal (%)
Place of birth for the foreign-born population - Pakistan (%)
Place of birth for the foreign-born population - Sri Lanka (%)
Place of birth for the foreign-born population - Uzbekistan (%)
Place of birth for the foreign-born population - Other South Central Asia (%)
Place of birth for the foreign-born population - Burma (%)
Place of birth for the foreign-born population - Cambodia (%)
Place of birth for the foreign-born population - Indonesia (%)
Place of birth for the foreign-born population - Laos (%)
Place of birth for the foreign-born population - Malaysia (%)
Place of birth for the foreign-born population - Philippines (%)
Place of birth for the foreign-born population - Singapore (%)
Place of birth for the foreign-born population - Thailand (%)
Place of birth for the foreign-born population - Vietnam (%)
Place of birth for the foreign-born population - Other South Eastern Asia (%)
Place of birth for the foreign-born population - Armenia (%)
Place of birth for the foreign-born population - Iraq (%)
Place of birth for the foreign-born population - Israel (%)
Place of birth for the foreign-born population - Jordan (%)
Place of birth for the foreign-born population - Kuwait (%)
Place of birth for the foreign-born population - Lebanon (%)
Place of birth for the foreign-born population - Saudi Arabia (%)
Place of birth for the foreign-born population - Syria (%)
Place of birth for the foreign-born population - Turkey (%)
Place of birth for the foreign-born population - Yemen (%)
Place of birth for the foreign-born population - Other Western Asia (%)
Place of birth for the foreign-born population - Eritrea (%)
Place of birth for the foreign-born population - Ethiopia (%)
Place of birth for the foreign-born population - Kenya (%)
Place of birth for the foreign-born population - Somalia (%)
Place of birth for the foreign-born population - Uganda (%)
Place of birth for the foreign-born population - Zimbabwe (%)
Place of birth for the foreign-born population - Other Eastern Africa (%)
Place of birth for the foreign-born population - Cameroon (%)
Place of birth for the foreign-born population - Congo (%)
Place of birth for the foreign-born population - Democratic Republic of Congo (Zaire) (%)
Place of birth for the foreign-born population - Other Middle Africa (%)
Place of birth for the foreign-born population - Egypt (%)
Place of birth for the foreign-born population - Morocco (%)
Place of birth for the foreign-born population - Sudan (%)
Place of birth for the foreign-born population - Other Northern Africa (%)
Place of birth for the foreign-born population - South Africa (%)
Place of birth for the foreign-born population - Other Southern Africa (%)
Place of birth for the foreign-born population - Cabo Verde (%)
Place of birth for the foreign-born population - Ghana (%)
Place of birth for the foreign-born population - Liberia (%)
Place of birth for the foreign-born population - Nigeria (%)
Place of birth for the foreign-born population - Senegal (%)
Place of birth for the foreign-born population - Sierra Leone (%)
Place of birth for the foreign-born population - Other Western Africa (%)
Place of birth for the foreign-born population - Australia (%)
Place of birth for the foreign-born population - New Zealand (%)
Place of birth for the foreign-born population - Fiji (%)
Place of birth for the foreign-born population - Micronesia (%)
Place of birth for the foreign-born population - Bahamas (%)
Place of birth for the foreign-born population - Barbados (%)
Place of birth for the foreign-born population - Cuba (%)
Place of birth for the foreign-born population - Dominica (%)
Place of birth for the foreign-born population - Dominican Republic (%)
Place of birth for the foreign-born population - Grenada (%)
Place of birth for the foreign-born population - Haiti (%)
Place of birth for the foreign-born population - Jamaica (%)
Place of birth for the foreign-born population - St. Vincent and the Grenadines (%)
Place of birth for the foreign-born population - Trinidad and Tobago (%)
Place of birth for the foreign-born population - West Indies (%)
Place of birth for the foreign-born population - Other Caribbean (%)
Place of birth for the foreign-born population - Belize (%)
Place of birth for the foreign-born population - Costa Rica (%)
Place of birth for the foreign-born population - El Salvador (%)
Place of birth for the foreign-born population - Guatemala (%)
Place of birth for the foreign-born population - Honduras (%)
Place of birth for the foreign-born population - Mexico (%)
Place of birth for the foreign-born population - Nicaragua (%)
Place of birth for the foreign-born population - Panama (%)
Place of birth for the foreign-born population - Other Central America (%)
Place of birth for the foreign-born population - Argentina (%)
Place of birth for the foreign-born population - Bolivia (%)
Place of birth for the foreign-born population - Brazil (%)
Place of birth for the foreign-born population - Chile (%)
Place of birth for the foreign-born population - Colombia (%)
Place of birth for the foreign-born population - Ecuador (%)
Place of birth for the foreign-born population - Guyana (%)
Place of birth for the foreign-born population - Peru (%)
Place of birth for the foreign-born population - Uruguay (%)
Place of birth for the foreign-born population - Venezuela (%)
Place of birth for the foreign-born population - Other South America (%)
Place of birth for the foreign-born population - Canada (%)
Place of birth for the foreign-born population - Other Northern America (%)
Place of birth for the foreign-born population - Other (%)
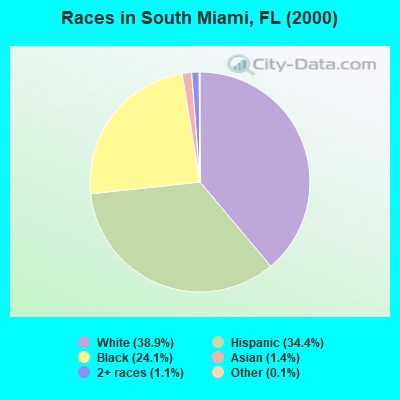
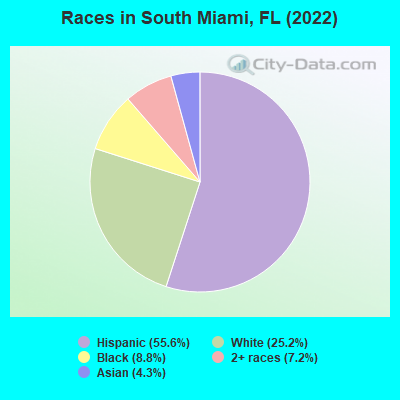
According to 2022 data, the most numerous races in South Miami, FL are White alone (2,989 residents), Hispanic (6,608 residents), and Black alone (1,043 residents). 39.6% of South Miami residents speak English at home. 44.4% of South Miami, FL residents are foreign-born (35.4% born in Latin America), which is 52.7% greater than the foreign-born rate of 21.0% across the entire state of Florida.
Race distribution in South Miami
2000 2022
10,458,509 65.4% White alone 2,682,715 16.8% Hispanic 2,264,268 14.2% Black alone 261,693 1.6% Asian alone 236,954 1.5% Two or more races 42,358 0.3% American Indian alone 28,994 0.2% Other race alone 6,887 0.04% Native Hawaiian and Other
11,309,403 50.8% White alone 6,025,039 27.1% Hispanic 3,241,015 14.6% Black alone 861,630 3.9% Two or more races 623,692 2.8% Asian alone 152,054 0.7% Other race alone 22,504 0.1% American Indian alone 9,486 0.04% Native Hawaiian and Other
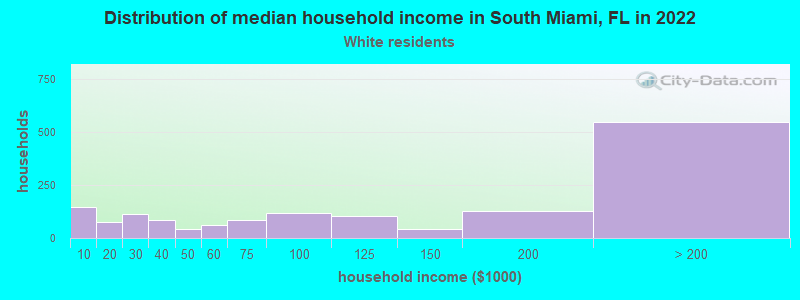
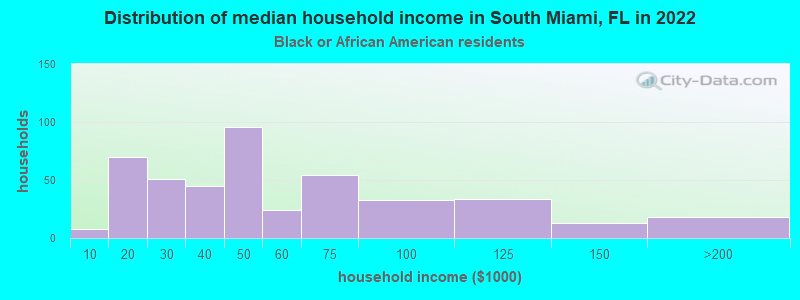
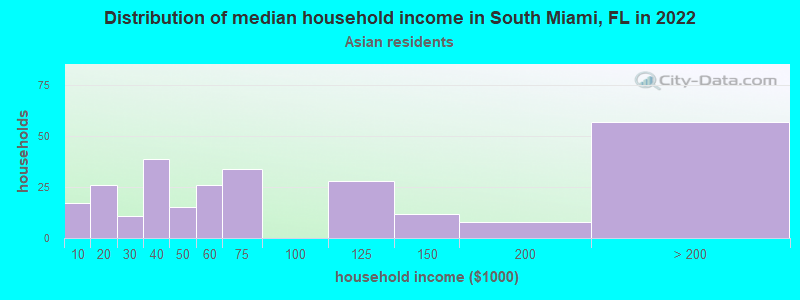
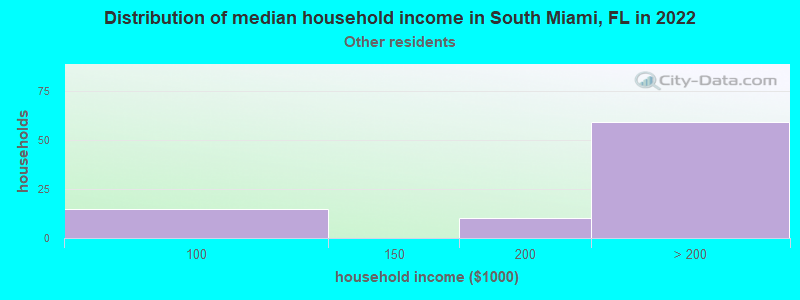
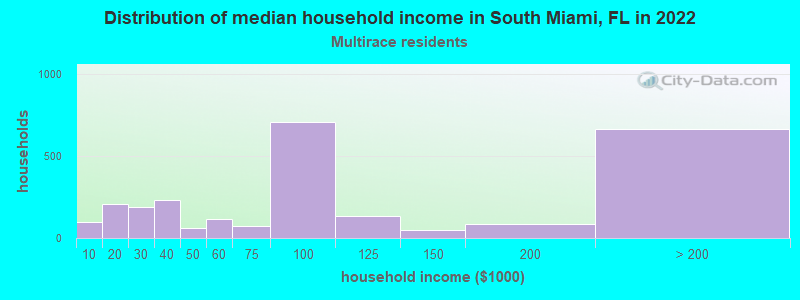
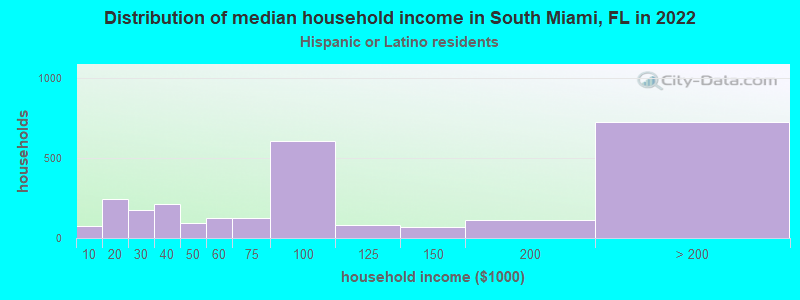
Income and house value in South Miami Median household income in 2022 $96,675 White non-Hispanic householders$46,301 Black householders$63,281 Asian householdersover $200,000 Some other race householders$88,314 Two or more races householders$84,200 Hispanic or Latino race householdersMedian 2022 house value $932,525 White Non-Hispanic householders$428,724 Black or African American householders$753,231 Some other race householders$679,143 Two or more races householders$850,040 Hispanic or Latino householders
Median age by race in South Miami
33.6 Median age for White residents32.2 38.4 50.2 Median age for Black or African American residents49.6 50.4 -653,446,647.1 Median age for American Indian / Alaska Native residents-543,352,600.6 -762,696,213.5 32.5 Median age for Asian residents33.4 31.6 -679,849,340.2 Median age for Native Hawaiian / Pacific Islander residents-858,307,848.3 -443,298,968.6 65.3 Median age for Other race residents44.1 66.1 41.6 Median age for Two or more races residents32.9 48.6 35.9 Median age for White alone residents35.4 38.1 42.4 Median age for Hispanic or Latino residents34.1 49.8
Owner/renter occupied households by race in South Miami
House owners and renters - White residents 810 56.4% Owner occupied625 43.6% Renter occupiedHouse owners and renters - Black or African American residents 226 53.0% Owner occupied201 47.0% Renter occupiedHouse owners and renters - Asian residents 105 39.1% Owner occupied164 60.9% Renter occupiedHouse owners and renters - Other race residents 58 83.4% Owner occupied12 16.6% Renter occupiedHouse owners and renters - Two or more races residents 1,748 66.0% Owner occupied901 34.0% Renter occupiedHouse owners and renters - White alone residents 776 56.6% Owner occupied596 43.4% Renter occupiedHouse owners and renters - Hispanic or Latino residents 1,544 58.7% Owner occupied1,088 41.3% Renter occupied
Language usage in South Miami
English speakers - Total 39.6% of residents of South Miami speak English at home.
49.6% of residents speak Spanish at home 4,030 73.3% Speak English very well1,470 26.7% Speak English less than very well10.6% of residents speak other language at home 835 71.0% Speak English very well341 29.0% Speak English less than very well
English speakers - Born in the United States 79.1% of residents of South Miami speak English at home.
13.6% of residents speak Spanish at home 265 95.3% Speak English very well13 4.7% Speak English less than very well7.5% of residents speak other language at home 154 100.0% Speak English very well
English speakers - Native, born elsewhere 7.9% of residents of South Miami speak English at home.
77.3% of residents speak Spanish at home 207 92.0% Speak English very well18 8.0% Speak English less than very well9.3% of residents speak other language at home 27 100.0% Speak English very well
English speakers - Foreign-born 16.8% of residents of South Miami speak English at home.
65.1% of residents speak Spanish at home 2,021 59.1% Speak English very well1,398 40.9% Speak English less than very well17.8% of residents speak other language at home 627 67.0% Speak English very well309 33.0% Speak English less than very well
White (Caucasian) - Speak only English Native:
79.8% (2,119)Foreign-born:
28.3% (237)
White (Caucasian) - Speak another language Native:
28.9% (766)Foreign-born:
78.4% (657)
Black or African American - Speak only English Native:
93.7% (823)Foreign-born:
39.5% (66)
Black or African American - Speak another language Native:
6.3% (55)Foreign-born:
61.6% (102)
Asian - Speak only English Native:
63.1% (74)Foreign-born:
13.8% (55)
Asian - Speak another language Native:
37.2% (44)Foreign-born:
87.2% (350)
Other race - Speak another language Native:
99.8% (35)Foreign-born:
46.7% (134)
Two or more races - Speak only English Native:
24.7% (481)Foreign-born:
10.7% (439)
Two or more races - Speak another language Native:
75.2% (1,467)Foreign-born:
90.2% (3,688)
White alone - Speak only English Native:
84.4% (1,951)Foreign-born:
66.0% (322)
White alone - Speak another language Native:
16.1% (372)Foreign-born:
43.7% (213)
Hispanic or Latino - Speak only English Native:
22.8% (518)Foreign-born:
10.8% (411)
Hispanic or Latino - Speak another language Native:
77.5% (1,763)Foreign-born:
89.5% (3,397)
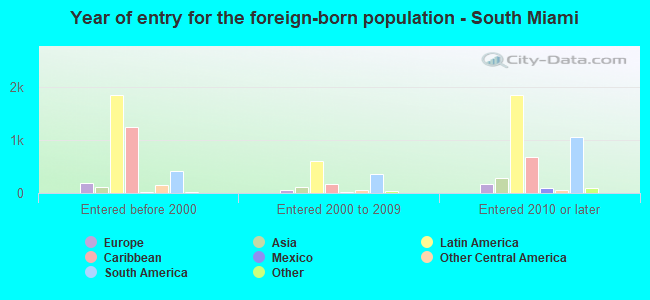
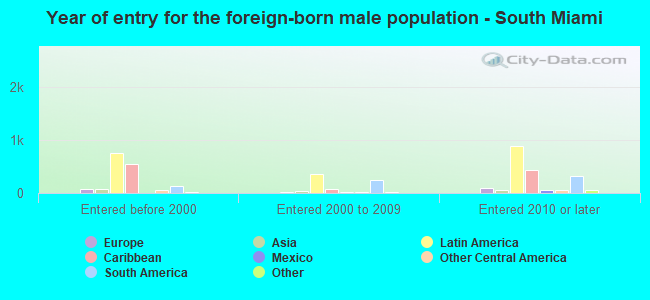
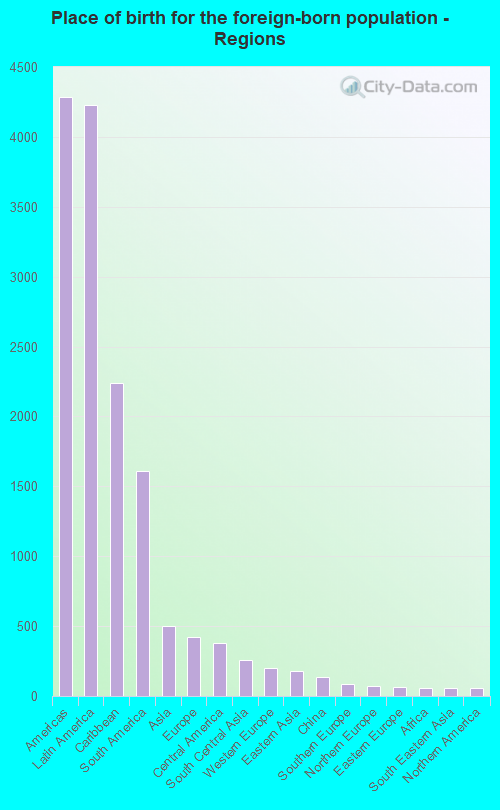
Foreign-born residents in South Miami 5,272 residents are foreign born (35.4% Latin America ).
This city:
44.4%Florida:
21.1%
Marital status for residents in South Miami Marital status - White (Caucasian) population 15 years and over
Males 41.1% Never married49.5% Now married1.0% Separated2.4% Widowed6.0% DivorcedFemales 30.1% Never married49.4% Now married0.6% Separated6.3% Widowed13.6% DivorcedWomen who gave birth in the past 12 months Now married:
53.6% (33)Unmarried:
46.4% (28)
Women who did not give birth in the past 12 months Now married:
49.6% (344)Unmarried:
50.4% (349)
Marital status - Black or African American population 15 years and over
Males 42.9% Never married53.7% Now married0.0% Separated0.0% Widowed3.4% DivorcedFemales 38.2% Never married32.1% Now married13.2% Separated10.2% Widowed6.3% DivorcedWomen who gave birth in the past 12 months Now married:
100.0% (9)Unmarried:
0.0% (0)
Women who did not give birth in the past 12 months Now married:
22.5% (39)Unmarried:
77.5% (135)
Marital status - Asian population 15 years and over
Males 49.5% Never married45.5% Now married0.0% Separated0.0% Widowed5.0% DivorcedFemales 69.7% Never married27.2% Now married0.0% Separated0.0% Widowed3.1% DivorcedWomen who did not give birth in the past 12 months Now married:
15.5% (35)Unmarried:
84.5% (193)
Marital status - Other race population 15 years and over
Males 12.3% Never married87.7% Now married0.0% Separated0.0% Widowed0.0% DivorcedFemales 7.6% Never married15.2% Now married0.0% Separated68.4% Widowed8.8% DivorcedWomen who did not give birth in the past 12 months Now married:
73.3% (31)Unmarried:
26.7% (11)
Marital status - Two or more races population 15 years and over
Males 47.2% Never married40.6% Now married0.0% Separated1.2% Widowed11.0% DivorcedFemales 17.4% Never married50.6% Now married2.5% Separated7.9% Widowed21.5% DivorcedWomen who gave birth in the past 12 months Now married:
100.0% (61)Unmarried:
0.0% (0)
Women who did not give birth in the past 12 months Now married:
63.9% (785)Unmarried:
36.1% (444)
Marital status - White alone, not Hispanic / Latino population 15 years and over
Males 41.2% Never married47.2% Now married1.0% Separated4.8% Widowed5.7% DivorcedFemales 38.2% Never married39.4% Now married0.0% Separated10.2% Widowed12.2% DivorcedWomen who gave birth in the past 12 months Now married:
33.3% (7)Unmarried:
66.7% (13)
Women who did not give birth in the past 12 months Now married:
36.9% (234)Unmarried:
63.1% (401)
Marital status - Hispanic or Latino population 15 years and over
Males 44.1% Never married45.9% Now married0.4% Separated0.7% Widowed8.9% DivorcedFemales 19.4% Never married49.7% Now married2.1% Separated9.9% Widowed19.0% DivorcedWomen who gave birth in the past 12 months Now married:
70.5% (89)Unmarried:
29.5% (37)
Women who did not give birth in the past 12 months Now married:
59.0% (671)Unmarried:
41.0% (465)
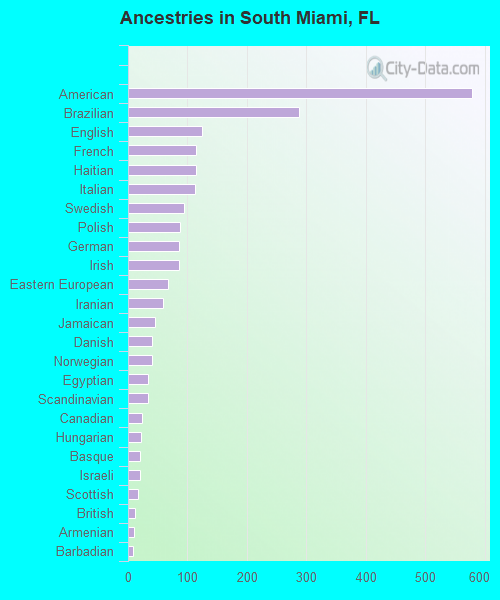
Ancestries in South Miami
578 7.4% American287 3.7% Brazilian124 1.6% English115 1.5% French114 1.5% Haitian112 1.4% Italian94 1.2% Swedish87 1.1% Polish86 1.1% German86 1.1% Irish68 0.9% Eastern European59 0.8% Iranian46 0.6% Jamaican41 0.5% Danish40 0.5% Norwegian34 0.4% Egyptian33 0.4% Scandinavian24 0.3% Canadian22 0.3% Hungarian21 0.3% Basque21 0.3% Israeli17 0.2% Scottish12 0.2% British10 0.1% Armenian9 0.1% Barbadian8 0.1% Portuguese6 0.08% Romanian6 0.08% African
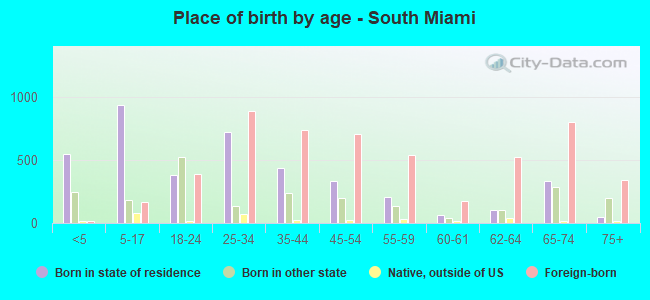
Children Nativity (place of birth) in South Miami
Children under 6 years - Living with two parents Both parents native 226 100.0% NativeBoth parents foreign-born 157 93.9% Native10 6.1% Foreign-bornOne native, one foreign-born parent 231 100.0% NativeChildren under 6 years - Living with one parent Native parent 86 100.0% NativeForeign-born parent 68 100.0% NativeChildren 6 to 17 years - Living with two parents Both parents native 377 100.0% NativeBoth parents foreign-born 263 69.6% Native115 30.4% Foreign-bornOne native, one foreign-born parent 168 95.0% Native9 5.0% Foreign-bornChildren 6 to 17 years - Living with one parent Native parent 91 100.0% NativeForeign-born parent 156 58.3% Native111 41.7% Foreign-born
Grandparents responsible for own grandchildren in South Miami
Grandparents (30 to 59 years) White / Caucasian 17 33.3% Responsible for grandchildren34 66.7% Not responsible for grandchildrenBlack or African American 18 100.0% Responsible for grandchildrenTwo or more races 10 12.5% Responsible for grandchildren68 87.5% Not responsible for grandchildrenWhite alone, not Hispanic / Latino 8 100.0% Responsible for grandchildrenHispanic or Latino 59 39.9% Responsible for grandchildren88 60.1% Not responsible for grandchildren
Grandparents (60 years and over) White / Caucasian 3 100.0% Responsible for grandchildrenBlack or African American 14 100.0% Responsible for grandchildrenTwo or more races 70 100.0% Not responsible for grandchildrenWhite alone, not Hispanic / Latino 3 100.0% Responsible for grandchildrenHispanic or Latino 37 100.0% Not responsible for grandchildren