Races in South Milwaukee, Wisconsin (WI) Detailed Stats
Data:
Races - White alone (%)
Races - White alone (% change since 2000)
Races - Black alone (%)
Races - Black alone (% change since 2000)
Races - American Indian alone (%)
Races - American Indian alone (% change since 2000)
Races - Asian alone (%)
Races - Asian alone (% change since 2000)
Races - Hispanic (%)
Races - Hispanic (% change since 2000)
Races - Native Hawaiian and Other Pacific Islander alone (%)
Races - Native Hawaiian and Other Pacific Islander alone (% change since 2000)
Races - Two or more races(%)
Races - Two or more races(% change since 2000)
Races - Other race alone (%)
Races - Other race alone (% change since 2000)
Racial diversity
Place of birth - Born in state of residence (%)
Place of birth - Born in state of residence (%) - White
Place of birth - Born in state of residence (%) - Black or African American
Place of birth - Born in state of residence (%) - Asian
Place of birth - Born in state of residence (%) - Hispanic or Latino
Place of birth - Born in state of residence (%) - American Indian and Alaska Native
Place of birth - Born in state of residence (%) - Multirace
Place of birth - Born in state of residence (%) - Other Race
Place of birth - Born in other state (%)
Place of birth - Born in other state (%) - White
Place of birth - Born in other state (%) - Black or African American
Place of birth - Born in other state (%) - Asian
Place of birth - Born in other state (%) - Hispanic or Latino
Place of birth - Born in other state (%) - American Indian and Alaska Native
Place of birth - Born in other state (%) - Multirace
Place of birth - Born in other state (%) - Other Race
Place of birth - Native, outside of US (%)
Place of birth - Native, outside of US (%) - White
Place of birth - Native, outside of US (%) - Black or African American
Place of birth - Native, outside of US (%) - Asian
Place of birth - Native, outside of US (%) - Hispanic or Latino
Place of birth - Native, outside of US (%) - American Indian and Alaska Native
Place of birth - Native, outside of US (%) - Multirace
Place of birth - Native, outside of US (%) - Other Race
Place of birth - Foreign born (%)
Place of birth - Foreign born (%) - White
Place of birth - Foreign born (%) - Black or African American
Place of birth - Foreign born (%) - Asian
Place of birth - Foreign born (%) - Hispanic or Latino
Place of birth - Foreign born (%) - American Indian and Alaska Native
Place of birth - Foreign born (%) - Multirace
Place of birth - Foreign born (%) - Other Race
Residents speaking English at home (%)
Residents speaking English at home - Born in the United States (%)
Residents speaking English at home - Native, born elsewhere (%)
Residents speaking English at home - Foreign born (%)
Residents speaking Spanish at home (%)
Residents speaking Spanish at home - Born in the United States (%)
Residents speaking Spanish at home - Native, born elsewhere (%)
Residents speaking Spanish at home - Foreign born (%)
Residents speaking other language at home (%)
Residents speaking other language at home - Born in the United States (%)
Residents speaking other language at home - Native, born elsewhere (%)
Residents speaking other language at home - Foreign born (%)
Marital status - Never married (%)
Marital status - Now married (%)
Marital status - Separated (%)
Marital status - Widowed (%)
Marital status - Divorced (%)
Ancestries Reported - Arab (%)
Ancestries Reported - Czech (%)
Ancestries Reported - Danish (%)
Ancestries Reported - Dutch (%)
Ancestries Reported - English (%)
Ancestries Reported - French (%)
Ancestries Reported - French Canadian (%)
Ancestries Reported - German (%)
Ancestries Reported - Greek (%)
Ancestries Reported - Hungarian (%)
Ancestries Reported - Irish (%)
Ancestries Reported - Italian (%)
Ancestries Reported - Lithuanian (%)
Ancestries Reported - Norwegian (%)
Ancestries Reported - Polish (%)
Ancestries Reported - Portuguese (%)
Ancestries Reported - Russian (%)
Ancestries Reported - Scotch-Irish (%)
Ancestries Reported - Scottish (%)
Ancestries Reported - Slovak (%)
Ancestries Reported - Subsaharan African (%)
Ancestries Reported - Swedish (%)
Ancestries Reported - Swiss (%)
Ancestries Reported - Ukrainian (%)
Ancestries Reported - United States (%)
Ancestries Reported - Welsh (%)
Ancestries Reported - West Indian (%)
Ancestries Reported - Other (%)
Geographical mobility - Same house 1 year ago (%)
Geographical mobility - Same house 1 year ago (%) - White
Geographical mobility - Same house 1 year ago (%) - Black or African American
Geographical mobility - Same house 1 year ago (%) - Asian
Geographical mobility - Same house 1 year ago (%) - Hispanic or Latino
Geographical mobility - Same house 1 year ago (%) - American Indian and Alaska Native
Geographical mobility - Same house 1 year ago (%) - Multirace
Geographical mobility - Same house 1 year ago (%) - Other Race
Geographical mobility - Moved within same county (%)
Geographical mobility - Moved within same county (%) - White
Geographical mobility - Moved within same county (%) - Black or African American
Geographical mobility - Moved within same county (%) - Asian
Geographical mobility - Moved within same county (%) - Hispanic or Latino
Geographical mobility - Moved within same county (%) - American Indian and Alaska Native
Geographical mobility - Moved within same county (%) - Multirace
Geographical mobility - Moved within same county (%) - Other Race
Geographical mobility - Moved from different county within same state (%)
Geographical mobility - Moved from different county within same state (%) - White
Geographical mobility - Moved from different county within same state (%) - Black or African American
Geographical mobility - Moved from different county within same state (%) - Asian
Geographical mobility - Moved from different county within same state (%) - Hispanic or Latino
Geographical mobility - Moved from different county within same state (%) - American Indian and Alaska Native
Geographical mobility - Moved from different county within same state (%) - Multirace
Geographical mobility - Moved from different county within same state (%) - Other Race
Geographical mobility - Moved from different state (%)
Geographical mobility - Moved from different state (%) - White
Geographical mobility - Moved from different state (%) - Black or African American
Geographical mobility - Moved from different state (%) - Asian
Geographical mobility - Moved from different state (%) - Hispanic or Latino
Geographical mobility - Moved from different state (%) - American Indian and Alaska Native
Geographical mobility - Moved from different state (%) - Multirace
Geographical mobility - Moved from different state (%) - Other Race
Geographical mobility - Moved from abroad (%)
Geographical mobility - Moved from abroad (%) - White
Geographical mobility - Moved from abroad (%) - Black or African American
Geographical mobility - Moved from abroad (%) - Asian
Geographical mobility - Moved from abroad (%) - Hispanic or Latino
Geographical mobility - Moved from abroad (%) - American Indian and Alaska Native
Geographical mobility - Moved from abroad (%) - Multirace
Geographical mobility - Moved from abroad (%) - Other Race
Place of birth for the foreign-born population - Ireland (%)
Place of birth for the foreign-born population - Denmark (%)
Place of birth for the foreign-born population - Norway (%)
Place of birth for the foreign-born population - Sweden (%)
Place of birth for the foreign-born population - United Kingdom (%)
Place of birth for the foreign-born population - England (%)
Place of birth for the foreign-born population - Scotland (%)
Place of birth for the foreign-born population - Other Northern Europe (%)
Place of birth for the foreign-born population - Austria (%)
Place of birth for the foreign-born population - Belgium (%)
Place of birth for the foreign-born population - France (%)
Place of birth for the foreign-born population - Germany (%)
Place of birth for the foreign-born population - Netherlands (%)
Place of birth for the foreign-born population - Switzerland (%)
Place of birth for the foreign-born population - Other Western Europe (%)
Place of birth for the foreign-born population - Greece (%)
Place of birth for the foreign-born population - Italy (%)
Place of birth for the foreign-born population - Portugal (%)
Place of birth for the foreign-born population - Spain (%)
Place of birth for the foreign-born population - Other Southern Europe (%)
Place of birth for the foreign-born population - Albania (%)
Place of birth for the foreign-born population - Belarus (%)
Place of birth for the foreign-born population - Bosnia and Herzegovina (%)
Place of birth for the foreign-born population - Bulgaria (%)
Place of birth for the foreign-born population - Croatia (%)
Place of birth for the foreign-born population - Czechoslovakia (%)
Place of birth for the foreign-born population - Hungary (%)
Place of birth for the foreign-born population - Latvia (%)
Place of birth for the foreign-born population - Lithuania (%)
Place of birth for the foreign-born population - North Macedonia (Macedonia) (%)
Place of birth for the foreign-born population - Moldova (%)
Place of birth for the foreign-born population - Poland (%)
Place of birth for the foreign-born population - Romania (%)
Place of birth for the foreign-born population - Russia (%)
Place of birth for the foreign-born population - Serbia (%)
Place of birth for the foreign-born population - Ukraine (%)
Place of birth for the foreign-born population - Other Eastern Europe (%)
Place of birth for the foreign-born population - China (%)
Place of birth for the foreign-born population - Hong Kong (%)
Place of birth for the foreign-born population - Taiwan (%)
Place of birth for the foreign-born population - Japan (%)
Place of birth for the foreign-born population - Korea (%)
Place of birth for the foreign-born population - Other Eastern Asia (%)
Place of birth for the foreign-born population - Afghanistan (%)
Place of birth for the foreign-born population - Bangladesh (%)
Place of birth for the foreign-born population - India (%)
Place of birth for the foreign-born population - Iran (%)
Place of birth for the foreign-born population - Kazakhstan (%)
Place of birth for the foreign-born population - Nepal (%)
Place of birth for the foreign-born population - Pakistan (%)
Place of birth for the foreign-born population - Sri Lanka (%)
Place of birth for the foreign-born population - Uzbekistan (%)
Place of birth for the foreign-born population - Other South Central Asia (%)
Place of birth for the foreign-born population - Burma (%)
Place of birth for the foreign-born population - Cambodia (%)
Place of birth for the foreign-born population - Indonesia (%)
Place of birth for the foreign-born population - Laos (%)
Place of birth for the foreign-born population - Malaysia (%)
Place of birth for the foreign-born population - Philippines (%)
Place of birth for the foreign-born population - Singapore (%)
Place of birth for the foreign-born population - Thailand (%)
Place of birth for the foreign-born population - Vietnam (%)
Place of birth for the foreign-born population - Other South Eastern Asia (%)
Place of birth for the foreign-born population - Armenia (%)
Place of birth for the foreign-born population - Iraq (%)
Place of birth for the foreign-born population - Israel (%)
Place of birth for the foreign-born population - Jordan (%)
Place of birth for the foreign-born population - Kuwait (%)
Place of birth for the foreign-born population - Lebanon (%)
Place of birth for the foreign-born population - Saudi Arabia (%)
Place of birth for the foreign-born population - Syria (%)
Place of birth for the foreign-born population - Turkey (%)
Place of birth for the foreign-born population - Yemen (%)
Place of birth for the foreign-born population - Other Western Asia (%)
Place of birth for the foreign-born population - Eritrea (%)
Place of birth for the foreign-born population - Ethiopia (%)
Place of birth for the foreign-born population - Kenya (%)
Place of birth for the foreign-born population - Somalia (%)
Place of birth for the foreign-born population - Uganda (%)
Place of birth for the foreign-born population - Zimbabwe (%)
Place of birth for the foreign-born population - Other Eastern Africa (%)
Place of birth for the foreign-born population - Cameroon (%)
Place of birth for the foreign-born population - Congo (%)
Place of birth for the foreign-born population - Democratic Republic of Congo (Zaire) (%)
Place of birth for the foreign-born population - Other Middle Africa (%)
Place of birth for the foreign-born population - Egypt (%)
Place of birth for the foreign-born population - Morocco (%)
Place of birth for the foreign-born population - Sudan (%)
Place of birth for the foreign-born population - Other Northern Africa (%)
Place of birth for the foreign-born population - South Africa (%)
Place of birth for the foreign-born population - Other Southern Africa (%)
Place of birth for the foreign-born population - Cabo Verde (%)
Place of birth for the foreign-born population - Ghana (%)
Place of birth for the foreign-born population - Liberia (%)
Place of birth for the foreign-born population - Nigeria (%)
Place of birth for the foreign-born population - Senegal (%)
Place of birth for the foreign-born population - Sierra Leone (%)
Place of birth for the foreign-born population - Other Western Africa (%)
Place of birth for the foreign-born population - Australia (%)
Place of birth for the foreign-born population - New Zealand (%)
Place of birth for the foreign-born population - Fiji (%)
Place of birth for the foreign-born population - Micronesia (%)
Place of birth for the foreign-born population - Bahamas (%)
Place of birth for the foreign-born population - Barbados (%)
Place of birth for the foreign-born population - Cuba (%)
Place of birth for the foreign-born population - Dominica (%)
Place of birth for the foreign-born population - Dominican Republic (%)
Place of birth for the foreign-born population - Grenada (%)
Place of birth for the foreign-born population - Haiti (%)
Place of birth for the foreign-born population - Jamaica (%)
Place of birth for the foreign-born population - St. Vincent and the Grenadines (%)
Place of birth for the foreign-born population - Trinidad and Tobago (%)
Place of birth for the foreign-born population - West Indies (%)
Place of birth for the foreign-born population - Other Caribbean (%)
Place of birth for the foreign-born population - Belize (%)
Place of birth for the foreign-born population - Costa Rica (%)
Place of birth for the foreign-born population - El Salvador (%)
Place of birth for the foreign-born population - Guatemala (%)
Place of birth for the foreign-born population - Honduras (%)
Place of birth for the foreign-born population - Mexico (%)
Place of birth for the foreign-born population - Nicaragua (%)
Place of birth for the foreign-born population - Panama (%)
Place of birth for the foreign-born population - Other Central America (%)
Place of birth for the foreign-born population - Argentina (%)
Place of birth for the foreign-born population - Bolivia (%)
Place of birth for the foreign-born population - Brazil (%)
Place of birth for the foreign-born population - Chile (%)
Place of birth for the foreign-born population - Colombia (%)
Place of birth for the foreign-born population - Ecuador (%)
Place of birth for the foreign-born population - Guyana (%)
Place of birth for the foreign-born population - Peru (%)
Place of birth for the foreign-born population - Uruguay (%)
Place of birth for the foreign-born population - Venezuela (%)
Place of birth for the foreign-born population - Other South America (%)
Place of birth for the foreign-born population - Canada (%)
Place of birth for the foreign-born population - Other Northern America (%)
Place of birth for the foreign-born population - Other (%)
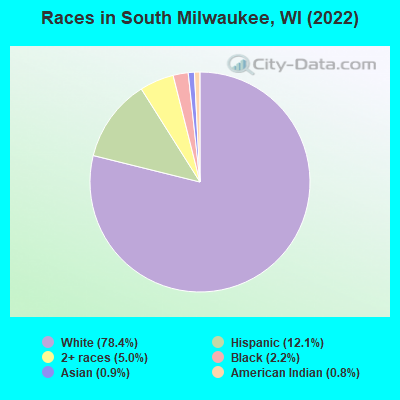
According to 2022 data, the most numerous races in South Milwaukee, WI are White alone (15,965 residents), Hispanic (2,459 residents), and Black alone (456 residents). 88.2% of South Milwaukee residents speak English at home. 5.5% of South Milwaukee, WI residents are foreign-born (3.4% born in Europe, 1.1% born in Latin America, 0.8% born in Asia), which is 8.3% greater than the foreign-born rate of 5.0% across the entire state of Wisconsin.
Race distribution in South Milwaukee
2000 2022
4,681,630 87.3% White alone 300,245 5.6% Black alone 192,921 3.6% Hispanic 87,995 1.6% Asian alone 51,921 1.0% Two or more races 43,980 0.8% American Indian alone 3,637 0.07% Other race alone 1,346 0.03% Native Hawaiian and Other
4,654,031 79.0% White alone 447,022 7.6% Hispanic 345,678 5.9% Black alone 217,532 3.7% Two or more races 172,242 2.9% Asian alone 33,762 0.6% American Indian alone 19,680 0.3% Other race alone 2,592 0.04% Native Hawaiian and Other
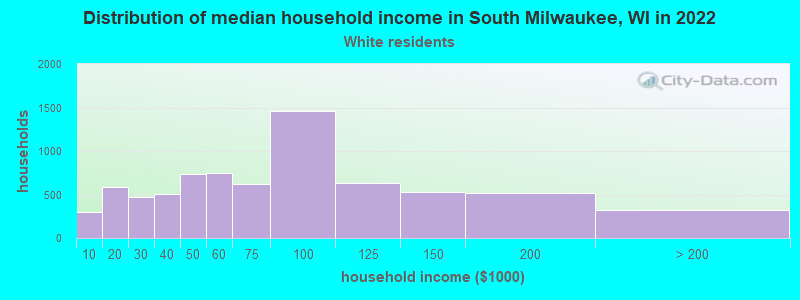
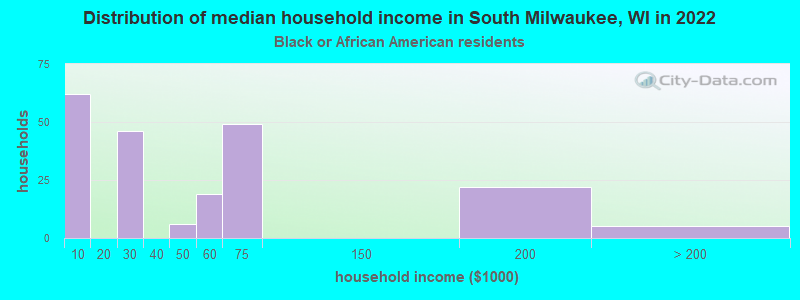
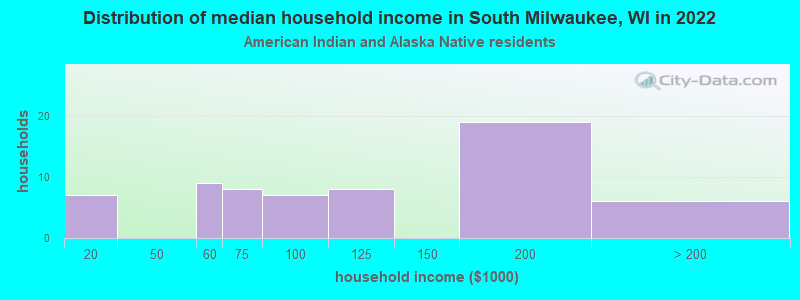
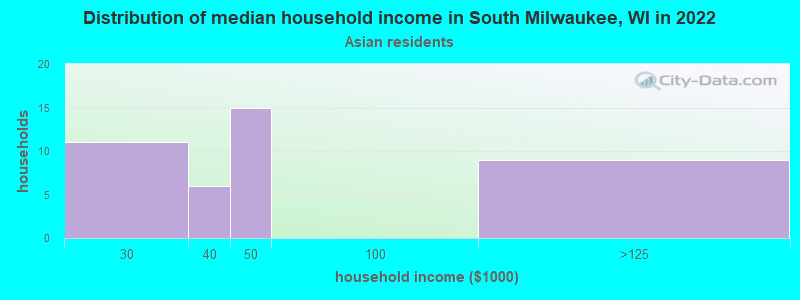
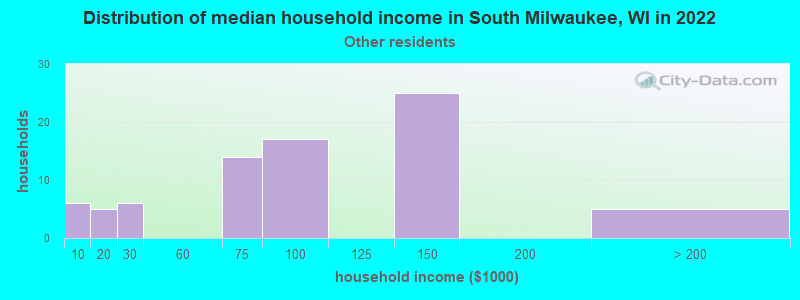
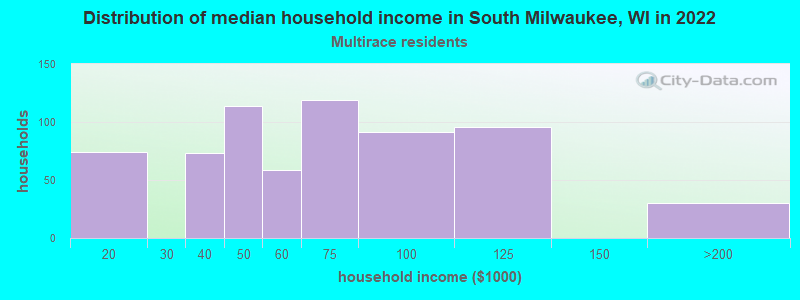
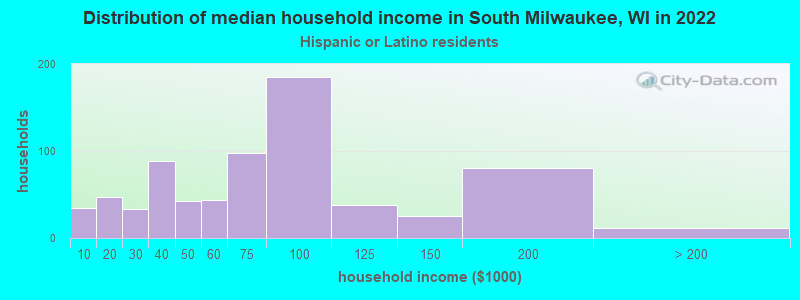
Income and house value in South Milwaukee Median household income in 2022 $70,087 White non-Hispanic householders$128,615 American Indian and Alaska Native householders$40,771 Asian householders$77,362 Some other race householders$61,210 Two or more races householders$69,202 Hispanic or Latino race householdersMedian 2022 house value $216,855 White Non-Hispanic householders$366,970 Black or African American householders$220,182 American Indian or Alaska Native householders $134,262 Asian householders$251,692 Some other race householders$306,689 Two or more races householders$264,805 Hispanic or Latino householders
Median age by race in South Milwaukee
46.5 Median age for White residents45.2 47.2 36.3 Median age for Black or African American residents55.6 29.8 26.5 Median age for American Indian / Alaska Native residents31.9 17.7 37.1 Median age for Asian residents15.2 44.3 -825,688,072.6 Median age for Native Hawaiian / Pacific Islander residents-862,745,097.2 -732,444,443.7 26.8 Median age for Other race residents22.1 42.0 19.3 Median age for Two or more races residents17.2 24.3 48.5 Median age for White alone residents48.6 49.1 22.4 Median age for Hispanic or Latino residents20.2 30.0
Owner/renter occupied households by race in South Milwaukee
House owners and renters - White residents 5,003 67.3% Owner occupied2,429 32.7% Renter occupiedHouse owners and renters - Black or African American residents 26 12.4% Owner occupied180 87.6% Renter occupiedHouse owners and renters - American Indian / Alaska Native residents 45 57.5% Owner occupied33 42.5% Renter occupiedHouse owners and renters - Asian residents 17 44.7% Owner occupied21 55.3% Renter occupiedHouse owners and renters - Other race residents 68 87.5% Owner occupied10 12.5% Renter occupiedHouse owners and renters - Two or more races residents 337 53.0% Owner occupied299 47.0% Renter occupiedHouse owners and renters - White alone residents 4,864 67.0% Owner occupied2,393 33.0% Renter occupiedHouse owners and renters - Hispanic or Latino residents 517 73.3% Owner occupied189 26.7% Renter occupied
Language usage in South Milwaukee
English speakers - Total 88.2% of residents of South Milwaukee speak English at home.
5.8% of residents speak Spanish at home 716 64.7% Speak English very well390 35.3% Speak English less than very well5.9% of residents speak other language at home 673 59.6% Speak English very well456 40.4% Speak English less than very well
English speakers - Born in the United States 88.7% of residents of South Milwaukee speak English at home.
6.7% of residents speak Spanish at home 145 78.4% Speak English very well40 21.6% Speak English less than very well4.6% of residents speak other language at home 110 87.3% Speak English very well16 12.7% Speak English less than very well
English speakers - Native, born elsewhere 25.9% of residents of South Milwaukee speak English at home.
46.5% of residents speak Spanish at home 65 46.4% Speak English very well75 53.6% Speak English less than very well26.9% of residents speak other language at home 44 54.3% Speak English very well37 45.7% Speak English less than very well
English speakers - Foreign-born 21.9% of residents of South Milwaukee speak English at home.
20.0% of residents speak Spanish at home 64 28.8% Speak English very well158 71.2% Speak English less than very well57.1% of residents speak other language at home 250 39.5% Speak English very well383 60.5% Speak English less than very well
White (Caucasian) - Speak only English Native:
96.9% (14,661)Foreign-born:
33.1% (152)
White (Caucasian) - Speak another language Native:
3.4% (520)Foreign-born:
68.3% (314)
Asian - Speak only English Native:
66.1% (38)Foreign-born:
37.3% (34)
Asian - Speak another language Native:
32.3% (19)Foreign-born:
60.8% (55)
Other race - Speak another language Native:
67.1% (134)Foreign-born:
94.6% (57)
Two or more races - Speak another language Native:
17.6% (321)Foreign-born:
100.0% (148)
White alone - Speak only English Native:
96.7% (14,127)Foreign-born:
25.4% (161)
White alone - Speak another language Native:
3.2% (470)Foreign-born:
75.0% (475)
Hispanic or Latino - Speak another language Native:
42.3% (799)Foreign-born:
99.3% (231)
Foreign-born residents in South Milwaukee 1,110 residents are foreign born (3.4% Europe , 1.1% Latin America , 0.8% Asia ).
This city:
5.5%Wisconsin:
5.0%
Marital status for residents in South Milwaukee Marital status - White (Caucasian) population 15 years and over
Males 34.6% Never married49.2% Now married0.2% Separated3.8% Widowed12.1% DivorcedFemales 26.0% Never married48.7% Now married0.8% Separated10.3% Widowed14.2% DivorcedWomen who gave birth in the past 12 months Now married:
73.7% (184)Unmarried:
26.3% (66)
Women who did not give birth in the past 12 months Now married:
40.6% (1,298)Unmarried:
59.4% (1,899)
Marital status - Black or African American population 15 years and over
Males 19.1% Never married62.6% Now married0.0% Separated13.9% Widowed4.3% DivorcedFemales 61.9% Never married35.4% Now married0.0% Separated0.0% Widowed2.7% DivorcedWomen who gave birth in the past 12 months Now married:
100.0% (14)Unmarried:
0.0% (0)
Women who did not give birth in the past 12 months Now married:
30.6% (35)Unmarried:
69.4% (80)
Marital status - American Indian / Alaska Native population 15 years and over
Males 57.1% Never married22.1% Now married5.0% Separated0.0% Widowed15.7% DivorcedFemales 61.7% Never married34.2% Now married0.0% Separated0.0% Widowed4.2% DivorcedWomen who did not give birth in the past 12 months Now married:
30.2% (44)Unmarried:
69.8% (102)
Marital status - Asian population 15 years and over
Males 25.8% Never married74.2% Now married0.0% Separated0.0% Widowed0.0% DivorcedFemales 16.9% Never married67.5% Now married8.4% Separated7.2% Widowed0.0% DivorcedWomen who gave birth in the past 12 months Now married:
100.0% (20)Unmarried:
0.0% (0)
Women who did not give birth in the past 12 months Now married:
61.1% (24)Unmarried:
38.9% (15)
Marital status - Other race population 15 years and over
Males 51.0% Never married38.8% Now married3.7% Separated0.0% Widowed6.5% DivorcedFemales 29.7% Never married52.3% Now married5.4% Separated12.6% Widowed0.0% DivorcedWomen who did not give birth in the past 12 months Now married:
50.7% (20)Unmarried:
49.3% (19)
Marital status - Two or more races population 15 years and over
Males 68.4% Never married25.5% Now married0.0% Separated0.0% Widowed6.1% DivorcedFemales 59.8% Never married20.2% Now married1.7% Separated4.6% Widowed13.7% DivorcedWomen who gave birth in the past 12 months Now married:
0.0% (0)Unmarried:
100.0% (76)
Women who did not give birth in the past 12 months Now married:
16.1% (75)Unmarried:
83.9% (388)
Marital status - White alone, not Hispanic / Latino population 15 years and over
Males 33.5% Never married49.7% Now married0.2% Separated4.0% Widowed12.6% DivorcedFemales 25.7% Never married48.2% Now married0.8% Separated10.8% Widowed14.5% DivorcedWomen who gave birth in the past 12 months Now married:
71.3% (171)Unmarried:
28.7% (69)
Women who did not give birth in the past 12 months Now married:
39.9% (1,230)Unmarried:
60.1% (1,855)
Marital status - Hispanic or Latino population 15 years and over
Males 56.2% Never married38.5% Now married1.1% Separated0.0% Widowed4.3% DivorcedFemales 34.5% Never married47.4% Now married1.9% Separated3.3% Widowed13.0% DivorcedWomen who gave birth in the past 12 months Now married:
57.5% (24)Unmarried:
42.5% (18)
Women who did not give birth in the past 12 months Now married:
42.0% (216)Unmarried:
58.0% (298)
Ancestries in South Milwaukee
2,226 25.2% German1,133 12.8% Polish619 7.0% Albanian393 4.4% Italian350 4.0% English346 3.9% American259 2.9% Irish243 2.8% European113 1.3% Norwegian97 1.1% Ukrainian78 0.9% Swedish67 0.8% French65 0.7% Czech60 0.7% French Canadian58 0.7% Greek45 0.5% Serbian44 0.5% Slavic42 0.5% Dutch37 0.4% Armenian36 0.4% Danish28 0.3% Eastern European26 0.3% Finnish24 0.3% Yugoslavian22 0.2% Slovak21 0.2% Hungarian18 0.2% Croatian17 0.2% Northern European15 0.2% Russian14 0.2% Luxembourger13 0.1% Iranian10 0.1% Austrian10 0.1% Scandinavian10 0.1% Slovene10 0.1% Czechoslovakian9 0.1% Scottish8 0.09% Jamaican7 0.08% Palestinian7 0.08% Liberian4 0.05% Egyptian
Geographical mobility in South Milwaukee Same house 1 year ago 14,501 89.8% White (Caucasian)401 87.7% Black or African American433 100.0% American Indian / Alaska Native164 98.4% Asian206 78.0% Other race1,722 76.3% Two or more races14,202 90.3% White alone, not Hispanic / Latino2,108 89.1% Hispanic or LatinoMoved within same county 1,105 6.8% White / Caucasian23 5.1% Black or African American6 3.6% Asian3 1.1% Other race407 18.0% Two or more races990 6.3% White alone, not Hispanic / Latino174 7.4% Hispanic or LatinoMoved within same state 157 1.0% White / Caucasian47 10.3% Black or African American32 12.0% Other race49 2.2% Two or more races156 1.0% White alone, not Hispanic / Latino76 3.2% Hispanic or LatinoMoved from different state 259 1.6% White / Caucasian8 2.9% Other race38 1.7% Two or more races264 1.7% White alone, not Hispanic / Latino8 0.3% Hispanic or LatinoMoved from abroad 61 0.4% White79 0.5% White alone, not Hispanic / Latino
Children Nativity (place of birth) in South Milwaukee
Children under 6 years - Living with two parents Both parents native 735 100.0% NativeBoth parents foreign-born 86 73.3% Native31 26.7% Foreign-bornOne native, one foreign-born parent 109 100.0% NativeChildren under 6 years - Living with one parent Native parent 385 100.0% NativeChildren 6 to 17 years - Living with two parents Both parents native 1,204 100.0% NativeBoth parents foreign-born 141 73.1% Native52 26.9% Foreign-bornOne native, one foreign-born parent 162 100.0% NativeChildren 6 to 17 years - Living with one parent Native parent 1,068 100.0% Native
Grandparents responsible for own grandchildren in South Milwaukee
Grandparents (30 to 59 years) White / Caucasian 106 78.6% Responsible for grandchildren29 21.4% Not responsible for grandchildrenAmerican Indian / Alaska Native 6 46.8% Responsible for grandchildren7 53.2% Not responsible for grandchildrenTwo or more races 65 100.0% Responsible for grandchildrenWhite alone, not Hispanic / Latino 143 87.6% Responsible for grandchildren20 12.4% Not responsible for grandchildrenHispanic or Latino 28 100.0% Responsible for grandchildrenGrandparents (60 years and over) White / Caucasian 56 31.9% Responsible for grandchildren119 68.1% Not responsible for grandchildrenWhite alone, not Hispanic / Latino 61 31.0% Responsible for grandchildren136 69.0% Not responsible for grandchildren