Races in South Ogden, Utah (UT) Detailed Stats
Data:
Races - White alone (%)
Races - White alone (% change since 2000)
Races - Black alone (%)
Races - Black alone (% change since 2000)
Races - American Indian alone (%)
Races - American Indian alone (% change since 2000)
Races - Asian alone (%)
Races - Asian alone (% change since 2000)
Races - Hispanic (%)
Races - Hispanic (% change since 2000)
Races - Native Hawaiian and Other Pacific Islander alone (%)
Races - Native Hawaiian and Other Pacific Islander alone (% change since 2000)
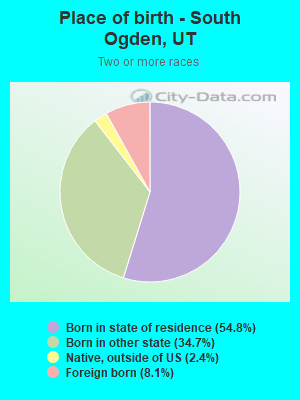
Races - Two or more races(%)
Races - Two or more races(% change since 2000)
Races - Other race alone (%)
Races - Other race alone (% change since 2000)
Racial diversity
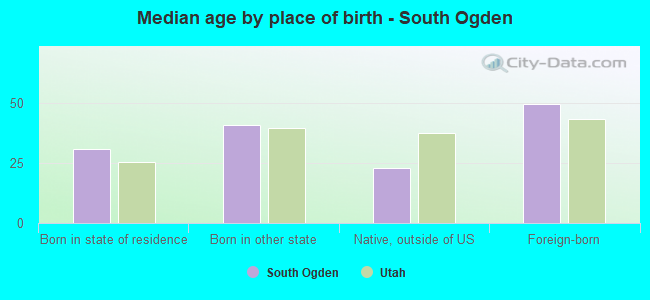
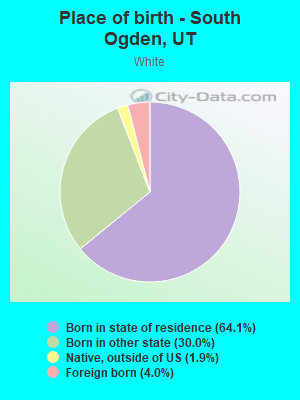
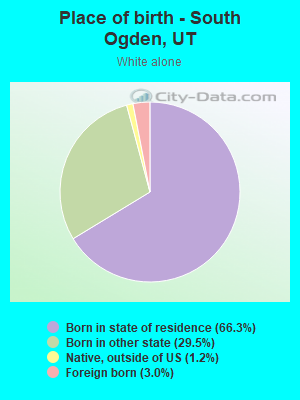
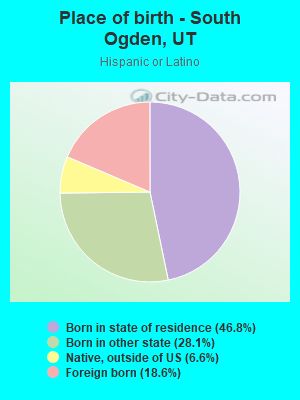
Place of birth - Born in state of residence (%)
Place of birth - Born in state of residence (%) - White
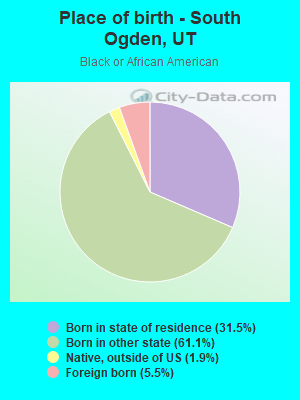
Place of birth - Born in state of residence (%) - Black or African American
Place of birth - Born in state of residence (%) - Asian
Place of birth - Born in state of residence (%) - Hispanic or Latino
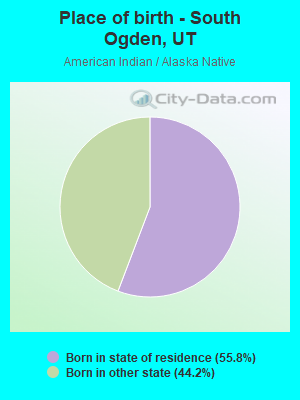
Place of birth - Born in state of residence (%) - American Indian and Alaska Native
Place of birth - Born in state of residence (%) - Multirace
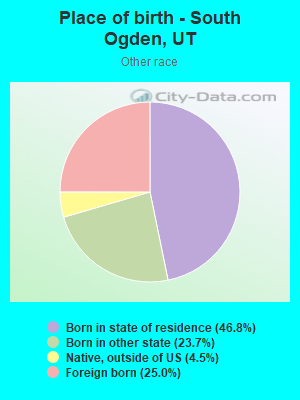
Place of birth - Born in state of residence (%) - Other Race
Place of birth - Born in other state (%)
Place of birth - Born in other state (%) - White
Place of birth - Born in other state (%) - Black or African American
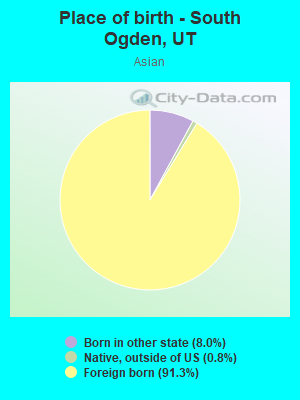
Place of birth - Born in other state (%) - Asian
Place of birth - Born in other state (%) - Hispanic or Latino
Place of birth - Born in other state (%) - American Indian and Alaska Native
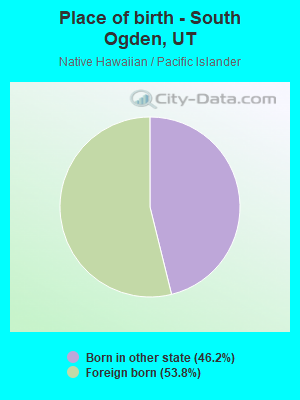
Place of birth - Born in other state (%) - Multirace
Place of birth - Born in other state (%) - Other Race
Place of birth - Native, outside of US (%)
Place of birth - Native, outside of US (%) - White
Place of birth - Native, outside of US (%) - Black or African American
Place of birth - Native, outside of US (%) - Asian
Place of birth - Native, outside of US (%) - Hispanic or Latino
Place of birth - Native, outside of US (%) - American Indian and Alaska Native
Place of birth - Native, outside of US (%) - Multirace
Place of birth - Native, outside of US (%) - Other Race
Place of birth - Foreign born (%)
Place of birth - Foreign born (%) - White
Place of birth - Foreign born (%) - Black or African American
Place of birth - Foreign born (%) - Asian
Place of birth - Foreign born (%) - Hispanic or Latino
Place of birth - Foreign born (%) - American Indian and Alaska Native
Place of birth - Foreign born (%) - Multirace
Place of birth - Foreign born (%) - Other Race
Residents speaking English at home (%)
Residents speaking English at home - Born in the United States (%)
Residents speaking English at home - Native, born elsewhere (%)
Residents speaking English at home - Foreign born (%)
Residents speaking Spanish at home (%)
Residents speaking Spanish at home - Born in the United States (%)
Residents speaking Spanish at home - Native, born elsewhere (%)
Residents speaking Spanish at home - Foreign born (%)
Residents speaking other language at home (%)
Residents speaking other language at home - Born in the United States (%)
Residents speaking other language at home - Native, born elsewhere (%)
Residents speaking other language at home - Foreign born (%)
Marital status - Never married (%)
Marital status - Now married (%)
Marital status - Separated (%)
Marital status - Widowed (%)
Marital status - Divorced (%)
Ancestries Reported - Arab (%)
Ancestries Reported - Czech (%)
Ancestries Reported - Danish (%)
Ancestries Reported - Dutch (%)
Ancestries Reported - English (%)
Ancestries Reported - French (%)
Ancestries Reported - French Canadian (%)
Ancestries Reported - German (%)
Ancestries Reported - Greek (%)
Ancestries Reported - Hungarian (%)
Ancestries Reported - Irish (%)
Ancestries Reported - Italian (%)
Ancestries Reported - Lithuanian (%)
Ancestries Reported - Norwegian (%)
Ancestries Reported - Polish (%)
Ancestries Reported - Portuguese (%)
Ancestries Reported - Russian (%)
Ancestries Reported - Scotch-Irish (%)
Ancestries Reported - Scottish (%)
Ancestries Reported - Slovak (%)
Ancestries Reported - Subsaharan African (%)
Ancestries Reported - Swedish (%)
Ancestries Reported - Swiss (%)
Ancestries Reported - Ukrainian (%)
Ancestries Reported - United States (%)
Ancestries Reported - Welsh (%)
Ancestries Reported - West Indian (%)
Ancestries Reported - Other (%)
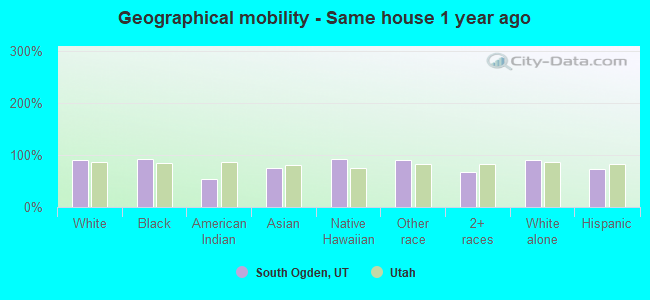
Geographical mobility - Same house 1 year ago (%)
Geographical mobility - Same house 1 year ago (%) - White
Geographical mobility - Same house 1 year ago (%) - Black or African American
Geographical mobility - Same house 1 year ago (%) - Asian
Geographical mobility - Same house 1 year ago (%) - Hispanic or Latino
Geographical mobility - Same house 1 year ago (%) - American Indian and Alaska Native
Geographical mobility - Same house 1 year ago (%) - Multirace
Geographical mobility - Same house 1 year ago (%) - Other Race
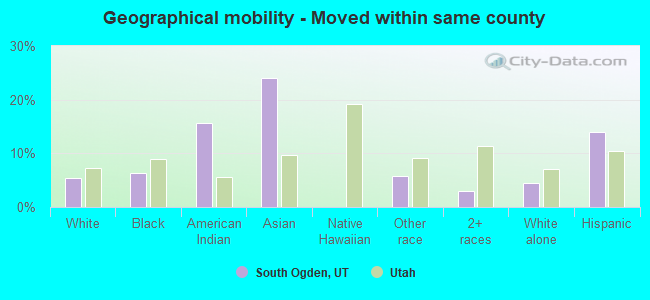
Geographical mobility - Moved within same county (%)
Geographical mobility - Moved within same county (%) - White
Geographical mobility - Moved within same county (%) - Black or African American
Geographical mobility - Moved within same county (%) - Asian
Geographical mobility - Moved within same county (%) - Hispanic or Latino
Geographical mobility - Moved within same county (%) - American Indian and Alaska Native
Geographical mobility - Moved within same county (%) - Multirace
Geographical mobility - Moved within same county (%) - Other Race
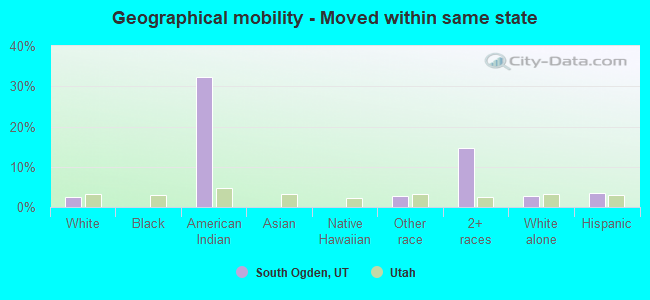
Geographical mobility - Moved from different county within same state (%)
Geographical mobility - Moved from different county within same state (%) - White
Geographical mobility - Moved from different county within same state (%) - Black or African American
Geographical mobility - Moved from different county within same state (%) - Asian
Geographical mobility - Moved from different county within same state (%) - Hispanic or Latino
Geographical mobility - Moved from different county within same state (%) - American Indian and Alaska Native
Geographical mobility - Moved from different county within same state (%) - Multirace
Geographical mobility - Moved from different county within same state (%) - Other Race
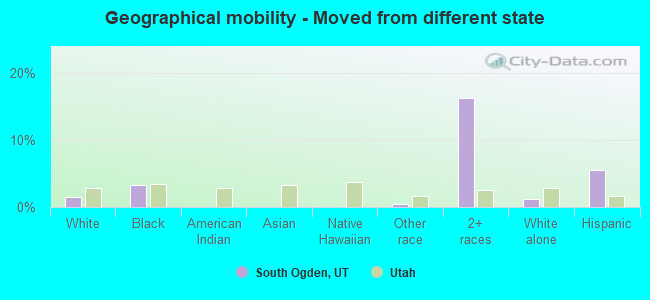
Geographical mobility - Moved from different state (%)
Geographical mobility - Moved from different state (%) - White
Geographical mobility - Moved from different state (%) - Black or African American
Geographical mobility - Moved from different state (%) - Asian
Geographical mobility - Moved from different state (%) - Hispanic or Latino
Geographical mobility - Moved from different state (%) - American Indian and Alaska Native
Geographical mobility - Moved from different state (%) - Multirace
Geographical mobility - Moved from different state (%) - Other Race
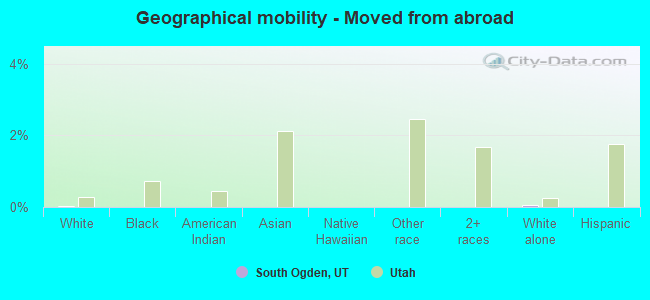
Geographical mobility - Moved from abroad (%)
Geographical mobility - Moved from abroad (%) - White
Geographical mobility - Moved from abroad (%) - Black or African American
Geographical mobility - Moved from abroad (%) - Asian
Geographical mobility - Moved from abroad (%) - Hispanic or Latino
Geographical mobility - Moved from abroad (%) - American Indian and Alaska Native
Geographical mobility - Moved from abroad (%) - Multirace
Geographical mobility - Moved from abroad (%) - Other Race
Place of birth for the foreign-born population - Ireland (%)
Place of birth for the foreign-born population - Denmark (%)
Place of birth for the foreign-born population - Norway (%)
Place of birth for the foreign-born population - Sweden (%)
Place of birth for the foreign-born population - United Kingdom (%)
Place of birth for the foreign-born population - England (%)
Place of birth for the foreign-born population - Scotland (%)
Place of birth for the foreign-born population - Other Northern Europe (%)
Place of birth for the foreign-born population - Austria (%)
Place of birth for the foreign-born population - Belgium (%)
Place of birth for the foreign-born population - France (%)
Place of birth for the foreign-born population - Germany (%)
Place of birth for the foreign-born population - Netherlands (%)
Place of birth for the foreign-born population - Switzerland (%)
Place of birth for the foreign-born population - Other Western Europe (%)
Place of birth for the foreign-born population - Greece (%)
Place of birth for the foreign-born population - Italy (%)
Place of birth for the foreign-born population - Portugal (%)
Place of birth for the foreign-born population - Spain (%)
Place of birth for the foreign-born population - Other Southern Europe (%)
Place of birth for the foreign-born population - Albania (%)
Place of birth for the foreign-born population - Belarus (%)
Place of birth for the foreign-born population - Bosnia and Herzegovina (%)
Place of birth for the foreign-born population - Bulgaria (%)
Place of birth for the foreign-born population - Croatia (%)
Place of birth for the foreign-born population - Czechoslovakia (%)
Place of birth for the foreign-born population - Hungary (%)
Place of birth for the foreign-born population - Latvia (%)
Place of birth for the foreign-born population - Lithuania (%)
Place of birth for the foreign-born population - North Macedonia (Macedonia) (%)
Place of birth for the foreign-born population - Moldova (%)
Place of birth for the foreign-born population - Poland (%)
Place of birth for the foreign-born population - Romania (%)
Place of birth for the foreign-born population - Russia (%)
Place of birth for the foreign-born population - Serbia (%)
Place of birth for the foreign-born population - Ukraine (%)
Place of birth for the foreign-born population - Other Eastern Europe (%)
Place of birth for the foreign-born population - China (%)
Place of birth for the foreign-born population - Hong Kong (%)
Place of birth for the foreign-born population - Taiwan (%)
Place of birth for the foreign-born population - Japan (%)
Place of birth for the foreign-born population - Korea (%)
Place of birth for the foreign-born population - Other Eastern Asia (%)
Place of birth for the foreign-born population - Afghanistan (%)
Place of birth for the foreign-born population - Bangladesh (%)
Place of birth for the foreign-born population - India (%)
Place of birth for the foreign-born population - Iran (%)
Place of birth for the foreign-born population - Kazakhstan (%)
Place of birth for the foreign-born population - Nepal (%)
Place of birth for the foreign-born population - Pakistan (%)
Place of birth for the foreign-born population - Sri Lanka (%)
Place of birth for the foreign-born population - Uzbekistan (%)
Place of birth for the foreign-born population - Other South Central Asia (%)
Place of birth for the foreign-born population - Burma (%)
Place of birth for the foreign-born population - Cambodia (%)
Place of birth for the foreign-born population - Indonesia (%)
Place of birth for the foreign-born population - Laos (%)
Place of birth for the foreign-born population - Malaysia (%)
Place of birth for the foreign-born population - Philippines (%)
Place of birth for the foreign-born population - Singapore (%)
Place of birth for the foreign-born population - Thailand (%)
Place of birth for the foreign-born population - Vietnam (%)
Place of birth for the foreign-born population - Other South Eastern Asia (%)
Place of birth for the foreign-born population - Armenia (%)
Place of birth for the foreign-born population - Iraq (%)
Place of birth for the foreign-born population - Israel (%)
Place of birth for the foreign-born population - Jordan (%)
Place of birth for the foreign-born population - Kuwait (%)
Place of birth for the foreign-born population - Lebanon (%)
Place of birth for the foreign-born population - Saudi Arabia (%)
Place of birth for the foreign-born population - Syria (%)
Place of birth for the foreign-born population - Turkey (%)
Place of birth for the foreign-born population - Yemen (%)
Place of birth for the foreign-born population - Other Western Asia (%)
Place of birth for the foreign-born population - Eritrea (%)
Place of birth for the foreign-born population - Ethiopia (%)
Place of birth for the foreign-born population - Kenya (%)
Place of birth for the foreign-born population - Somalia (%)
Place of birth for the foreign-born population - Uganda (%)
Place of birth for the foreign-born population - Zimbabwe (%)
Place of birth for the foreign-born population - Other Eastern Africa (%)
Place of birth for the foreign-born population - Cameroon (%)
Place of birth for the foreign-born population - Congo (%)
Place of birth for the foreign-born population - Democratic Republic of Congo (Zaire) (%)
Place of birth for the foreign-born population - Other Middle Africa (%)
Place of birth for the foreign-born population - Egypt (%)
Place of birth for the foreign-born population - Morocco (%)
Place of birth for the foreign-born population - Sudan (%)
Place of birth for the foreign-born population - Other Northern Africa (%)
Place of birth for the foreign-born population - South Africa (%)
Place of birth for the foreign-born population - Other Southern Africa (%)
Place of birth for the foreign-born population - Cabo Verde (%)
Place of birth for the foreign-born population - Ghana (%)
Place of birth for the foreign-born population - Liberia (%)
Place of birth for the foreign-born population - Nigeria (%)
Place of birth for the foreign-born population - Senegal (%)
Place of birth for the foreign-born population - Sierra Leone (%)
Place of birth for the foreign-born population - Other Western Africa (%)
Place of birth for the foreign-born population - Australia (%)
Place of birth for the foreign-born population - New Zealand (%)
Place of birth for the foreign-born population - Fiji (%)
Place of birth for the foreign-born population - Micronesia (%)
Place of birth for the foreign-born population - Bahamas (%)
Place of birth for the foreign-born population - Barbados (%)
Place of birth for the foreign-born population - Cuba (%)
Place of birth for the foreign-born population - Dominica (%)
Place of birth for the foreign-born population - Dominican Republic (%)
Place of birth for the foreign-born population - Grenada (%)
Place of birth for the foreign-born population - Haiti (%)
Place of birth for the foreign-born population - Jamaica (%)
Place of birth for the foreign-born population - St. Vincent and the Grenadines (%)
Place of birth for the foreign-born population - Trinidad and Tobago (%)
Place of birth for the foreign-born population - West Indies (%)
Place of birth for the foreign-born population - Other Caribbean (%)
Place of birth for the foreign-born population - Belize (%)
Place of birth for the foreign-born population - Costa Rica (%)
Place of birth for the foreign-born population - El Salvador (%)
Place of birth for the foreign-born population - Guatemala (%)
Place of birth for the foreign-born population - Honduras (%)
Place of birth for the foreign-born population - Mexico (%)
Place of birth for the foreign-born population - Nicaragua (%)
Place of birth for the foreign-born population - Panama (%)
Place of birth for the foreign-born population - Other Central America (%)
Place of birth for the foreign-born population - Argentina (%)
Place of birth for the foreign-born population - Bolivia (%)
Place of birth for the foreign-born population - Brazil (%)
Place of birth for the foreign-born population - Chile (%)
Place of birth for the foreign-born population - Colombia (%)
Place of birth for the foreign-born population - Ecuador (%)
Place of birth for the foreign-born population - Guyana (%)
Place of birth for the foreign-born population - Peru (%)
Place of birth for the foreign-born population - Uruguay (%)
Place of birth for the foreign-born population - Venezuela (%)
Place of birth for the foreign-born population - Other South America (%)
Place of birth for the foreign-born population - Canada (%)
Place of birth for the foreign-born population - Other Northern America (%)
Place of birth for the foreign-born population - Other (%)
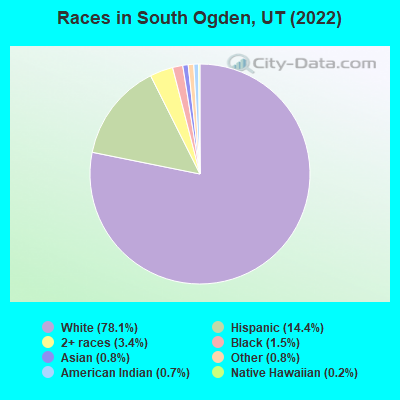
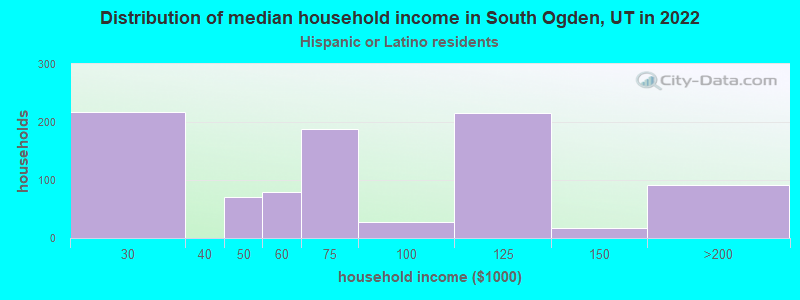
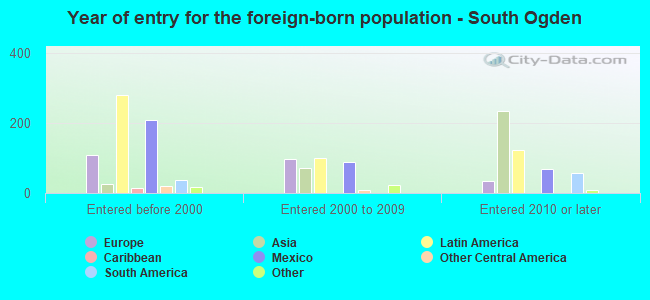
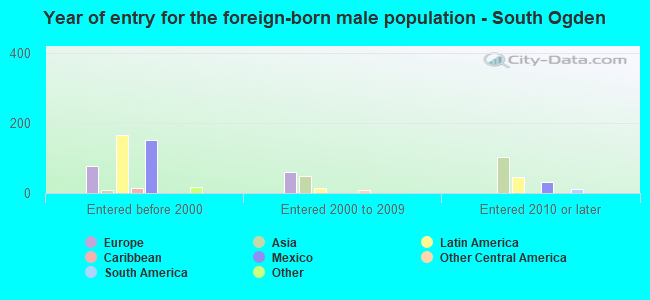
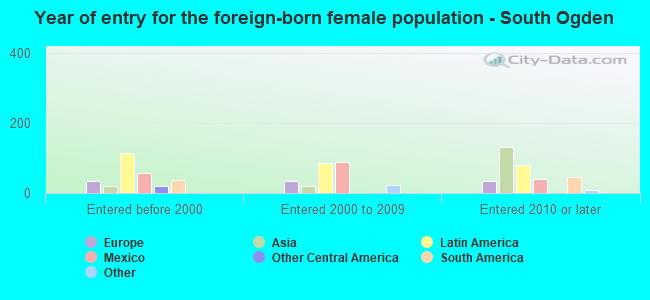
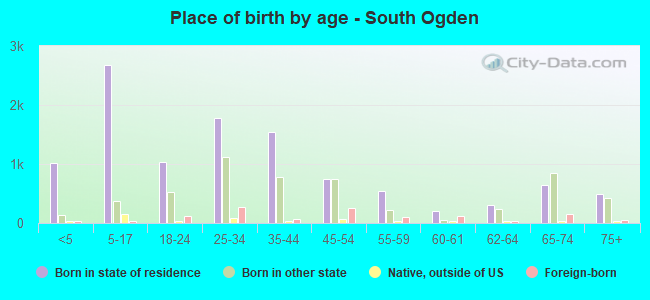
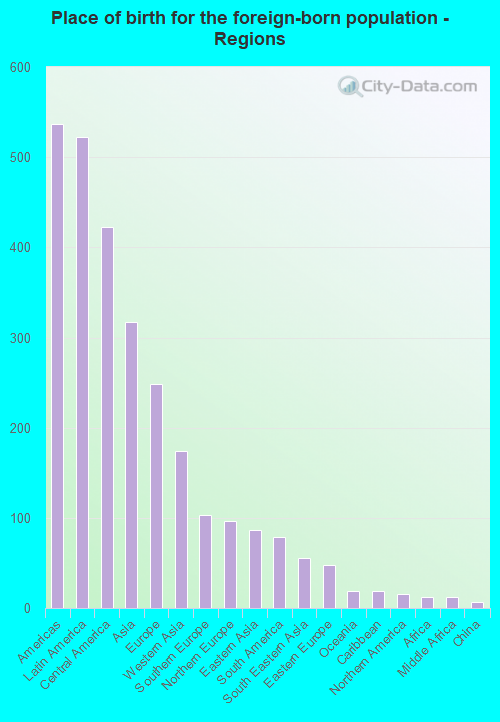
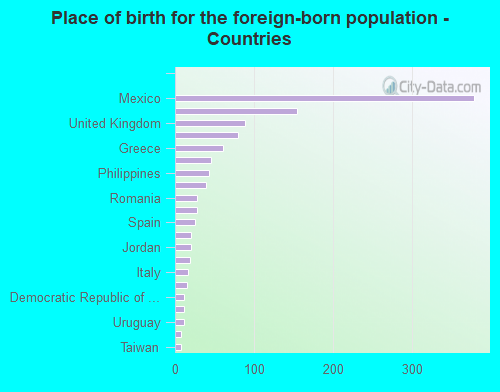
According to 2022 data, the most numerous races in South Ogden, UT are White alone (13,994 residents), Hispanic (2,580 residents), and Two or more races (608 residents). 85.5% of South Ogden residents speak English at home. 6.3% of South Ogden, UT residents are foreign-born (2.8% born in Latin America, 1.7% born in Asia, 1.3% born in Europe), which is 26.2% less than the foreign-born rate of 8.0% across the entire state of Utah.
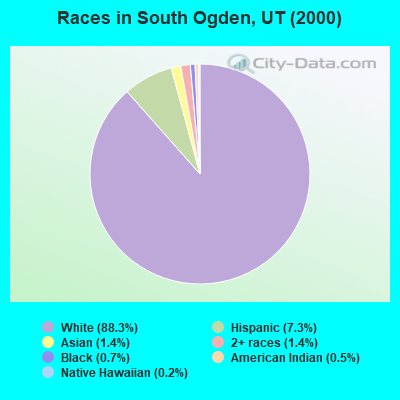
Race distribution in South Ogden
2000 2022
1,904,265 85.3% White alone 201,559 9.0% Hispanic 36,483 1.6% Asian alone 31,308 1.4% Two or more races 26,663 1.2% American Indian alone 14,806 0.7% Native Hawaiian and Other 16,137 0.7% Black alone 1,948 0.09% Other race alone
2,557,466 75.6% White alone 512,086 15.1% Hispanic 119,308 3.5% Two or more races 82,388 2.4% Asian alone 36,978 1.1% Native Hawaiian and Other 34,873 1.0% Black alone 22,803 0.7% American Indian alone 14,898 0.4% Other race alone
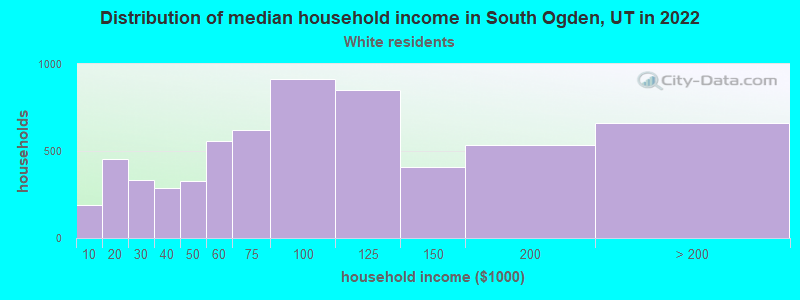
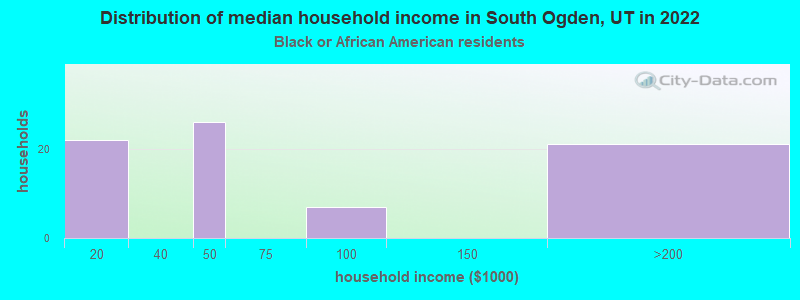
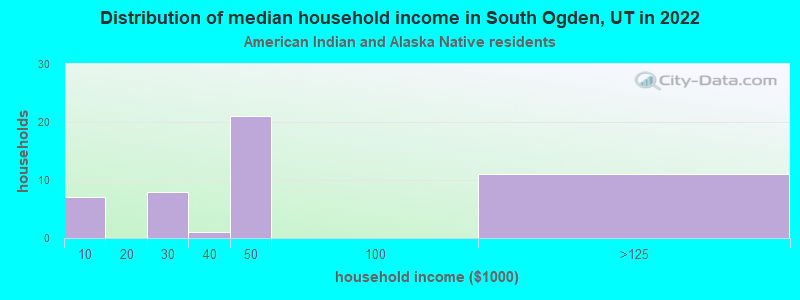
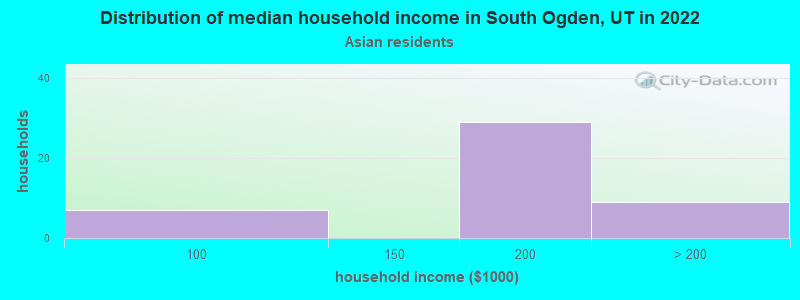
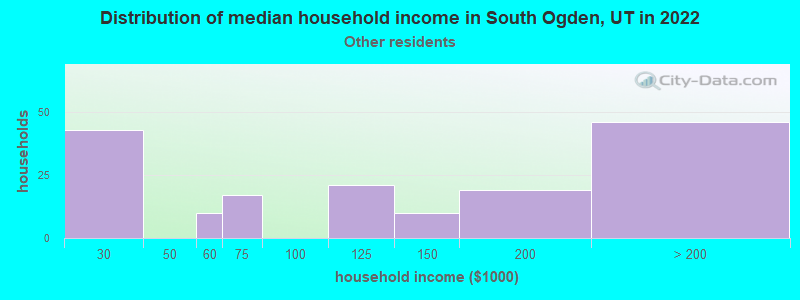
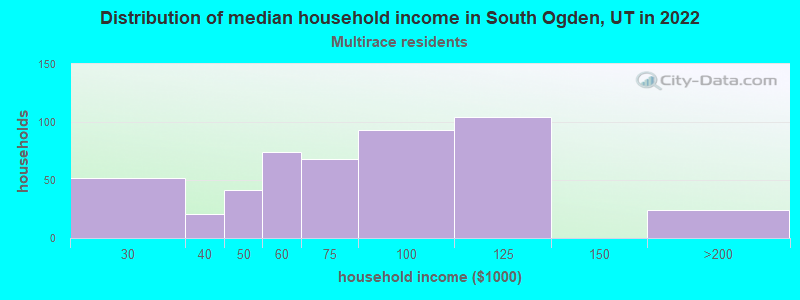
Income and house value in South Ogden Median household income in 2022 $83,032 White non-Hispanic householders$45,688 American Indian and Alaska Native householders$111,117 Asian householders$69,820 Two or more races householders$66,128 Hispanic or Latino race householdersMedian 2022 house value $408,551 White Non-Hispanic householders$249,520 American Indian or Alaska Native householders $405,545 Asian householders$433,203 Some other race householders$429,595 Two or more races householders$395,023 Hispanic or Latino householders
Median age by race in South Ogden
34.0 Median age for White residents33.1 34.8 38.3 Median age for Black or African American residents46.3 37.2 40.6 Median age for American Indian / Alaska Native residents39.7 31.5 34.5 Median age for Asian residents30.1 37.4 33.8 Median age for Native Hawaiian / Pacific Islander residents-1,563,046,190.7 18.4 37.1 Median age for Other race residents36.1 38.5 30.1 Median age for Two or more races residents12.3 41.4 35.1 Median age for White alone residents34.8 35.7 28.3 Median age for Hispanic or Latino residents26.0 29.7
Owner/renter occupied households by race in South Ogden
House owners and renters - White residents 4,258 70.1% Owner occupied1,814 29.9% Renter occupiedHouse owners and renters - Black or African American residents 77 77.2% Owner occupied23 22.8% Renter occupiedHouse owners and renters - American Indian / Alaska Native residents 6 18.7% Owner occupied27 81.3% Renter occupiedHouse owners and renters - Asian residents 27 100.0% Owner occupiedHouse owners and renters - Other race residents 122 90.8% Owner occupied12 9.2% Renter occupiedHouse owners and renters - Two or more races residents 262 56.1% Owner occupied205 43.9% Renter occupiedHouse owners and renters - White alone residents 4,054 71.8% Owner occupied1,593 28.2% Renter occupiedHouse owners and renters - Hispanic or Latino residents 469 52.3% Owner occupied427 47.7% Renter occupied
Language usage in South Ogden
English speakers - Total 85.5% of residents of South Ogden speak English at home.
7.5% of residents speak Spanish at home 810 64.1% Speak English very well453 35.9% Speak English less than very well6.9% of residents speak other language at home 676 58.8% Speak English very well474 41.2% Speak English less than very well
English speakers - Born in the United States 91.8% of residents of South Ogden speak English at home.
5.2% of residents speak Spanish at home 276 100.0% Speak English very well3.0% of residents speak other language at home 137 86.7% Speak English very well21 13.3% Speak English less than very well
English speakers - Native, born elsewhere 60.9% of residents of South Ogden speak English at home.
31.4% of residents speak Spanish at home 114 100.0% Speak English very well
English speakers - Foreign-born 17.3% of residents of South Ogden speak English at home.
45.1% of residents speak Spanish at home 205 41.2% Speak English very well293 58.8% Speak English less than very well35.4% of residents speak other language at home 304 77.7% Speak English very well87 22.3% Speak English less than very well
White (Caucasian) - Speak only English Native:
90.9% (12,596)Foreign-born:
24.2% (147)
White (Caucasian) - Speak another language Native:
8.8% (1,217)Foreign-born:
75.2% (458)
Black or African American - Speak only English Native:
91.5% (261)Foreign-born:
100.0% (11)
Asian - Speak only English Native:
16.2% (2)Foreign-born:
8.8% (15)
Asian - Speak another language Native:
81.3% (10)Foreign-born:
89.5% (151)
Native Hawaiian / Pacific Islander - Speak only English Native:
93.7% (19)Foreign-born:
74.0% (15)
Other race - Speak another language Native:
17.9% (43)Foreign-born:
99.0% (79)
Two or more races - Speak another language Native:
0.6% (5)Foreign-born:
100.0% (93)
White alone - Speak only English Native:
93.1% (11,875)Foreign-born:
41.4% (170)
White alone - Speak another language Native:
6.4% (813)Foreign-born:
45.7% (188)
Hispanic or Latino - Speak only English Native:
69.8% (1,286)Foreign-born:
0.2% (1)
Hispanic or Latino - Speak another language Native:
30.3% (559)Foreign-born:
100.0% (488)
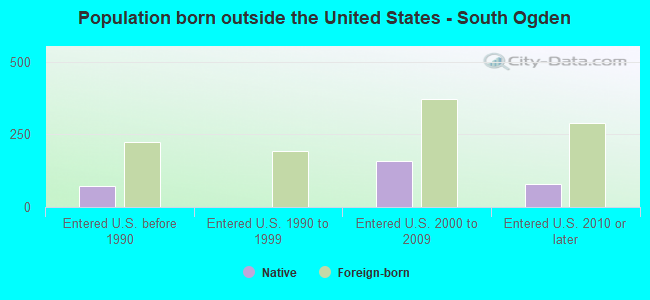
Foreign-born residents in South Ogden 1,136 residents are foreign born (2.8% Latin America , 1.7% Asia , 1.3% Europe ).
Marital status for residents in South Ogden Marital status - White (Caucasian) population 15 years and over
Males 29.9% Never married58.7% Now married1.0% Separated2.1% Widowed8.3% DivorcedFemales 22.9% Never married58.0% Now married1.8% Separated6.7% Widowed10.6% DivorcedWomen who gave birth in the past 12 months Now married:
87.0% (189)Unmarried:
13.0% (28)
Women who did not give birth in the past 12 months Now married:
54.3% (2,022)Unmarried:
45.7% (1,703)
Marital status - Black or African American population 15 years and over
Males 0.0% Never married63.0% Now married0.0% Separated0.0% Widowed37.0% DivorcedFemales 31.9% Never married53.6% Now married0.0% Separated0.0% Widowed14.5% DivorcedWomen who gave birth in the past 12 months Now married:
0.0% (0)Unmarried:
100.0% (18)
Women who did not give birth in the past 12 months Now married:
50.0% (39)Unmarried:
50.0% (39)
Marital status - American Indian / Alaska Native population 15 years and over
Males 47.0% Never married19.1% Now married0.0% Separated10.4% Widowed23.5% DivorcedFemales 43.1% Never married56.9% Now married0.0% Separated0.0% Widowed0.0% DivorcedWomen who did not give birth in the past 12 months Now married:
49.2% (32)Unmarried:
50.8% (33)
Marital status - Asian population 15 years and over
Males 67.3% Never married32.7% Now married0.0% Separated0.0% Widowed0.0% DivorcedFemales 19.2% Never married80.8% Now married0.0% Separated0.0% Widowed0.0% DivorcedWomen who did not give birth in the past 12 months Now married:
75.6% (66)Unmarried:
24.4% (21)
Marital status - Other race population 15 years and over
Males 37.7% Never married62.3% Now married0.0% Separated0.0% Widowed0.0% DivorcedFemales 14.1% Never married23.1% Now married0.0% Separated0.0% Widowed62.8% DivorcedWomen who did not give birth in the past 12 months Now married:
23.1% (39)Unmarried:
76.9% (130)
Marital status - Two or more races population 15 years and over
Males 32.6% Never married42.0% Now married0.0% Separated0.0% Widowed25.4% DivorcedFemales 17.2% Never married42.2% Now married0.0% Separated2.9% Widowed37.8% DivorcedWomen who gave birth in the past 12 months Now married:
100.0% (52)Unmarried:
0.0% (0)
Women who did not give birth in the past 12 months Now married:
48.6% (105)Unmarried:
51.4% (111)
Marital status - White alone, not Hispanic / Latino population 15 years and over
Males 29.2% Never married60.4% Now married1.1% Separated2.3% Widowed7.0% DivorcedFemales 22.4% Never married58.5% Now married1.1% Separated7.3% Widowed10.7% DivorcedWomen who gave birth in the past 12 months Now married:
86.2% (179)Unmarried:
13.8% (29)
Women who did not give birth in the past 12 months Now married:
54.9% (1,838)Unmarried:
45.1% (1,509)
Marital status - Hispanic or Latino population 15 years and over
Males 38.1% Never married39.3% Now married0.0% Separated0.0% Widowed22.6% DivorcedFemales 24.0% Never married50.5% Now married5.5% Separated2.1% Widowed17.9% DivorcedWomen who gave birth in the past 12 months Now married:
100.0% (13)Unmarried:
0.0% (0)
Women who did not give birth in the past 12 months Now married:
51.4% (336)Unmarried:
48.6% (317)
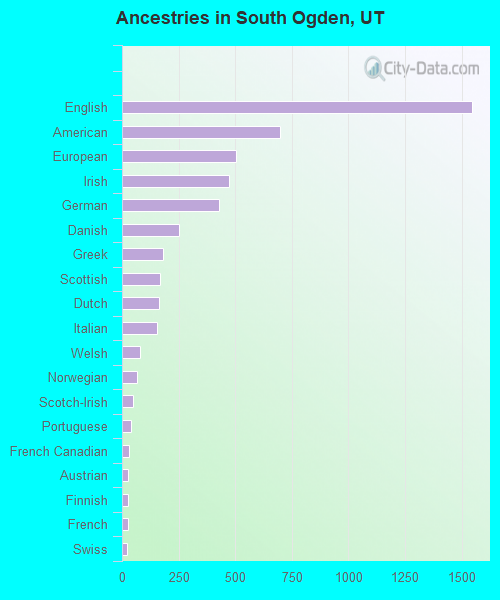
Ancestries in South Ogden
1,544 20.3% English699 9.2% American502 6.6% European471 6.2% Irish428 5.6% German254 3.3% Danish182 2.4% Greek170 2.2% Scottish162 2.1% Dutch154 2.0% Italian81 1.1% Welsh66 0.9% Norwegian50 0.7% Scotch-Irish39 0.5% Portuguese32 0.4% French Canadian28 0.4% Austrian27 0.4% Finnish27 0.4% French23 0.3% Swiss14 0.2% Icelander13 0.2% Belgian12 0.2% Arab9 0.1% Nigerian8 0.1% Northern European7 0.09% British7 0.09% Czech7 0.09% Scandinavian5 0.07% Basque5 0.07% Croatian5 0.07% Hungarian
Children Nativity (place of birth) in South Ogden
Children under 6 years - Living with two parents Both parents native 1,092 100.0% NativeBoth parents foreign-born 94 86.2% Native15 13.8% Foreign-bornOne native, one foreign-born parent 67 100.0% NativeChildren under 6 years - Living with one parent Native parent 199 100.0% NativeForeign-born parent 19 100.0% NativeChildren 6 to 17 years - Living with two parents Both parents native 2,018 99.5% Native10 0.5% Foreign-bornBoth parents foreign-born 185 96.7% Native6 3.3% Foreign-bornOne native, one foreign-born parent 65 100.0% NativeChildren 6 to 17 years - Living with one parent Native parent 462 100.0% NativeForeign-born parent 32 47.3% Native36 52.7% Foreign-born
Grandparents responsible for own grandchildren in South Ogden
Grandparents (30 to 59 years) White / Caucasian 34 42.5% Responsible for grandchildren46 57.5% Not responsible for grandchildrenBlack or African American 11 100.0% Not responsible for grandchildrenTwo or more races 51 100.0% Not responsible for grandchildrenWhite alone, not Hispanic / Latino 32 43.1% Responsible for grandchildren43 56.9% Not responsible for grandchildren
Grandparents (60 years and over) White / Caucasian 92 100.0% Not responsible for grandchildrenWhite alone, not Hispanic / Latino 103 100.0% Not responsible for grandchildren