Races in South Portland, Maine (ME) Detailed Stats
Data:
Races - White alone (%)
Races - White alone (% change since 2000)
Races - Black alone (%)
Races - Black alone (% change since 2000)
Races - American Indian alone (%)
Races - American Indian alone (% change since 2000)
Races - Asian alone (%)
Races - Asian alone (% change since 2000)
Races - Hispanic (%)
Races - Hispanic (% change since 2000)
Races - Native Hawaiian and Other Pacific Islander alone (%)
Races - Native Hawaiian and Other Pacific Islander alone (% change since 2000)
Races - Two or more races(%)
Races - Two or more races(% change since 2000)
Races - Other race alone (%)
Races - Other race alone (% change since 2000)
Racial diversity
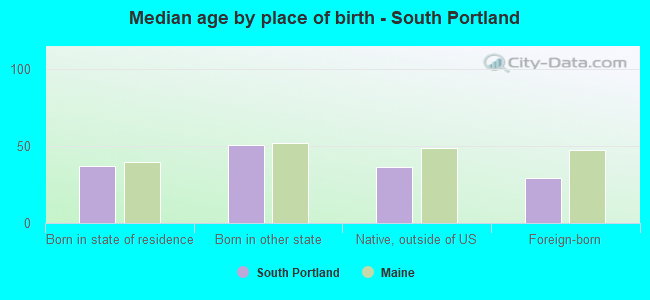
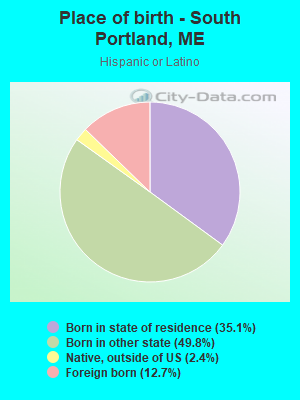
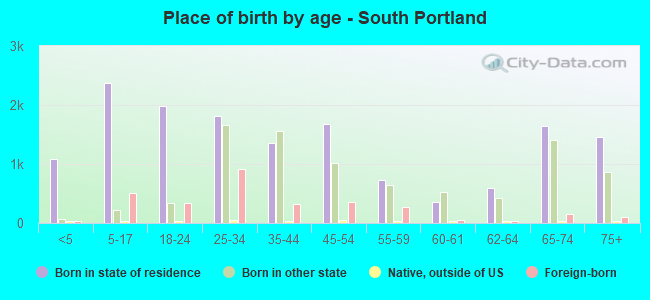
Place of birth - Born in state of residence (%)
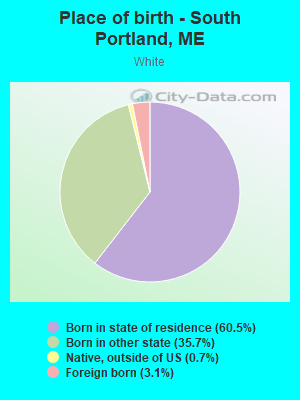
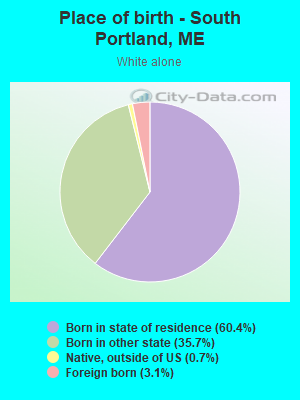
Place of birth - Born in state of residence (%) - White
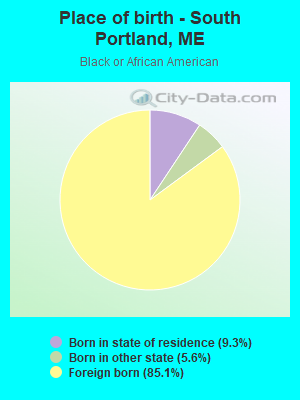
Place of birth - Born in state of residence (%) - Black or African American
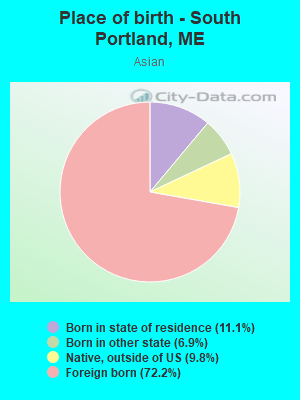
Place of birth - Born in state of residence (%) - Asian
Place of birth - Born in state of residence (%) - Hispanic or Latino
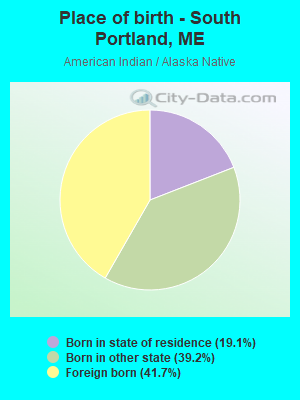
Place of birth - Born in state of residence (%) - American Indian and Alaska Native
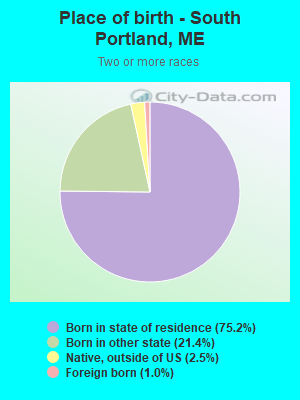
Place of birth - Born in state of residence (%) - Multirace
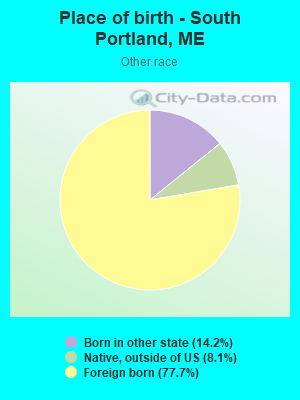
Place of birth - Born in state of residence (%) - Other Race
Place of birth - Born in other state (%)
Place of birth - Born in other state (%) - White
Place of birth - Born in other state (%) - Black or African American
Place of birth - Born in other state (%) - Asian
Place of birth - Born in other state (%) - Hispanic or Latino
Place of birth - Born in other state (%) - American Indian and Alaska Native
Place of birth - Born in other state (%) - Multirace
Place of birth - Born in other state (%) - Other Race
Place of birth - Native, outside of US (%)
Place of birth - Native, outside of US (%) - White
Place of birth - Native, outside of US (%) - Black or African American
Place of birth - Native, outside of US (%) - Asian
Place of birth - Native, outside of US (%) - Hispanic or Latino
Place of birth - Native, outside of US (%) - American Indian and Alaska Native
Place of birth - Native, outside of US (%) - Multirace
Place of birth - Native, outside of US (%) - Other Race
Place of birth - Foreign born (%)
Place of birth - Foreign born (%) - White
Place of birth - Foreign born (%) - Black or African American
Place of birth - Foreign born (%) - Asian
Place of birth - Foreign born (%) - Hispanic or Latino
Place of birth - Foreign born (%) - American Indian and Alaska Native
Place of birth - Foreign born (%) - Multirace
Place of birth - Foreign born (%) - Other Race
Residents speaking English at home (%)
Residents speaking English at home - Born in the United States (%)
Residents speaking English at home - Native, born elsewhere (%)
Residents speaking English at home - Foreign born (%)
Residents speaking Spanish at home (%)
Residents speaking Spanish at home - Born in the United States (%)
Residents speaking Spanish at home - Native, born elsewhere (%)
Residents speaking Spanish at home - Foreign born (%)
Residents speaking other language at home (%)
Residents speaking other language at home - Born in the United States (%)
Residents speaking other language at home - Native, born elsewhere (%)
Residents speaking other language at home - Foreign born (%)
Marital status - Never married (%)
Marital status - Now married (%)
Marital status - Separated (%)
Marital status - Widowed (%)
Marital status - Divorced (%)
Ancestries Reported - Arab (%)
Ancestries Reported - Czech (%)
Ancestries Reported - Danish (%)
Ancestries Reported - Dutch (%)
Ancestries Reported - English (%)
Ancestries Reported - French (%)
Ancestries Reported - French Canadian (%)
Ancestries Reported - German (%)
Ancestries Reported - Greek (%)
Ancestries Reported - Hungarian (%)
Ancestries Reported - Irish (%)
Ancestries Reported - Italian (%)
Ancestries Reported - Lithuanian (%)
Ancestries Reported - Norwegian (%)
Ancestries Reported - Polish (%)
Ancestries Reported - Portuguese (%)
Ancestries Reported - Russian (%)
Ancestries Reported - Scotch-Irish (%)
Ancestries Reported - Scottish (%)
Ancestries Reported - Slovak (%)
Ancestries Reported - Subsaharan African (%)
Ancestries Reported - Swedish (%)
Ancestries Reported - Swiss (%)
Ancestries Reported - Ukrainian (%)
Ancestries Reported - United States (%)
Ancestries Reported - Welsh (%)
Ancestries Reported - West Indian (%)
Ancestries Reported - Other (%)
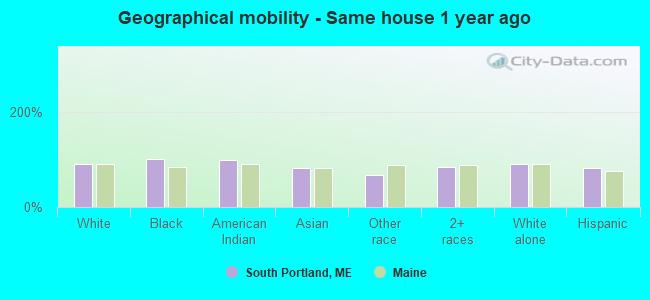
Geographical mobility - Same house 1 year ago (%)
Geographical mobility - Same house 1 year ago (%) - White
Geographical mobility - Same house 1 year ago (%) - Black or African American
Geographical mobility - Same house 1 year ago (%) - Asian
Geographical mobility - Same house 1 year ago (%) - Hispanic or Latino
Geographical mobility - Same house 1 year ago (%) - American Indian and Alaska Native
Geographical mobility - Same house 1 year ago (%) - Multirace
Geographical mobility - Same house 1 year ago (%) - Other Race
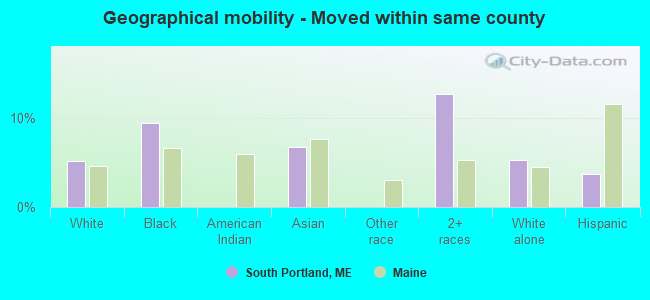
Geographical mobility - Moved within same county (%)
Geographical mobility - Moved within same county (%) - White
Geographical mobility - Moved within same county (%) - Black or African American
Geographical mobility - Moved within same county (%) - Asian
Geographical mobility - Moved within same county (%) - Hispanic or Latino
Geographical mobility - Moved within same county (%) - American Indian and Alaska Native
Geographical mobility - Moved within same county (%) - Multirace
Geographical mobility - Moved within same county (%) - Other Race
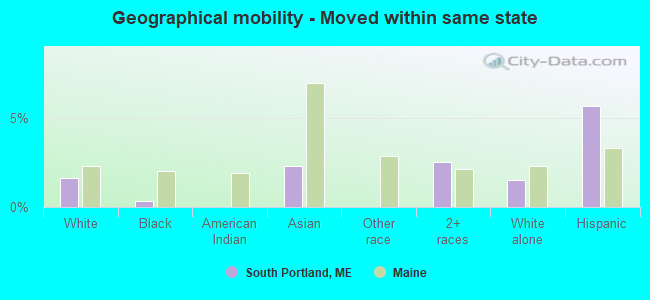
Geographical mobility - Moved from different county within same state (%)
Geographical mobility - Moved from different county within same state (%) - White
Geographical mobility - Moved from different county within same state (%) - Black or African American
Geographical mobility - Moved from different county within same state (%) - Asian
Geographical mobility - Moved from different county within same state (%) - Hispanic or Latino
Geographical mobility - Moved from different county within same state (%) - American Indian and Alaska Native
Geographical mobility - Moved from different county within same state (%) - Multirace
Geographical mobility - Moved from different county within same state (%) - Other Race
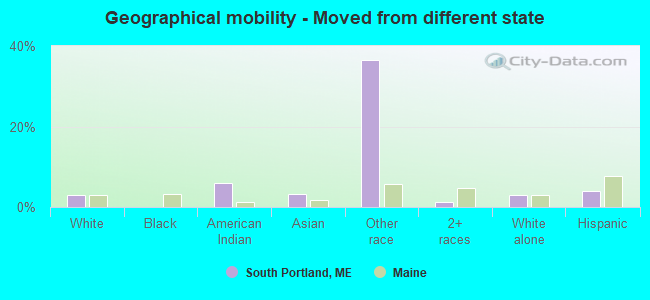
Geographical mobility - Moved from different state (%)
Geographical mobility - Moved from different state (%) - White
Geographical mobility - Moved from different state (%) - Black or African American
Geographical mobility - Moved from different state (%) - Asian
Geographical mobility - Moved from different state (%) - Hispanic or Latino
Geographical mobility - Moved from different state (%) - American Indian and Alaska Native
Geographical mobility - Moved from different state (%) - Multirace
Geographical mobility - Moved from different state (%) - Other Race
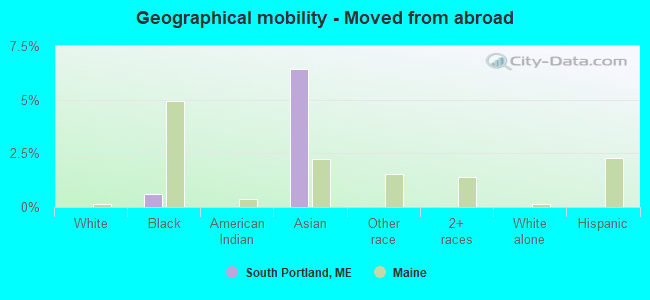
Geographical mobility - Moved from abroad (%)
Geographical mobility - Moved from abroad (%) - White
Geographical mobility - Moved from abroad (%) - Black or African American
Geographical mobility - Moved from abroad (%) - Asian
Geographical mobility - Moved from abroad (%) - Hispanic or Latino
Geographical mobility - Moved from abroad (%) - American Indian and Alaska Native
Geographical mobility - Moved from abroad (%) - Multirace
Geographical mobility - Moved from abroad (%) - Other Race
Place of birth for the foreign-born population - Ireland (%)
Place of birth for the foreign-born population - Denmark (%)
Place of birth for the foreign-born population - Norway (%)
Place of birth for the foreign-born population - Sweden (%)
Place of birth for the foreign-born population - United Kingdom (%)
Place of birth for the foreign-born population - England (%)
Place of birth for the foreign-born population - Scotland (%)
Place of birth for the foreign-born population - Other Northern Europe (%)
Place of birth for the foreign-born population - Austria (%)
Place of birth for the foreign-born population - Belgium (%)
Place of birth for the foreign-born population - France (%)
Place of birth for the foreign-born population - Germany (%)
Place of birth for the foreign-born population - Netherlands (%)
Place of birth for the foreign-born population - Switzerland (%)
Place of birth for the foreign-born population - Other Western Europe (%)
Place of birth for the foreign-born population - Greece (%)
Place of birth for the foreign-born population - Italy (%)
Place of birth for the foreign-born population - Portugal (%)
Place of birth for the foreign-born population - Spain (%)
Place of birth for the foreign-born population - Other Southern Europe (%)
Place of birth for the foreign-born population - Albania (%)
Place of birth for the foreign-born population - Belarus (%)
Place of birth for the foreign-born population - Bosnia and Herzegovina (%)
Place of birth for the foreign-born population - Bulgaria (%)
Place of birth for the foreign-born population - Croatia (%)
Place of birth for the foreign-born population - Czechoslovakia (%)
Place of birth for the foreign-born population - Hungary (%)
Place of birth for the foreign-born population - Latvia (%)
Place of birth for the foreign-born population - Lithuania (%)
Place of birth for the foreign-born population - North Macedonia (Macedonia) (%)
Place of birth for the foreign-born population - Moldova (%)
Place of birth for the foreign-born population - Poland (%)
Place of birth for the foreign-born population - Romania (%)
Place of birth for the foreign-born population - Russia (%)
Place of birth for the foreign-born population - Serbia (%)
Place of birth for the foreign-born population - Ukraine (%)
Place of birth for the foreign-born population - Other Eastern Europe (%)
Place of birth for the foreign-born population - China (%)
Place of birth for the foreign-born population - Hong Kong (%)
Place of birth for the foreign-born population - Taiwan (%)
Place of birth for the foreign-born population - Japan (%)
Place of birth for the foreign-born population - Korea (%)
Place of birth for the foreign-born population - Other Eastern Asia (%)
Place of birth for the foreign-born population - Afghanistan (%)
Place of birth for the foreign-born population - Bangladesh (%)
Place of birth for the foreign-born population - India (%)
Place of birth for the foreign-born population - Iran (%)
Place of birth for the foreign-born population - Kazakhstan (%)
Place of birth for the foreign-born population - Nepal (%)
Place of birth for the foreign-born population - Pakistan (%)
Place of birth for the foreign-born population - Sri Lanka (%)
Place of birth for the foreign-born population - Uzbekistan (%)
Place of birth for the foreign-born population - Other South Central Asia (%)
Place of birth for the foreign-born population - Burma (%)
Place of birth for the foreign-born population - Cambodia (%)
Place of birth for the foreign-born population - Indonesia (%)
Place of birth for the foreign-born population - Laos (%)
Place of birth for the foreign-born population - Malaysia (%)
Place of birth for the foreign-born population - Philippines (%)
Place of birth for the foreign-born population - Singapore (%)
Place of birth for the foreign-born population - Thailand (%)
Place of birth for the foreign-born population - Vietnam (%)
Place of birth for the foreign-born population - Other South Eastern Asia (%)
Place of birth for the foreign-born population - Armenia (%)
Place of birth for the foreign-born population - Iraq (%)
Place of birth for the foreign-born population - Israel (%)
Place of birth for the foreign-born population - Jordan (%)
Place of birth for the foreign-born population - Kuwait (%)
Place of birth for the foreign-born population - Lebanon (%)
Place of birth for the foreign-born population - Saudi Arabia (%)
Place of birth for the foreign-born population - Syria (%)
Place of birth for the foreign-born population - Turkey (%)
Place of birth for the foreign-born population - Yemen (%)
Place of birth for the foreign-born population - Other Western Asia (%)
Place of birth for the foreign-born population - Eritrea (%)
Place of birth for the foreign-born population - Ethiopia (%)
Place of birth for the foreign-born population - Kenya (%)
Place of birth for the foreign-born population - Somalia (%)
Place of birth for the foreign-born population - Uganda (%)
Place of birth for the foreign-born population - Zimbabwe (%)
Place of birth for the foreign-born population - Other Eastern Africa (%)
Place of birth for the foreign-born population - Cameroon (%)
Place of birth for the foreign-born population - Congo (%)
Place of birth for the foreign-born population - Democratic Republic of Congo (Zaire) (%)
Place of birth for the foreign-born population - Other Middle Africa (%)
Place of birth for the foreign-born population - Egypt (%)
Place of birth for the foreign-born population - Morocco (%)
Place of birth for the foreign-born population - Sudan (%)
Place of birth for the foreign-born population - Other Northern Africa (%)
Place of birth for the foreign-born population - South Africa (%)
Place of birth for the foreign-born population - Other Southern Africa (%)
Place of birth for the foreign-born population - Cabo Verde (%)
Place of birth for the foreign-born population - Ghana (%)
Place of birth for the foreign-born population - Liberia (%)
Place of birth for the foreign-born population - Nigeria (%)
Place of birth for the foreign-born population - Senegal (%)
Place of birth for the foreign-born population - Sierra Leone (%)
Place of birth for the foreign-born population - Other Western Africa (%)
Place of birth for the foreign-born population - Australia (%)
Place of birth for the foreign-born population - New Zealand (%)
Place of birth for the foreign-born population - Fiji (%)
Place of birth for the foreign-born population - Micronesia (%)
Place of birth for the foreign-born population - Bahamas (%)
Place of birth for the foreign-born population - Barbados (%)
Place of birth for the foreign-born population - Cuba (%)
Place of birth for the foreign-born population - Dominica (%)
Place of birth for the foreign-born population - Dominican Republic (%)
Place of birth for the foreign-born population - Grenada (%)
Place of birth for the foreign-born population - Haiti (%)
Place of birth for the foreign-born population - Jamaica (%)
Place of birth for the foreign-born population - St. Vincent and the Grenadines (%)
Place of birth for the foreign-born population - Trinidad and Tobago (%)
Place of birth for the foreign-born population - West Indies (%)
Place of birth for the foreign-born population - Other Caribbean (%)
Place of birth for the foreign-born population - Belize (%)
Place of birth for the foreign-born population - Costa Rica (%)
Place of birth for the foreign-born population - El Salvador (%)
Place of birth for the foreign-born population - Guatemala (%)
Place of birth for the foreign-born population - Honduras (%)
Place of birth for the foreign-born population - Mexico (%)
Place of birth for the foreign-born population - Nicaragua (%)
Place of birth for the foreign-born population - Panama (%)
Place of birth for the foreign-born population - Other Central America (%)
Place of birth for the foreign-born population - Argentina (%)
Place of birth for the foreign-born population - Bolivia (%)
Place of birth for the foreign-born population - Brazil (%)
Place of birth for the foreign-born population - Chile (%)
Place of birth for the foreign-born population - Colombia (%)
Place of birth for the foreign-born population - Ecuador (%)
Place of birth for the foreign-born population - Guyana (%)
Place of birth for the foreign-born population - Peru (%)
Place of birth for the foreign-born population - Uruguay (%)
Place of birth for the foreign-born population - Venezuela (%)
Place of birth for the foreign-born population - Other South America (%)
Place of birth for the foreign-born population - Canada (%)
Place of birth for the foreign-born population - Other Northern America (%)
Place of birth for the foreign-born population - Other (%)
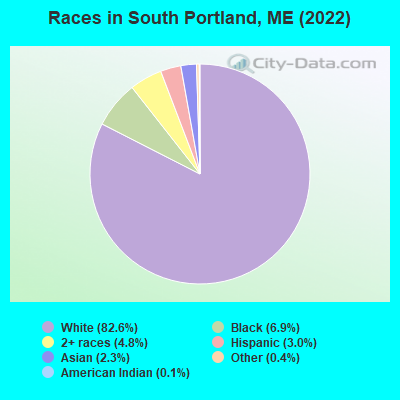
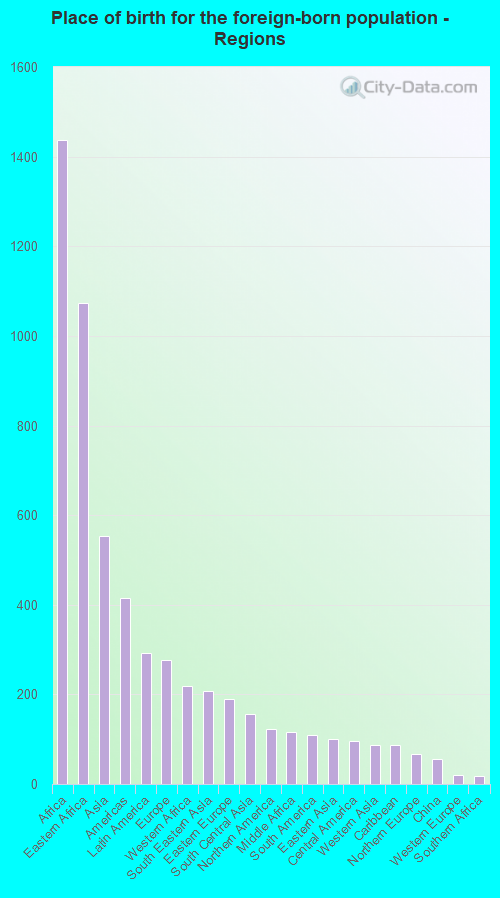
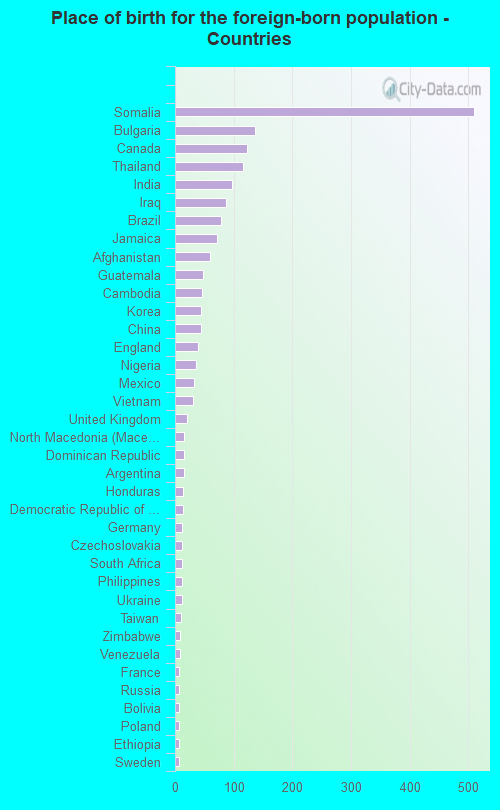
According to 2022 data, the most numerous races in South Portland, ME are White alone (22,325 residents), Two or more races (1,293 residents), and Hispanic (813 residents). 88.4% of South Portland residents speak English at home. 9.9% of South Portland, ME residents are foreign-born (5.3% born in Africa, 2.0% born in Asia, 1.1% born in Latin America, 1.0% born in Europe), which is 69.8% greater than the foreign-born rate of 3.0% across the entire state of Maine.
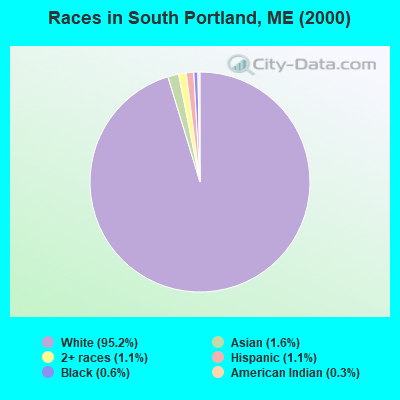
Race distribution in South Portland
2000 2022
1,230,297 96.5% White alone 11,731 0.9% Two or more races 9,360 0.7% Hispanic 9,014 0.7% Asian alone 6,440 0.5% Black alone 6,911 0.5% American Indian alone 836 0.07% Other race alone 334 0.03% Native Hawaiian and Other
1,249,233 90.2% White alone 58,357 4.2% Two or more races 28,717 2.1% Hispanic 21,583 1.6% Black alone 16,151 1.2% Asian alone 5,873 0.4% Other race alone 5,205 0.4% American Indian alone 221 0.02% Native Hawaiian and Other
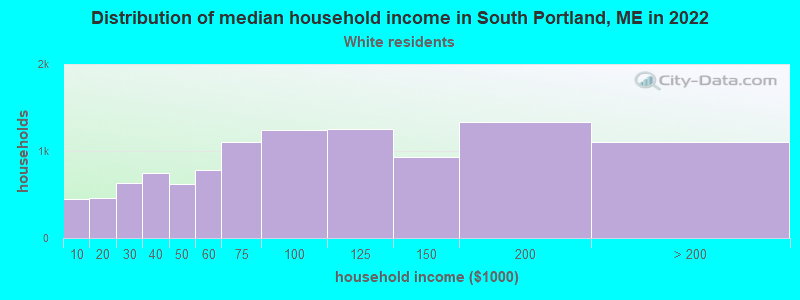
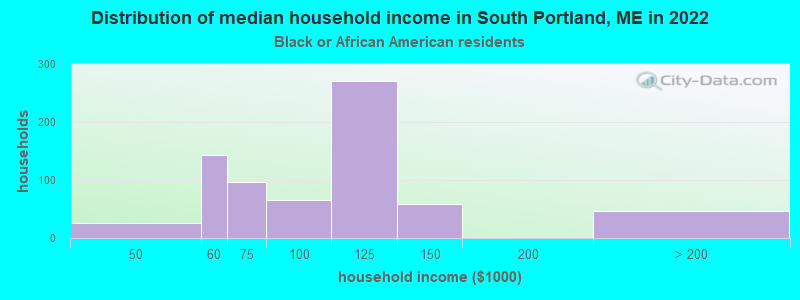
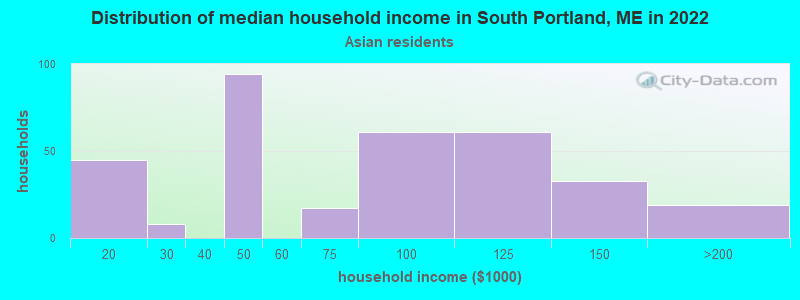
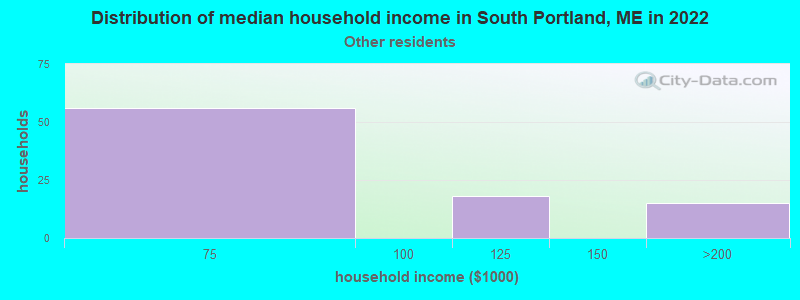
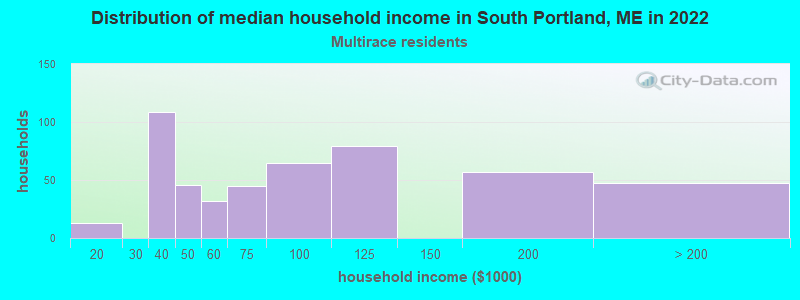
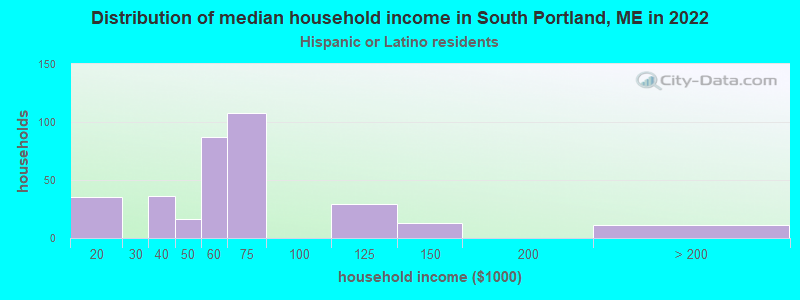
Income and house value in South Portland Median household income in 2022 $87,083 White non-Hispanic householders$104,693 Black householders$96,403 Asian householders$97,489 Two or more races householders$61,825 Hispanic or Latino race householdersMedian 2022 house value $424,363 White Non-Hispanic householders$481,221 Black or African American householders$320,061 American Indian or Alaska Native householders $746,307 Asian householders$572,721 Some other race householders$443,943 Two or more races householders$572,721 Hispanic or Latino householders
Median age by race in South Portland
45.1 Median age for White residents42.6 46.5 32.1 Median age for Black or African American residents37.4 19.6 27.6 Median age for American Indian / Alaska Native residents40.0 13.0 39.3 Median age for Asian residents37.4 40.3 -442,352,940.7 Median age for Native Hawaiian / Pacific Islander residents-668,724,279.2 -453,900,708.8 28.5 Median age for Other race residents-675,347,221.5 24.9 35.7 Median age for Two or more races residents39.5 33.0 45.3 Median age for White alone residents42.8 47.4 26.5 Median age for Hispanic or Latino residents25.0 30.4
Owner/renter occupied households by race in South Portland
House owners and renters - White residents 7,099 66.1% Owner occupied3,640 33.9% Renter occupiedHouse owners and renters - Black or African American residents 60 7.7% Owner occupied723 92.3% Renter occupiedHouse owners and renters - American Indian / Alaska Native residents 26 100.0% Renter occupiedHouse owners and renters - Asian residents 168 70.0% Owner occupied72 30.0% Renter occupiedHouse owners and renters - Other race residents 23 24.4% Owner occupied72 75.6% Renter occupiedHouse owners and renters - Two or more races residents 237 58.8% Owner occupied166 41.2% Renter occupiedHouse owners and renters - White alone residents 7,094 66.6% Owner occupied3,550 33.4% Renter occupiedHouse owners and renters - Hispanic or Latino residents 43 13.1% Owner occupied284 86.9% Renter occupied
Language usage in South Portland
English speakers - Total 88.4% of residents of South Portland speak English at home.
0.5% of residents speak Spanish at home 114 82.6% Speak English very well24 17.4% Speak English less than very well11.5% of residents speak other language at home 1,732 58.5% Speak English very well1,230 41.5% Speak English less than very well
English speakers - Born in the United States 97.8% of residents of South Portland speak English at home.
0.7% of residents speak Spanish at home 50 89.3% Speak English very well6 10.7% Speak English less than very well1.7% of residents speak other language at home 148 100.0% Speak English very well
English speakers - Native, born elsewhere 64.3% of residents of South Portland speak English at home.
2.3% of residents speak Spanish at home 6 100.0% Speak English very well28.7% of residents speak other language at home 74 100.0% Speak English very well
English speakers - Foreign-born 14.5% of residents of South Portland speak English at home.
2.4% of residents speak Spanish at home 52 69.3% Speak English very well23 30.7% Speak English less than very well83.5% of residents speak other language at home 1,605 60.9% Speak English very well1,029 39.1% Speak English less than very well
White (Caucasian) - Speak only English Native:
98.3% (20,723)Foreign-born:
31.2% (221)
White (Caucasian) - Speak another language Native:
1.6% (347)Foreign-born:
70.1% (498)
Black or African American - Speak only English Native:
84.4% (124)Foreign-born:
9.2% (165)
Black or African American - Speak another language Native:
49.5% (73)Foreign-born:
89.4% (1,599)
American Indian / Alaska Native - Speak only English Native:
95.2% (78)Foreign-born:
8.7% (4)
Asian - Speak only English Native:
43.9% (82)Foreign-born:
8.7% (38)
Asian - Speak another language Native:
33.7% (63)Foreign-born:
99.4% (435)
Other race - Speak only English Native:
79.8% (29)Foreign-born:
44.0% (68)
Other race - Speak another language Native:
19.6% (7)Foreign-born:
58.2% (90)
Two or more races - Speak only English Native:
95.8% (1,333)Foreign-born:
100.0% (16)
Two or more races - Speak another language Native:
4.5% (62)Foreign-born:
5.3% (1)
White alone - Speak only English Native:
98.3% (20,471)Foreign-born:
31.3% (220)
White alone - Speak another language Native:
1.7% (349)Foreign-born:
73.2% (513)
Hispanic or Latino - Speak only English Native:
100.0% (658)Foreign-born:
52.2% (52)
Hispanic or Latino - Speak another language Native:
2.4% (16)Foreign-born:
50.4% (50)
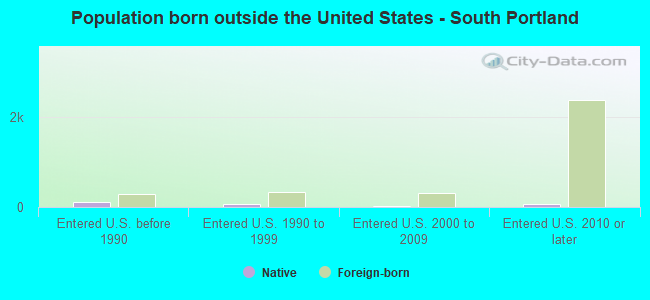
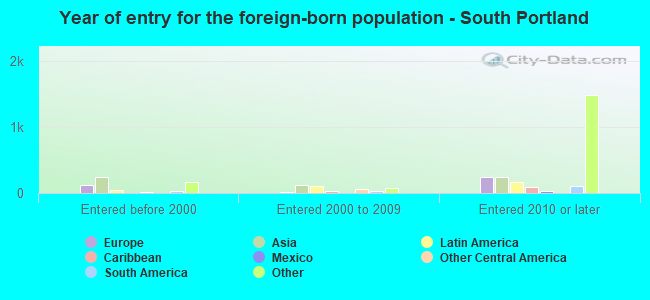
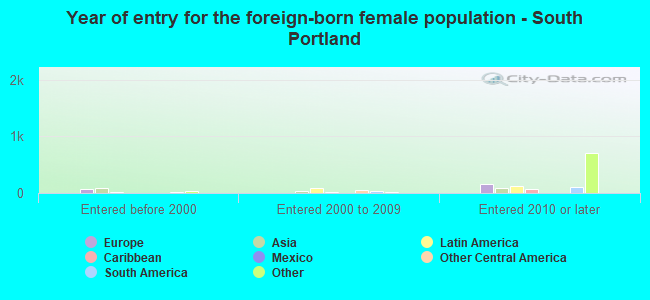
Foreign-born residents in South Portland 2,684 residents are foreign born (5.3% Africa , 2.0% Asia , 1.1% Latin America , 1.0% Europe ).
Marital status for residents in South Portland Marital status - White (Caucasian) population 15 years and over
Males 38.2% Never married46.4% Now married0.8% Separated3.2% Widowed11.5% DivorcedFemales 29.5% Never married43.8% Now married0.8% Separated8.8% Widowed17.1% DivorcedWomen who gave birth in the past 12 months Now married:
100.0% (176)Unmarried:
0.0% (0)
Women who did not give birth in the past 12 months Now married:
42.5% (2,036)Unmarried:
57.5% (2,760)
Marital status - Black or African American population 15 years and over
Males 54.0% Never married33.4% Now married0.0% Separated0.0% Widowed12.6% DivorcedFemales 55.3% Never married33.6% Now married0.0% Separated0.0% Widowed11.1% DivorcedWomen who did not give birth in the past 12 months Now married:
20.7% (105)Unmarried:
79.3% (403)
Marital status - American Indian / Alaska Native population 15 years and over
Males 15.2% Never married84.8% Now married0.0% Separated0.0% Widowed0.0% DivorcedFemales 48.8% Never married51.2% Now married0.0% Separated0.0% Widowed0.0% DivorcedWomen who did not give birth in the past 12 months Now married:
47.5% (21)Unmarried:
52.5% (23)
Marital status - Asian population 15 years and over
Males 39.4% Never married51.4% Now married0.0% Separated0.0% Widowed9.1% DivorcedFemales 41.0% Never married44.8% Now married0.0% Separated0.0% Widowed14.2% DivorcedWomen who gave birth in the past 12 months Now married:
100.0% (10)Unmarried:
0.0% (0)
Women who did not give birth in the past 12 months Now married:
21.6% (38)Unmarried:
78.4% (140)
Marital status - Other race population 15 years and over
Males 44.0% Never married0.0% Now married0.0% Separated56.0% Widowed0.0% DivorcedFemales 32.3% Never married58.9% Now married0.0% Separated0.0% Widowed8.9% DivorcedWomen who did not give birth in the past 12 months Now married:
61.7% (109)Unmarried:
38.3% (68)
Marital status - Two or more races population 15 years and over
Males 37.0% Never married37.0% Now married0.0% Separated0.0% Widowed25.9% DivorcedFemales 45.2% Never married31.8% Now married0.2% Separated15.4% Widowed7.4% DivorcedWomen who did not give birth in the past 12 months Now married:
27.1% (106)Unmarried:
72.9% (285)
Marital status - White alone, not Hispanic / Latino population 15 years and over
Males 38.0% Never married46.5% Now married0.8% Separated3.2% Widowed11.6% DivorcedFemales 29.5% Never married43.5% Now married0.8% Separated8.9% Widowed17.3% DivorcedWomen who gave birth in the past 12 months Now married:
100.0% (177)Unmarried:
0.0% (0)
Women who did not give birth in the past 12 months Now married:
41.9% (1,973)Unmarried:
58.1% (2,732)
Marital status - Hispanic or Latino population 15 years and over
Males 31.9% Never married28.3% Now married0.0% Separated5.1% Widowed34.8% DivorcedFemales 38.0% Never married53.8% Now married0.0% Separated0.0% Widowed8.2% DivorcedWomen who did not give birth in the past 12 months Now married:
53.8% (154)Unmarried:
46.2% (132)
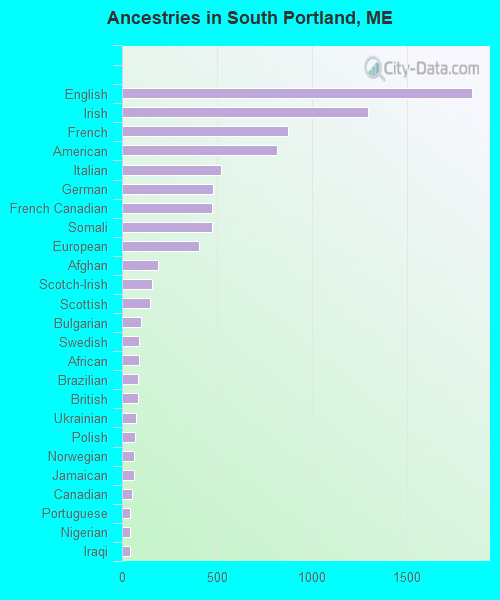
Ancestries in South Portland
1,842 17.3% English1,297 12.2% Irish874 8.2% French818 7.7% American522 4.9% Italian478 4.5% German475 4.5% French Canadian473 4.4% Somali408 3.8% European191 1.8% Afghan157 1.5% Scotch-Irish149 1.4% Scottish99 0.9% Bulgarian92 0.9% Swedish90 0.8% African85 0.8% Brazilian82 0.8% British73 0.7% Ukrainian70 0.7% Polish63 0.6% Norwegian62 0.6% Jamaican54 0.5% Canadian43 0.4% Portuguese42 0.4% Nigerian40 0.4% Iraqi39 0.4% Arab39 0.4% Welsh24 0.2% Armenian23 0.2% Northern European21 0.2% Czech18 0.2% Dutch18 0.2% Hungarian18 0.2% Pennsylvania German17 0.2% Estonian15 0.1% Lebanese14 0.1% Macedonian12 0.1% Latvian9 0.08% Danish9 0.08% Austrian8 0.08% Russian8 0.08% Lithuanian8 0.08% Scandinavian8 0.08% Czechoslovakian5 0.05% Greek1 0.01% Sudanese
Geographical mobility in South Portland Same house 1 year ago 20,173 89.7% White (Caucasian)2,016 100.0% Black or African American107 98.1% American Indian / Alaska Native580 82.0% Asian142 67.3% Other race1,221 84.1% Two or more races19,907 89.7% White alone, not Hispanic / Latino647 82.2% Hispanic or LatinoMoved within same county 1,157 5.1% White / Caucasian184 9.4% Black or African American47 6.7% Asian183 12.6% Two or more races1,163 5.2% White alone, not Hispanic / Latino29 3.7% Hispanic or LatinoMoved within same state 363 1.6% White / Caucasian6 0.3% Black or African American16 2.3% Asian36 2.5% Two or more races341 1.5% White alone, not Hispanic / Latino44 5.6% Hispanic or LatinoMoved from different state 646 2.9% White / Caucasian2 0.1% Black or African American6 6.0% American Indian / Alaska Native22 3.1% Asian77 36.5% Other race17 1.2% Two or more races640 2.9% White alone, not Hispanic / Latino32 4.0% Hispanic or LatinoMoved from abroad 12 0.6% Black or African American45 6.4% Asian
Children Nativity (place of birth) in South Portland
Children under 6 years - Living with two parents Both parents native 753 100.0% NativeBoth parents foreign-born 53 84.1% Native10 15.9% Foreign-bornOne native, one foreign-born parent 127 100.0% NativeChildren under 6 years - Living with one parent Native parent 168 100.0% NativeForeign-born parent 13 100.0% NativeChildren 6 to 17 years - Living with two parents Both parents native 1,264 99.2% Native10 0.8% Foreign-bornBoth parents foreign-born 6 1.7% Native376 98.3% Foreign-bornOne native, one foreign-born parent 92 54.5% Native77 45.5% Foreign-bornChildren 6 to 17 years - Living with one parent Native parent 629 100.0% NativeForeign-born parent 198 67.0% Native97 33.0% Foreign-born
Grandparents responsible for own grandchildren in South Portland
Grandparents (30 to 59 years) White / Caucasian 13 30.6% Responsible for grandchildren29 69.4% Not responsible for grandchildrenWhite alone, not Hispanic / Latino 13 30.6% Responsible for grandchildren29 69.4% Not responsible for grandchildrenGrandparents (60 years and over) White / Caucasian 39 26.7% Responsible for grandchildren107 73.3% Not responsible for grandchildrenWhite alone, not Hispanic / Latino 39 26.6% Responsible for grandchildren108 73.4% Not responsible for grandchildren