Races in South Salt Lake, Utah (UT) Detailed Stats
Data:
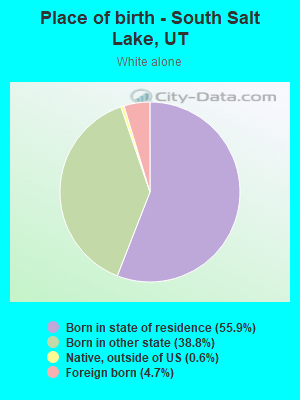
Races - White alone (%)
Races - White alone (% change since 2000)
Races - Black alone (%)
Races - Black alone (% change since 2000)
Races - American Indian alone (%)
Races - American Indian alone (% change since 2000)
Races - Asian alone (%)
Races - Asian alone (% change since 2000)
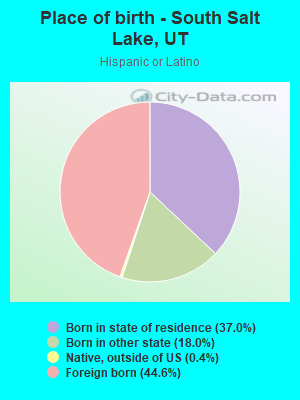
Races - Hispanic (%)
Races - Hispanic (% change since 2000)
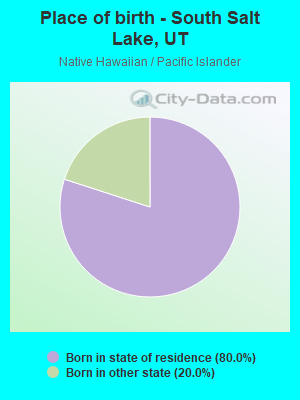
Races - Native Hawaiian and Other Pacific Islander alone (%)
Races - Native Hawaiian and Other Pacific Islander alone (% change since 2000)
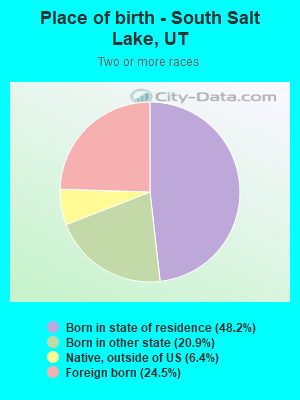
Races - Two or more races(%)
Races - Two or more races(% change since 2000)
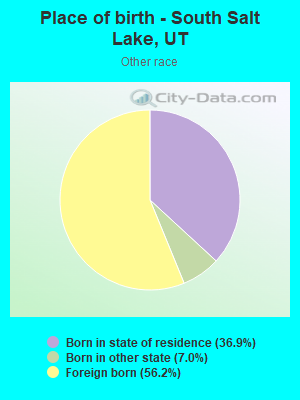
Races - Other race alone (%)
Races - Other race alone (% change since 2000)
Racial diversity
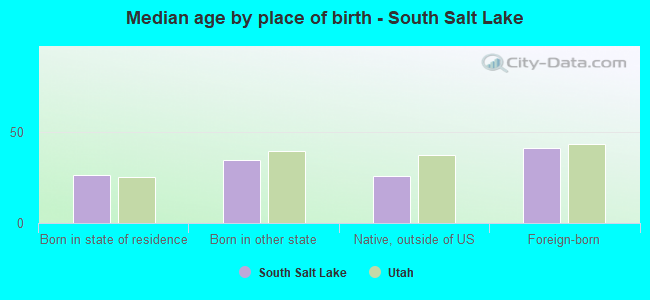
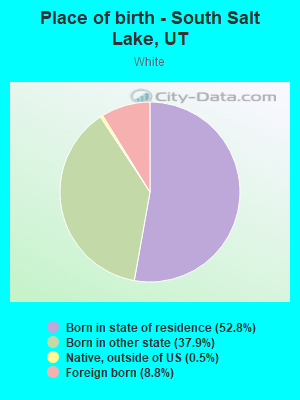
Place of birth - Born in state of residence (%)
Place of birth - Born in state of residence (%) - White
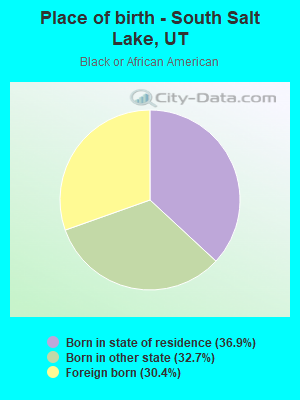
Place of birth - Born in state of residence (%) - Black or African American
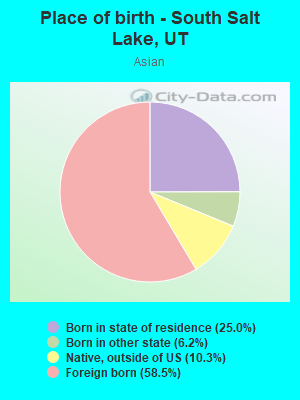
Place of birth - Born in state of residence (%) - Asian
Place of birth - Born in state of residence (%) - Hispanic or Latino
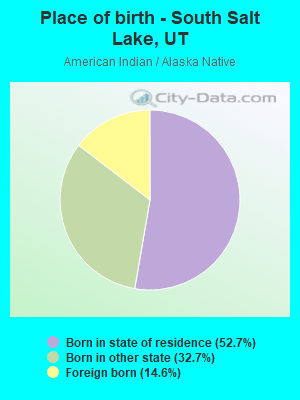
Place of birth - Born in state of residence (%) - American Indian and Alaska Native
Place of birth - Born in state of residence (%) - Multirace
Place of birth - Born in state of residence (%) - Other Race
Place of birth - Born in other state (%)
Place of birth - Born in other state (%) - White
Place of birth - Born in other state (%) - Black or African American
Place of birth - Born in other state (%) - Asian
Place of birth - Born in other state (%) - Hispanic or Latino
Place of birth - Born in other state (%) - American Indian and Alaska Native
Place of birth - Born in other state (%) - Multirace
Place of birth - Born in other state (%) - Other Race
Place of birth - Native, outside of US (%)
Place of birth - Native, outside of US (%) - White
Place of birth - Native, outside of US (%) - Black or African American
Place of birth - Native, outside of US (%) - Asian
Place of birth - Native, outside of US (%) - Hispanic or Latino
Place of birth - Native, outside of US (%) - American Indian and Alaska Native
Place of birth - Native, outside of US (%) - Multirace
Place of birth - Native, outside of US (%) - Other Race
Place of birth - Foreign born (%)
Place of birth - Foreign born (%) - White
Place of birth - Foreign born (%) - Black or African American
Place of birth - Foreign born (%) - Asian
Place of birth - Foreign born (%) - Hispanic or Latino
Place of birth - Foreign born (%) - American Indian and Alaska Native
Place of birth - Foreign born (%) - Multirace
Place of birth - Foreign born (%) - Other Race
Residents speaking English at home (%)
Residents speaking English at home - Born in the United States (%)
Residents speaking English at home - Native, born elsewhere (%)
Residents speaking English at home - Foreign born (%)
Residents speaking Spanish at home (%)
Residents speaking Spanish at home - Born in the United States (%)
Residents speaking Spanish at home - Native, born elsewhere (%)
Residents speaking Spanish at home - Foreign born (%)
Residents speaking other language at home (%)
Residents speaking other language at home - Born in the United States (%)
Residents speaking other language at home - Native, born elsewhere (%)
Residents speaking other language at home - Foreign born (%)
Marital status - Never married (%)
Marital status - Now married (%)
Marital status - Separated (%)
Marital status - Widowed (%)
Marital status - Divorced (%)
Ancestries Reported - Arab (%)
Ancestries Reported - Czech (%)
Ancestries Reported - Danish (%)
Ancestries Reported - Dutch (%)
Ancestries Reported - English (%)
Ancestries Reported - French (%)
Ancestries Reported - French Canadian (%)
Ancestries Reported - German (%)
Ancestries Reported - Greek (%)
Ancestries Reported - Hungarian (%)
Ancestries Reported - Irish (%)
Ancestries Reported - Italian (%)
Ancestries Reported - Lithuanian (%)
Ancestries Reported - Norwegian (%)
Ancestries Reported - Polish (%)
Ancestries Reported - Portuguese (%)
Ancestries Reported - Russian (%)
Ancestries Reported - Scotch-Irish (%)
Ancestries Reported - Scottish (%)
Ancestries Reported - Slovak (%)
Ancestries Reported - Subsaharan African (%)
Ancestries Reported - Swedish (%)
Ancestries Reported - Swiss (%)
Ancestries Reported - Ukrainian (%)
Ancestries Reported - United States (%)
Ancestries Reported - Welsh (%)
Ancestries Reported - West Indian (%)
Ancestries Reported - Other (%)
Geographical mobility - Same house 1 year ago (%)
Geographical mobility - Same house 1 year ago (%) - White
Geographical mobility - Same house 1 year ago (%) - Black or African American
Geographical mobility - Same house 1 year ago (%) - Asian
Geographical mobility - Same house 1 year ago (%) - Hispanic or Latino
Geographical mobility - Same house 1 year ago (%) - American Indian and Alaska Native
Geographical mobility - Same house 1 year ago (%) - Multirace
Geographical mobility - Same house 1 year ago (%) - Other Race
Geographical mobility - Moved within same county (%)
Geographical mobility - Moved within same county (%) - White
Geographical mobility - Moved within same county (%) - Black or African American
Geographical mobility - Moved within same county (%) - Asian
Geographical mobility - Moved within same county (%) - Hispanic or Latino
Geographical mobility - Moved within same county (%) - American Indian and Alaska Native
Geographical mobility - Moved within same county (%) - Multirace
Geographical mobility - Moved within same county (%) - Other Race
Geographical mobility - Moved from different county within same state (%)
Geographical mobility - Moved from different county within same state (%) - White
Geographical mobility - Moved from different county within same state (%) - Black or African American
Geographical mobility - Moved from different county within same state (%) - Asian
Geographical mobility - Moved from different county within same state (%) - Hispanic or Latino
Geographical mobility - Moved from different county within same state (%) - American Indian and Alaska Native
Geographical mobility - Moved from different county within same state (%) - Multirace
Geographical mobility - Moved from different county within same state (%) - Other Race
Geographical mobility - Moved from different state (%)
Geographical mobility - Moved from different state (%) - White
Geographical mobility - Moved from different state (%) - Black or African American
Geographical mobility - Moved from different state (%) - Asian
Geographical mobility - Moved from different state (%) - Hispanic or Latino
Geographical mobility - Moved from different state (%) - American Indian and Alaska Native
Geographical mobility - Moved from different state (%) - Multirace
Geographical mobility - Moved from different state (%) - Other Race
Geographical mobility - Moved from abroad (%)
Geographical mobility - Moved from abroad (%) - White
Geographical mobility - Moved from abroad (%) - Black or African American
Geographical mobility - Moved from abroad (%) - Asian
Geographical mobility - Moved from abroad (%) - Hispanic or Latino
Geographical mobility - Moved from abroad (%) - American Indian and Alaska Native
Geographical mobility - Moved from abroad (%) - Multirace
Geographical mobility - Moved from abroad (%) - Other Race
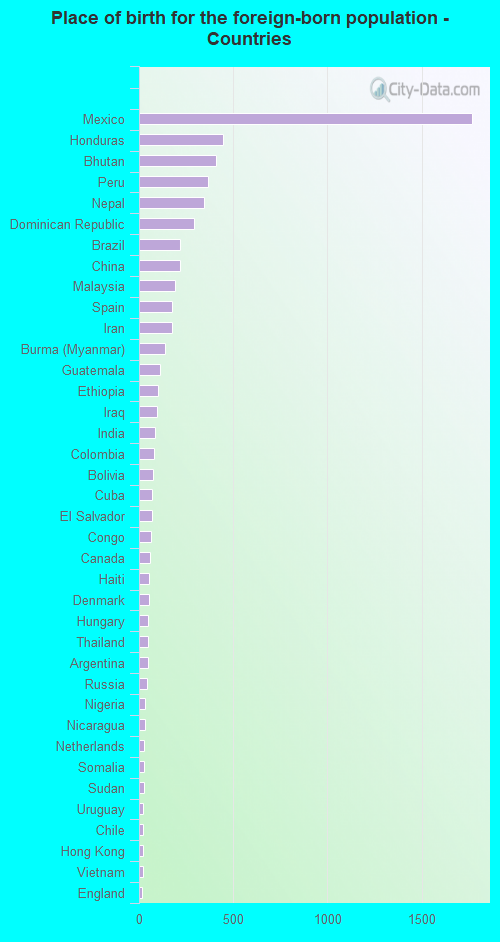
Place of birth for the foreign-born population - Ireland (%)
Place of birth for the foreign-born population - Denmark (%)
Place of birth for the foreign-born population - Norway (%)
Place of birth for the foreign-born population - Sweden (%)
Place of birth for the foreign-born population - United Kingdom (%)
Place of birth for the foreign-born population - England (%)
Place of birth for the foreign-born population - Scotland (%)
Place of birth for the foreign-born population - Other Northern Europe (%)
Place of birth for the foreign-born population - Austria (%)
Place of birth for the foreign-born population - Belgium (%)
Place of birth for the foreign-born population - France (%)
Place of birth for the foreign-born population - Germany (%)
Place of birth for the foreign-born population - Netherlands (%)
Place of birth for the foreign-born population - Switzerland (%)
Place of birth for the foreign-born population - Other Western Europe (%)
Place of birth for the foreign-born population - Greece (%)
Place of birth for the foreign-born population - Italy (%)
Place of birth for the foreign-born population - Portugal (%)
Place of birth for the foreign-born population - Spain (%)
Place of birth for the foreign-born population - Other Southern Europe (%)
Place of birth for the foreign-born population - Albania (%)
Place of birth for the foreign-born population - Belarus (%)
Place of birth for the foreign-born population - Bosnia and Herzegovina (%)
Place of birth for the foreign-born population - Bulgaria (%)
Place of birth for the foreign-born population - Croatia (%)
Place of birth for the foreign-born population - Czechoslovakia (%)
Place of birth for the foreign-born population - Hungary (%)
Place of birth for the foreign-born population - Latvia (%)
Place of birth for the foreign-born population - Lithuania (%)
Place of birth for the foreign-born population - North Macedonia (Macedonia) (%)
Place of birth for the foreign-born population - Moldova (%)
Place of birth for the foreign-born population - Poland (%)
Place of birth for the foreign-born population - Romania (%)
Place of birth for the foreign-born population - Russia (%)
Place of birth for the foreign-born population - Serbia (%)
Place of birth for the foreign-born population - Ukraine (%)
Place of birth for the foreign-born population - Other Eastern Europe (%)
Place of birth for the foreign-born population - China (%)
Place of birth for the foreign-born population - Hong Kong (%)
Place of birth for the foreign-born population - Taiwan (%)
Place of birth for the foreign-born population - Japan (%)
Place of birth for the foreign-born population - Korea (%)
Place of birth for the foreign-born population - Other Eastern Asia (%)
Place of birth for the foreign-born population - Afghanistan (%)
Place of birth for the foreign-born population - Bangladesh (%)
Place of birth for the foreign-born population - India (%)
Place of birth for the foreign-born population - Iran (%)
Place of birth for the foreign-born population - Kazakhstan (%)
Place of birth for the foreign-born population - Nepal (%)
Place of birth for the foreign-born population - Pakistan (%)
Place of birth for the foreign-born population - Sri Lanka (%)
Place of birth for the foreign-born population - Uzbekistan (%)
Place of birth for the foreign-born population - Other South Central Asia (%)
Place of birth for the foreign-born population - Burma (%)
Place of birth for the foreign-born population - Cambodia (%)
Place of birth for the foreign-born population - Indonesia (%)
Place of birth for the foreign-born population - Laos (%)
Place of birth for the foreign-born population - Malaysia (%)
Place of birth for the foreign-born population - Philippines (%)
Place of birth for the foreign-born population - Singapore (%)
Place of birth for the foreign-born population - Thailand (%)
Place of birth for the foreign-born population - Vietnam (%)
Place of birth for the foreign-born population - Other South Eastern Asia (%)
Place of birth for the foreign-born population - Armenia (%)
Place of birth for the foreign-born population - Iraq (%)
Place of birth for the foreign-born population - Israel (%)
Place of birth for the foreign-born population - Jordan (%)
Place of birth for the foreign-born population - Kuwait (%)
Place of birth for the foreign-born population - Lebanon (%)
Place of birth for the foreign-born population - Saudi Arabia (%)
Place of birth for the foreign-born population - Syria (%)
Place of birth for the foreign-born population - Turkey (%)
Place of birth for the foreign-born population - Yemen (%)
Place of birth for the foreign-born population - Other Western Asia (%)
Place of birth for the foreign-born population - Eritrea (%)
Place of birth for the foreign-born population - Ethiopia (%)
Place of birth for the foreign-born population - Kenya (%)
Place of birth for the foreign-born population - Somalia (%)
Place of birth for the foreign-born population - Uganda (%)
Place of birth for the foreign-born population - Zimbabwe (%)
Place of birth for the foreign-born population - Other Eastern Africa (%)
Place of birth for the foreign-born population - Cameroon (%)
Place of birth for the foreign-born population - Congo (%)
Place of birth for the foreign-born population - Democratic Republic of Congo (Zaire) (%)
Place of birth for the foreign-born population - Other Middle Africa (%)
Place of birth for the foreign-born population - Egypt (%)
Place of birth for the foreign-born population - Morocco (%)
Place of birth for the foreign-born population - Sudan (%)
Place of birth for the foreign-born population - Other Northern Africa (%)
Place of birth for the foreign-born population - South Africa (%)
Place of birth for the foreign-born population - Other Southern Africa (%)
Place of birth for the foreign-born population - Cabo Verde (%)
Place of birth for the foreign-born population - Ghana (%)
Place of birth for the foreign-born population - Liberia (%)
Place of birth for the foreign-born population - Nigeria (%)
Place of birth for the foreign-born population - Senegal (%)
Place of birth for the foreign-born population - Sierra Leone (%)
Place of birth for the foreign-born population - Other Western Africa (%)
Place of birth for the foreign-born population - Australia (%)
Place of birth for the foreign-born population - New Zealand (%)
Place of birth for the foreign-born population - Fiji (%)
Place of birth for the foreign-born population - Micronesia (%)
Place of birth for the foreign-born population - Bahamas (%)
Place of birth for the foreign-born population - Barbados (%)
Place of birth for the foreign-born population - Cuba (%)
Place of birth for the foreign-born population - Dominica (%)
Place of birth for the foreign-born population - Dominican Republic (%)
Place of birth for the foreign-born population - Grenada (%)
Place of birth for the foreign-born population - Haiti (%)
Place of birth for the foreign-born population - Jamaica (%)
Place of birth for the foreign-born population - St. Vincent and the Grenadines (%)
Place of birth for the foreign-born population - Trinidad and Tobago (%)
Place of birth for the foreign-born population - West Indies (%)
Place of birth for the foreign-born population - Other Caribbean (%)
Place of birth for the foreign-born population - Belize (%)
Place of birth for the foreign-born population - Costa Rica (%)
Place of birth for the foreign-born population - El Salvador (%)
Place of birth for the foreign-born population - Guatemala (%)
Place of birth for the foreign-born population - Honduras (%)
Place of birth for the foreign-born population - Mexico (%)
Place of birth for the foreign-born population - Nicaragua (%)
Place of birth for the foreign-born population - Panama (%)
Place of birth for the foreign-born population - Other Central America (%)
Place of birth for the foreign-born population - Argentina (%)
Place of birth for the foreign-born population - Bolivia (%)
Place of birth for the foreign-born population - Brazil (%)
Place of birth for the foreign-born population - Chile (%)
Place of birth for the foreign-born population - Colombia (%)
Place of birth for the foreign-born population - Ecuador (%)
Place of birth for the foreign-born population - Guyana (%)
Place of birth for the foreign-born population - Peru (%)
Place of birth for the foreign-born population - Uruguay (%)
Place of birth for the foreign-born population - Venezuela (%)
Place of birth for the foreign-born population - Other South America (%)
Place of birth for the foreign-born population - Canada (%)
Place of birth for the foreign-born population - Other Northern America (%)
Place of birth for the foreign-born population - Other (%)
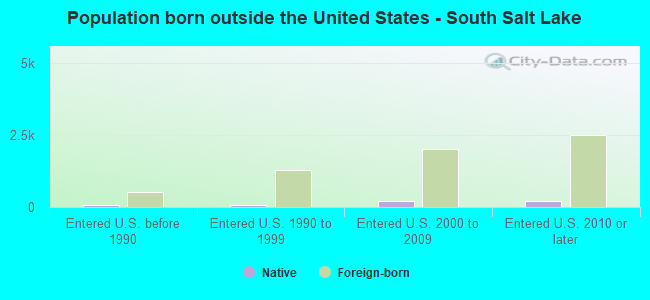
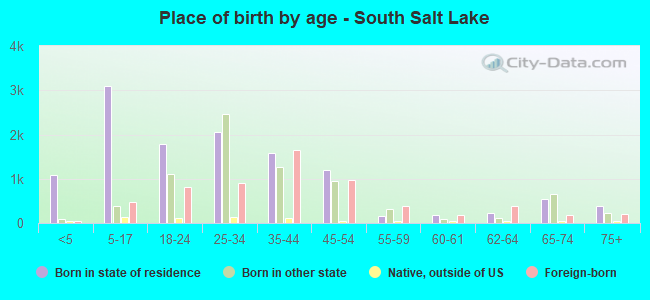
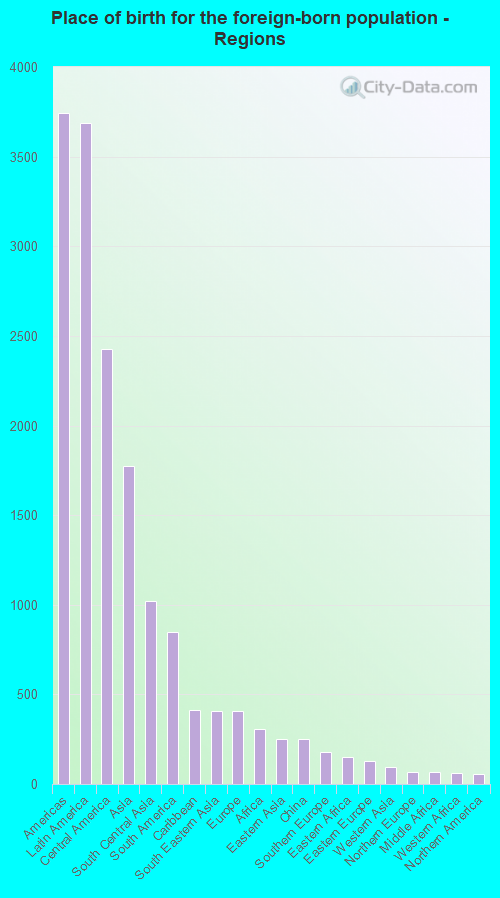
According to 2022 data, the most numerous races in South Salt Lake, UT are White alone (13,136 residents), Hispanic (8,019 residents), and Two or more races (1,141 residents). 66.9% of South Salt Lake residents speak English at home. 23.6% of South Salt Lake, UT residents are foreign-born (13.2% born in Latin America, 6.4% born in Asia), which is 66.1% greater than the foreign-born rate of 8.0% across the entire state of Utah.
Race distribution in South Salt Lake
2000 2022
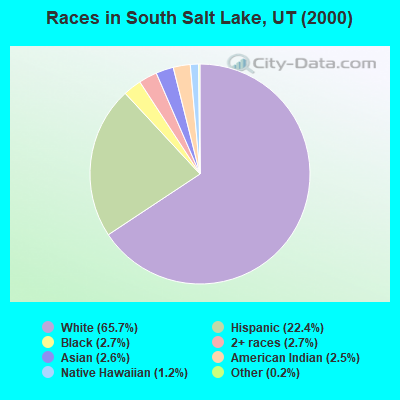
1,904,265 85.3% White alone 201,559 9.0% Hispanic 36,483 1.6% Asian alone 31,308 1.4% Two or more races 26,663 1.2% American Indian alone 14,806 0.7% Native Hawaiian and Other 16,137 0.7% Black alone 1,948 0.09% Other race alone
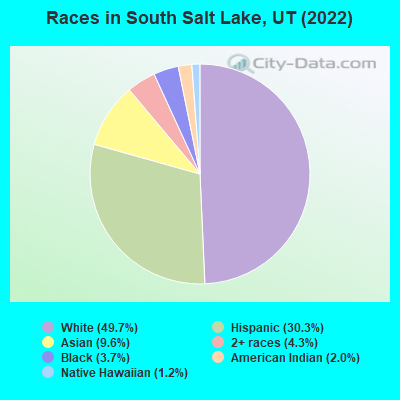
2,557,466 75.6% White alone 512,086 15.1% Hispanic 119,308 3.5% Two or more races 82,388 2.4% Asian alone 36,978 1.1% Native Hawaiian and Other 34,873 1.0% Black alone 22,803 0.7% American Indian alone 14,898 0.4% Other race alone
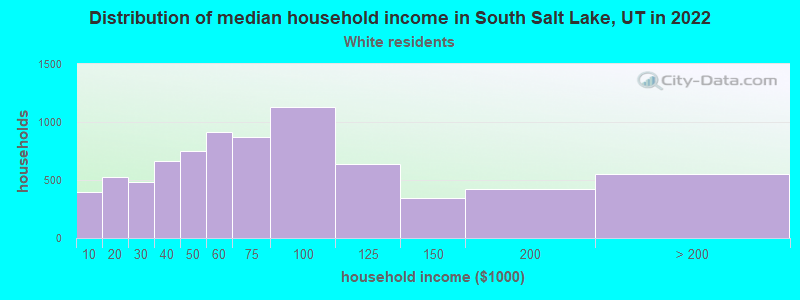
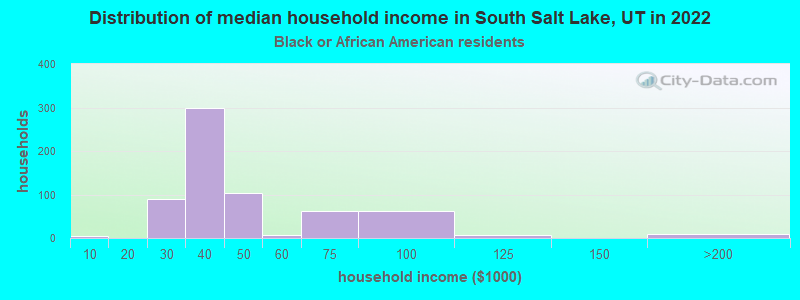
Income and house value in South Salt Lake Median household income in 2022 $67,175 White non-Hispanic householders$57,637 Black householders$58,419 Asian householders$51,062 Some other race householders$51,153 Two or more races householders$55,097 Hispanic or Latino race householdersMedian 2022 house value $438,572 White Non-Hispanic householders$428,293 American Indian or Alaska Native householders $505,576 Asian householders$482,734 Native Hawaiian and other Pacific Islander householders$428,293 Some other race householders$355,959 Two or more races householders$427,532 Hispanic or Latino householders
Median age by race in South Salt Lake
36.1 Median age for White residents35.6 36.9 23.9 Median age for Black or African American residents18.5 28.3 29.2 Median age for American Indian / Alaska Native residents29.7 30.9 27.9 Median age for Asian residents27.5 28.0 19.9 Median age for Native Hawaiian / Pacific Islander residents15.4 21.1 26.8 Median age for Other race residents30.3 24.7 24.7 Median age for Two or more races residents33.0 16.3 35.9 Median age for White alone residents35.5 36.4 27.2 Median age for Hispanic or Latino residents32.6 24.9
Owner/renter occupied households by race in South Salt Lake
House owners and renters - White residents 3,175 40.8% Owner occupied4,611 59.2% Renter occupiedHouse owners and renters - Black or African American residents 97 23.3% Owner occupied318 76.7% Renter occupiedHouse owners and renters - American Indian / Alaska Native residents 80 27.5% Owner occupied212 72.5% Renter occupiedHouse owners and renters - Asian residents 305 40.1% Owner occupied455 59.9% Renter occupiedHouse owners and renters - Native Hawaiian / Pacific Islander residents 63 100.0% Renter occupiedHouse owners and renters - Other race residents 438 50.1% Owner occupied437 49.9% Renter occupiedHouse owners and renters - Two or more races residents 289 34.7% Owner occupied543 65.3% Renter occupiedHouse owners and renters - White alone residents 2,944 42.4% Owner occupied3,991 57.6% Renter occupiedHouse owners and renters - Hispanic or Latino residents 857 35.4% Owner occupied1,566 64.6% Renter occupied
Language usage in South Salt Lake
English speakers - Total 66.9% of residents of South Salt Lake speak English at home.
22.7% of residents speak Spanish at home 2,986 52.0% Speak English very well2,754 48.0% Speak English less than very well11.2% of residents speak other language at home 1,877 66.3% Speak English very well954 33.7% Speak English less than very well
English speakers - Born in the United States 87.8% of residents of South Salt Lake speak English at home.
11.7% of residents speak Spanish at home 714 81.6% Speak English very well161 18.4% Speak English less than very well0.9% of residents speak other language at home 66 100.0% Speak English very well
English speakers - Native, born elsewhere 52.2% of residents of South Salt Lake speak English at home.
14.4% of residents speak Spanish at home 36 46.2% Speak English very well42 53.8% Speak English less than very well27.2% of residents speak other language at home 111 75.5% Speak English very well36 24.5% Speak English less than very well
English speakers - Foreign-born 13.7% of residents of South Salt Lake speak English at home.
52.0% of residents speak Spanish at home 1,160 36.2% Speak English very well2,042 63.8% Speak English less than very well33.7% of residents speak other language at home 1,210 58.3% Speak English very well866 41.7% Speak English less than very well
White (Caucasian) - Speak only English Native:
92.1% (12,310)Foreign-born:
11.5% (153)
White (Caucasian) - Speak another language Native:
7.2% (968)Foreign-born:
83.3% (1,114)
Black or African American - Speak only English Native:
80.6% (661)Foreign-born:
71.0% (276)
Black or African American - Speak another language Native:
8.4% (69)Foreign-born:
42.3% (164)
American Indian / Alaska Native - Speak another language Native:
21.5% (179)Foreign-born:
94.0% (126)
Asian - Speak only English Native:
60.1% (597)Foreign-born:
17.2% (264)
Asian - Speak another language Native:
37.9% (376)Foreign-born:
83.1% (1,272)
Other race - Speak only English Native:
30.0% (364)Foreign-born:
9.3% (165)
Other race - Speak another language Native:
69.4% (840)Foreign-born:
91.0% (1,620)
Two or more races - Speak only English Native:
68.0% (1,408)Foreign-born:
8.1% (62)
Two or more races - Speak another language Native:
32.2% (666)Foreign-born:
92.5% (712)
White alone - Speak only English Native:
96.0% (11,794)Foreign-born:
24.8% (152)
White alone - Speak another language Native:
4.0% (487)Foreign-born:
77.0% (472)
Hispanic or Latino - Speak only English Native:
48.4% (1,901)Foreign-born:
9.7% (344)
Hispanic or Latino - Speak another language Native:
51.3% (2,017)Foreign-born:
90.7% (3,234)
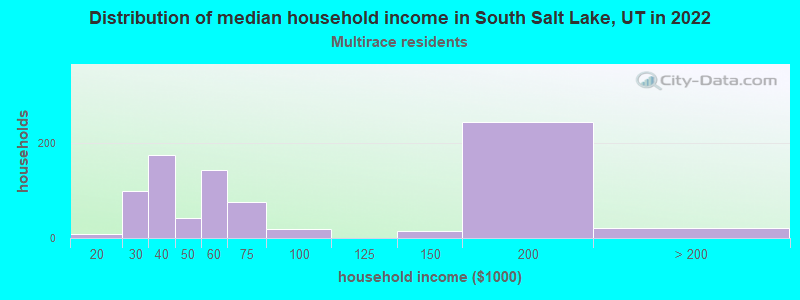
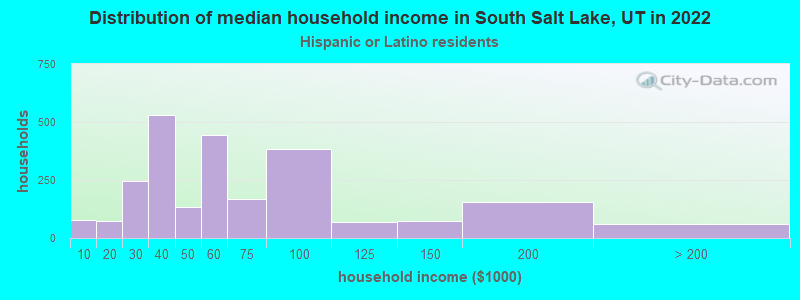
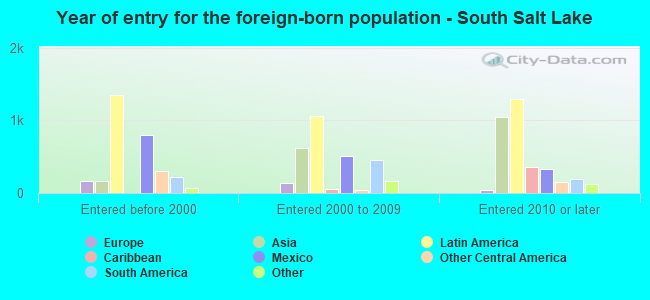
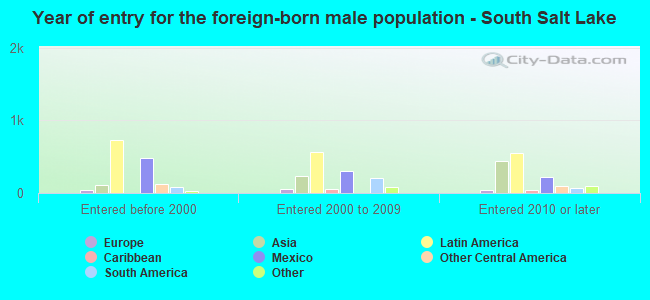
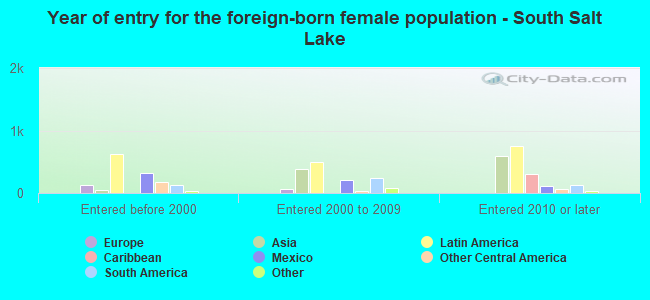
Foreign-born residents in South Salt Lake 6,234 residents are foreign born (13.2% Latin America , 6.4% Asia ).
Marital status for residents in South Salt Lake Marital status - White (Caucasian) population 15 years and over
Males 47.6% Never married31.6% Now married2.6% Separated1.8% Widowed16.3% DivorcedFemales 39.2% Never married33.4% Now married1.7% Separated6.3% Widowed19.5% DivorcedWomen who gave birth in the past 12 months Now married:
100.0% (161)Unmarried:
0.0% (0)
Women who did not give birth in the past 12 months Now married:
34.0% (1,524)Unmarried:
66.0% (2,957)
Marital status - Black or African American population 15 years and over
Males 65.8% Never married17.8% Now married4.3% Separated0.2% Widowed11.9% DivorcedFemales 46.0% Never married34.2% Now married2.2% Separated0.0% Widowed17.6% DivorcedWomen who gave birth in the past 12 months Now married:
100.0% (50)Unmarried:
0.0% (0)
Women who did not give birth in the past 12 months Now married:
23.8% (81)Unmarried:
76.2% (258)
Marital status - American Indian / Alaska Native population 15 years and over
Males 66.2% Never married2.8% Now married0.0% Separated0.0% Widowed31.1% DivorcedFemales 53.4% Never married28.8% Now married0.0% Separated9.6% Widowed8.2% DivorcedWomen who did not give birth in the past 12 months Now married:
12.1% (34)Unmarried:
87.9% (243)
Marital status - Asian population 15 years and over
Males 33.6% Never married46.0% Now married6.2% Separated0.8% Widowed13.4% DivorcedFemales 50.1% Never married36.9% Now married0.0% Separated6.0% Widowed6.9% DivorcedWomen who gave birth in the past 12 months Now married:
100.0% (129)Unmarried:
0.0% (0)
Women who did not give birth in the past 12 months Now married:
29.8% (230)Unmarried:
70.2% (540)
Marital status - Native Hawaiian / Pacific Islander population 15 years and over
Males 77.6% Never married0.0% Now married0.0% Separated0.0% Widowed22.4% DivorcedFemales 61.8% Never married12.5% Now married0.0% Separated25.7% Widowed0.0% DivorcedWomen who did not give birth in the past 12 months Now married:
12.5% (20)Unmarried:
87.5% (137)
Marital status - Other race population 15 years and over
Males 41.8% Never married42.2% Now married4.0% Separated0.0% Widowed12.1% DivorcedFemales 51.3% Never married37.7% Now married2.8% Separated0.0% Widowed8.2% DivorcedWomen who gave birth in the past 12 months Now married:
100.0% (30)Unmarried:
0.0% (0)
Women who did not give birth in the past 12 months Now married:
41.6% (373)Unmarried:
58.4% (525)
Marital status - Two or more races population 15 years and over
Males 43.6% Never married52.5% Now married0.0% Separated0.0% Widowed3.9% DivorcedFemales 55.8% Never married33.3% Now married5.3% Separated0.0% Widowed5.6% DivorcedWomen who did not give birth in the past 12 months Now married:
35.2% (243)Unmarried:
64.8% (447)
Marital status - White alone, not Hispanic / Latino population 15 years and over
Males 46.1% Never married32.8% Now married1.8% Separated2.1% Widowed17.2% DivorcedFemales 34.9% Never married35.1% Now married1.9% Separated6.6% Widowed21.5% DivorcedWomen who gave birth in the past 12 months Now married:
100.0% (165)Unmarried:
0.0% (0)
Women who did not give birth in the past 12 months Now married:
35.6% (1,324)Unmarried:
64.4% (2,397)
Marital status - Hispanic or Latino population 15 years and over
Males 50.8% Never married34.4% Now married4.3% Separated0.0% Widowed10.6% DivorcedFemales 55.0% Never married33.2% Now married1.3% Separated2.0% Widowed8.4% DivorcedWomen who gave birth in the past 12 months Now married:
100.0% (30)Unmarried:
0.0% (0)
Women who did not give birth in the past 12 months Now married:
33.2% (774)Unmarried:
66.8% (1,557)
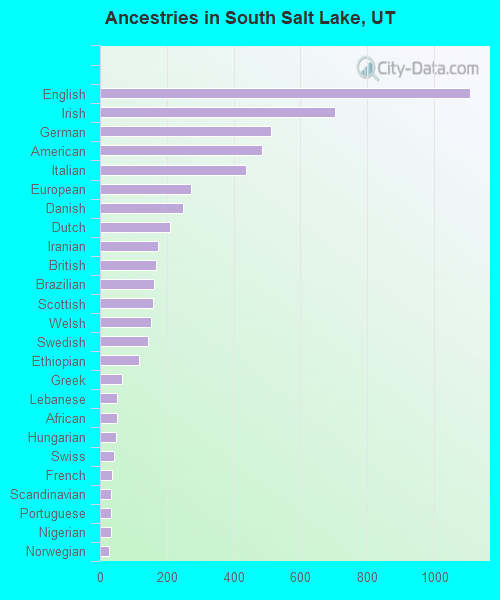
Ancestries in South Salt Lake
1,109 7.0% English702 4.4% Irish512 3.2% German485 3.0% American437 2.7% Italian272 1.7% European247 1.6% Danish209 1.3% Dutch174 1.1% Iranian168 1.1% British162 1.0% Brazilian159 1.0% Scottish152 1.0% Welsh144 0.9% Swedish117 0.7% Ethiopian67 0.4% Greek51 0.3% Lebanese50 0.3% African49 0.3% Hungarian43 0.3% Swiss37 0.2% French33 0.2% Scandinavian32 0.2% Portuguese32 0.2% Nigerian28 0.2% Norwegian23 0.1% Somali21 0.1% Finnish21 0.1% Canadian15 0.09% Scotch-Irish15 0.09% Sudanese14 0.09% Liberian13 0.08% Iraqi13 0.08% Basque11 0.07% Polish11 0.07% Yugoslavian10 0.06% Russian10 0.06% Austrian10 0.06% Belgian5 0.03% Armenian5 0.03% Northern European4 0.03% Australian2 0.01% French Canadian
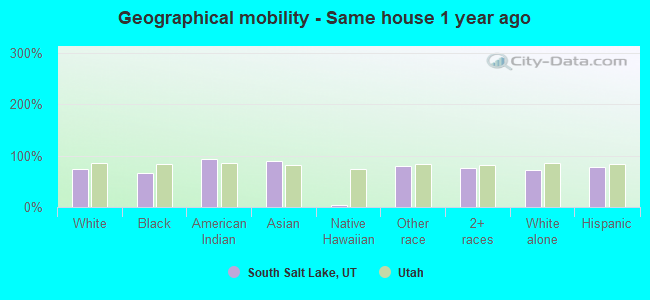
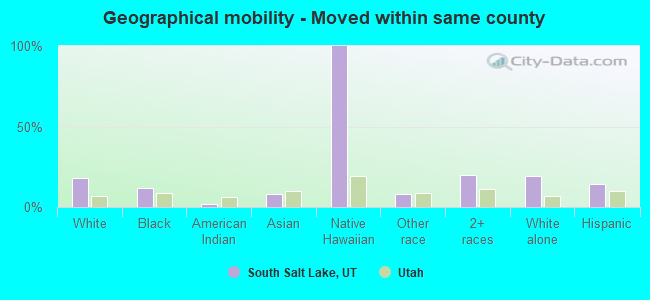
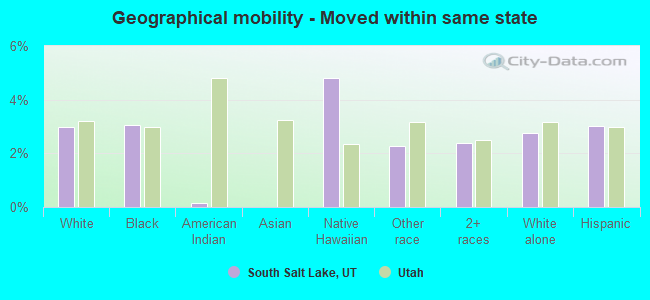
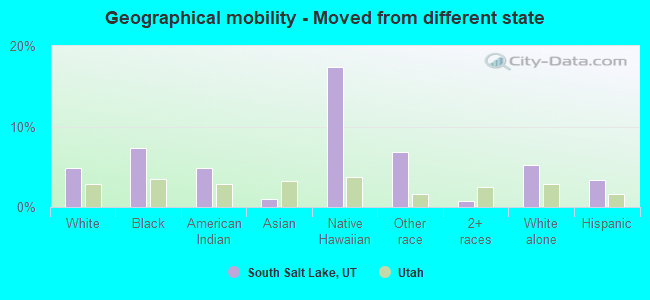
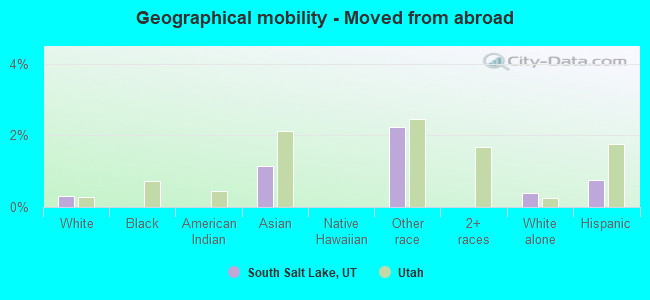
Geographical mobility in South Salt Lake Same house 1 year ago 11,318 73.9% White (Caucasian)838 66.8% Black or African American819 93.4% American Indian / Alaska Native2,279 89.9% Asian13 4.3% Native Hawaiian / Pacific Islander2,480 79.7% Other race2,434 76.6% Two or more races9,473 72.3% White alone, not Hispanic / Latino6,244 78.3% Hispanic or LatinoMoved within same county 2,692 17.6% White / Caucasian156 12.5% Black or African American20 2.2% American Indian / Alaska Native213 8.4% Asian396 100.0% Native Hawaiian / Pacific Islander262 8.4% Other race633 19.9% Two or more races2,446 18.7% White alone, not Hispanic / Latino1,117 14.0% Hispanic or LatinoMoved within same state 457 3.0% White / Caucasian38 3.1% Black or African American1 0.2% American Indian / Alaska Native14 4.8% Native Hawaiian / Pacific Islander71 2.3% Other race75 2.4% Two or more races364 2.8% White alone, not Hispanic / Latino241 3.0% Hispanic or LatinoMoved from different state 750 4.9% White / Caucasian91 7.3% Black or African American43 4.9% American Indian / Alaska Native25 1.0% Asian52 17.4% Native Hawaiian / Pacific Islander214 6.9% Other race24 0.8% Two or more races687 5.2% White alone, not Hispanic / Latino270 3.4% Hispanic or LatinoMoved from abroad 46 0.3% White29 1.1% Asian69 2.2% Other race50 0.4% White alone, not Hispanic / Latino61 0.8% Hispanic or Latino
Children Nativity (place of birth) in South Salt Lake
Children under 6 years - Living with two parents Both parents native 566 100.0% NativeBoth parents foreign-born 267 100.0% NativeOne native, one foreign-born parent 153 100.0% NativeChildren under 6 years - Living with one parent Native parent 315 100.0% NativeForeign-born parent 134 100.0% NativeChildren 6 to 17 years - Living with two parents Both parents native 532 100.0% NativeBoth parents foreign-born 1,026 82.3% Native220 17.7% Foreign-bornOne native, one foreign-born parent 36 100.0% NativeChildren 6 to 17 years - Living with one parent Native parent 1,126 100.0% NativeForeign-born parent 500 54.1% Native425 45.9% Foreign-born
Grandparents responsible for own grandchildren in South Salt Lake
Grandparents (30 to 59 years) White / Caucasian 33 78.9% Responsible for grandchildren9 21.1% Not responsible for grandchildrenNative Hawaiian / Pacific Islander 45 100.0% Responsible for grandchildrenWhite alone, not Hispanic / Latino 20 67.1% Responsible for grandchildren10 32.9% Not responsible for grandchildrenHispanic or Latino 17 100.0% Responsible for grandchildrenGrandparents (60 years and over) White / Caucasian 50 30.0% Responsible for grandchildren117 70.0% Not responsible for grandchildrenWhite alone, not Hispanic / Latino 51 35.7% Responsible for grandchildren91 64.3% Not responsible for grandchildrenHispanic or Latino 76 100.0% Not responsible for grandchildren