Races in South Sanford, Maine (ME) Detailed Stats
According to 2022 data, the most numerous races in South Sanford, ME are White alone (4,373 residents), Two or more races (0 residents), and Hispanic (93 residents). 92.5% of South Sanford residents speak English at home. 1.8% of South Sanford, ME residents are foreign-born , which is 64.9% less than the foreign-born rate of 3.0% across the entire state of Maine.
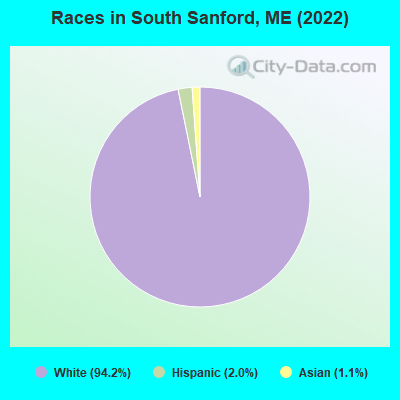
Race distribution in South Sanford
2000 2022
1,230,297 96.5% White alone 11,731 0.9% Two or more races 9,360 0.7% Hispanic 9,014 0.7% Asian alone 6,440 0.5% Black alone 6,911 0.5% American Indian alone 836 0.07% Other race alone 334 0.03% Native Hawaiian and Other
1,249,233 90.2% White alone 58,357 4.2% Two or more races 28,717 2.1% Hispanic 21,583 1.6% Black alone 16,151 1.2% Asian alone 5,873 0.4% Other race alone 5,205 0.4% American Indian alone 221 0.02% Native Hawaiian and Other
Income and house value in South Sanford Median household income in 2022 $78,745 White non-Hispanic householders$105,734 Asian householders$37,896 Two or more races householders$59,177 Hispanic or Latino race householdersMedian 2022 house value $315,900 White Non-Hispanic householders$303,443 American Indian or Alaska Native householders $271,502 Asian householders$271,502 Two or more races householders$303,443 Hispanic or Latino householders
Median age by race in South Sanford
46.1 Median age for White residents44.6 47.5 72.4 Median age for Asian residents45.5 54.4 59.2 Median age for Two or more races residents46.0 Median age for White alone residents44.7 47.5 29.8 Median age for Hispanic or Latino residents
Owner/renter occupied households by race in South Sanford
House owners and renters - White residents 1,422 76.1% Owner occupied447 23.9% Renter occupiedHouse owners and renters - Asian residents 21 100.0% Owner occupiedHouse owners and renters - White alone residents 1,397 76.1% Owner occupied440 23.9% Renter occupiedHouse owners and renters - Hispanic or Latino residents 28 76.1% Owner occupied9 23.9% Renter occupied
Language usage in South Sanford
English speakers - Total 92.5% of residents of South Sanford speak English at home.
0.5% of residents speak Spanish at home 15 75.0% Speak English very well5 25.0% Speak English less than very well6.7% of residents speak other language at home 217 74.8% Speak English very well73 25.2% Speak English less than very well
English speakers - Born in the United States 97.2% of residents of South Sanford speak English at home.
0.4% of residents speak Spanish at home 3 33.3% Speak English very well6 66.7% Speak English less than very well2.4% of residents speak other language at home 44 88.0% Speak English very well6 12.0% Speak English less than very well
English speakers - Native, born elsewhere 90.8% of residents of South Sanford speak English at home.
13.2% of residents speak Spanish at home 10 100.0% Speak English very well
English speakers - Foreign-born 26.0% of residents of South Sanford speak English at home.
70.8% of residents speak other language at home 39 57.4% Speak English very well29 42.6% Speak English less than very well
White (Caucasian) - Speak only English Native:
94.9% (3,882)Foreign-born:
49.2% (24)
White (Caucasian) - Speak another language Native:
4.5% (183)Foreign-born:
46.1% (23)
Asian - Speak another language Native:
26.9% (10)Foreign-born:
95.5% (27)
White alone - Speak only English Native:
95.3% (3,834)Foreign-born:
47.4% (23)
White alone - Speak another language Native:
4.1% (165)Foreign-born:
48.1% (24)
Foreign-born residents in South Sanford 85 residents are foreign born
This city:
1.8%Maine:
100.0%
Marital status for residents in South Sanford Marital status - White (Caucasian) population 15 years and over
Males 29.7% Never married54.7% Now married0.8% Separated3.3% Widowed11.6% DivorcedFemales 25.8% Never married52.0% Now married0.0% Separated8.3% Widowed14.0% DivorcedWomen who gave birth in the past 12 months Now married:
61.6% (47)Unmarried:
38.4% (29)
Women who did not give birth in the past 12 months Now married:
42.8% (359)Unmarried:
57.2% (480)
Marital status - Asian population 15 years and over
Males 52.9% Never married47.1% Now married0.0% Separated0.0% Widowed0.0% DivorcedFemales 0.0% Never married33.3% Now married0.0% Separated33.3% Widowed33.3% DivorcedWomen who gave birth in the past 12 months Now married:
0.0% (0)Unmarried:
100.0% (8)
Marital status - White alone, not Hispanic / Latino population 15 years and over
Males 29.8% Never married54.5% Now married0.8% Separated3.3% Widowed11.6% DivorcedFemales 25.5% Never married52.3% Now married0.0% Separated7.9% Widowed14.2% DivorcedWomen who gave birth in the past 12 months Now married:
70.7% (47)Unmarried:
29.3% (19)
Women who did not give birth in the past 12 months Now married:
42.4% (353)Unmarried:
57.6% (480)
Marital status - Hispanic or Latino population 15 years and over
Males 0.0% Never married100.0% Now married0.0% Separated0.0% Widowed0.0% DivorcedFemales 34.4% Never married40.6% Now married0.0% Separated25.0% Widowed0.0% DivorcedWomen who gave birth in the past 12 months Now married:
0.0% (0)Unmarried:
100.0% (16)
Women who did not give birth in the past 12 months Now married:
100.0% (19)Unmarried:
0.0% (0)
Ancestries in South Sanford
474 22.4% French Canadian281 13.3% English275 13.0% Irish203 9.6% American168 8.0% French132 6.2% Italian56 2.7% German52 2.5% British34 1.6% Canadian26 1.2% Arab22 1.0% European19 0.9% Czech15 0.7% Greek15 0.7% Polish14 0.7% Slovene7 0.3% Swedish3 0.1% Lithuanian
Children Nativity (place of birth) in South Sanford
Children under 6 years - Living with two parents Both parents native 242 100.0% NativeChildren under 6 years - Living with one parent Native parent 94 100.0% NativeChildren 6 to 17 years - Living with two parents Both parents native 319 100.0% NativeChildren 6 to 17 years - Living with one parent Native parent 158 100.0% NativeForeign-born parent 15 48.2% Native16 51.8% Foreign-born
Place of birth for residents in South Sanford 29 Asia29 South Eastern Asia23 Africa23 Northern Africa19 Americas19 Northern America12 Europe12 Northern Europe
Grandparents responsible for own grandchildren in South Sanford
Grandparents (30 to 59 years) White / Caucasian 14 30.0% Responsible for grandchildren32 70.0% Not responsible for grandchildrenWhite alone, not Hispanic / Latino 14 30.7% Responsible for grandchildren32 69.3% Not responsible for grandchildren
Grandparents (60 years and over) White / Caucasian 20 100.0% Not responsible for grandchildrenWhite alone, not Hispanic / Latino 20 100.0% Not responsible for grandchildren