Races in South Valley, New York (NY) Detailed Stats
Ancestries, Foreign-born residents, place of birth

Recent posts about races in South Valley, New York on our local forum with over 2,400,000 registered users:
 | Diversity in the Sedgwick Farms Neighborhood, Syracuse, NY (60 replies) |
| Upper Middle class african-american communities in ny (2058 replies) |
| Functional vs. Beautiful City Design (153 replies) |
| Expand our levitt house vs move to valley stream (53 replies) |
| Sedgwick vs. Strathmore? (29 replies) |
| Aircraft Noise over Nassau County (1563 replies) |
Race distribution in South Valley

- 29698.0%White alone
- 41.3%American Indian alone
- 10.3%Black alone
- 10.3%Asian alone

2000
2022
-
- 11,760,98162.0%White alone
- 2,867,58315.1%Hispanic
- 2,812,62314.8%Black alone
- 1,035,9265.5%Asian alone
- 366,1161.9%Two or more races
- 75,4990.4%Other race alone
- 52,4990.3%American Indian alone
- 5,2300.03%Native Hawaiian and Other
Pacific Islander alone

-
- 10,408,93352.9%White alone
- 3,867,29919.7%Hispanic
- 2,633,84013.4%Black alone
- 1,776,2869.0%Asian alone
- 732,6703.7%Two or more races
- 216,1101.1%Other race alone
- 35,0820.2%American Indian alone
- 6,9310.04%Native Hawaiian and Other
Pacific Islander alone

Income and house value in South Valley
- Median household income in 2022
- $58,543White non-Hispanic householders
- $51,274American Indian and Alaska Native householders
- Median 2022 house value
- $134,613White Non-Hispanic householders
- $156,313American Indian or Alaska Native householders
Household income for White non-Hispanic householders

Household income for American Indian and Alaska Native householders

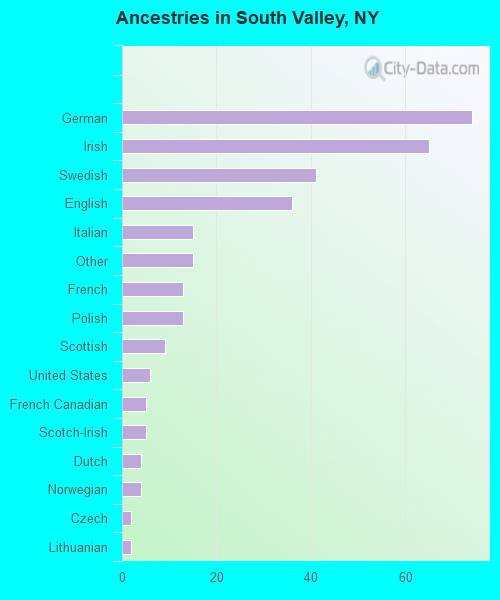
Ancestries in South Valley

- 7423.9%German
- 6521.0%Irish
- 4113.3%Swedish
- 3611.7%English
- 154.9%Italian
- 154.9%Other
- 134.2%French
- 134.2%Polish
- 92.9%Scottish
- 61.9%United States
- 51.6%French Canadian
- 51.6%Scotch-Irish
- 41.3%Dutch
- 41.3%Norwegian
- 20.6%Czech
- 20.6%Lithuanian
Zip codes: 14738.