Races in South Yarmouth, Massachusetts (MA) Detailed Stats
Data:
Races - White alone (%)
Races - White alone (% change since 2000)
Races - Black alone (%)
Races - Black alone (% change since 2000)
Races - American Indian alone (%)
Races - American Indian alone (% change since 2000)
Races - Asian alone (%)
Races - Asian alone (% change since 2000)
Races - Hispanic (%)
Races - Hispanic (% change since 2000)
Races - Native Hawaiian and Other Pacific Islander alone (%)
Races - Native Hawaiian and Other Pacific Islander alone (% change since 2000)
Races - Two or more races(%)
Races - Two or more races(% change since 2000)
Races - Other race alone (%)
Races - Other race alone (% change since 2000)
Racial diversity
Place of birth - Born in state of residence (%)
Place of birth - Born in state of residence (%) - White
Place of birth - Born in state of residence (%) - Black or African American
Place of birth - Born in state of residence (%) - Asian
Place of birth - Born in state of residence (%) - Hispanic or Latino
Place of birth - Born in state of residence (%) - American Indian and Alaska Native
Place of birth - Born in state of residence (%) - Multirace
Place of birth - Born in state of residence (%) - Other Race
Place of birth - Born in other state (%)
Place of birth - Born in other state (%) - White
Place of birth - Born in other state (%) - Black or African American
Place of birth - Born in other state (%) - Asian
Place of birth - Born in other state (%) - Hispanic or Latino
Place of birth - Born in other state (%) - American Indian and Alaska Native
Place of birth - Born in other state (%) - Multirace
Place of birth - Born in other state (%) - Other Race
Place of birth - Native, outside of US (%)
Place of birth - Native, outside of US (%) - White
Place of birth - Native, outside of US (%) - Black or African American
Place of birth - Native, outside of US (%) - Asian
Place of birth - Native, outside of US (%) - Hispanic or Latino
Place of birth - Native, outside of US (%) - American Indian and Alaska Native
Place of birth - Native, outside of US (%) - Multirace
Place of birth - Native, outside of US (%) - Other Race
Place of birth - Foreign born (%)
Place of birth - Foreign born (%) - White
Place of birth - Foreign born (%) - Black or African American
Place of birth - Foreign born (%) - Asian
Place of birth - Foreign born (%) - Hispanic or Latino
Place of birth - Foreign born (%) - American Indian and Alaska Native
Place of birth - Foreign born (%) - Multirace
Place of birth - Foreign born (%) - Other Race
Residents speaking English at home (%)
Residents speaking English at home - Born in the United States (%)
Residents speaking English at home - Native, born elsewhere (%)
Residents speaking English at home - Foreign born (%)
Residents speaking Spanish at home (%)
Residents speaking Spanish at home - Born in the United States (%)
Residents speaking Spanish at home - Native, born elsewhere (%)
Residents speaking Spanish at home - Foreign born (%)
Residents speaking other language at home (%)
Residents speaking other language at home - Born in the United States (%)
Residents speaking other language at home - Native, born elsewhere (%)
Residents speaking other language at home - Foreign born (%)
Marital status - Never married (%)
Marital status - Now married (%)
Marital status - Separated (%)
Marital status - Widowed (%)
Marital status - Divorced (%)
Ancestries Reported - Arab (%)
Ancestries Reported - Czech (%)
Ancestries Reported - Danish (%)
Ancestries Reported - Dutch (%)
Ancestries Reported - English (%)
Ancestries Reported - French (%)
Ancestries Reported - French Canadian (%)
Ancestries Reported - German (%)
Ancestries Reported - Greek (%)
Ancestries Reported - Hungarian (%)
Ancestries Reported - Irish (%)
Ancestries Reported - Italian (%)
Ancestries Reported - Lithuanian (%)
Ancestries Reported - Norwegian (%)
Ancestries Reported - Polish (%)
Ancestries Reported - Portuguese (%)
Ancestries Reported - Russian (%)
Ancestries Reported - Scotch-Irish (%)
Ancestries Reported - Scottish (%)
Ancestries Reported - Slovak (%)
Ancestries Reported - Subsaharan African (%)
Ancestries Reported - Swedish (%)
Ancestries Reported - Swiss (%)
Ancestries Reported - Ukrainian (%)
Ancestries Reported - United States (%)
Ancestries Reported - Welsh (%)
Ancestries Reported - West Indian (%)
Ancestries Reported - Other (%)
Geographical mobility - Same house 1 year ago (%)
Geographical mobility - Same house 1 year ago (%) - White
Geographical mobility - Same house 1 year ago (%) - Black or African American
Geographical mobility - Same house 1 year ago (%) - Asian
Geographical mobility - Same house 1 year ago (%) - Hispanic or Latino
Geographical mobility - Same house 1 year ago (%) - American Indian and Alaska Native
Geographical mobility - Same house 1 year ago (%) - Multirace
Geographical mobility - Same house 1 year ago (%) - Other Race
Geographical mobility - Moved within same county (%)
Geographical mobility - Moved within same county (%) - White
Geographical mobility - Moved within same county (%) - Black or African American
Geographical mobility - Moved within same county (%) - Asian
Geographical mobility - Moved within same county (%) - Hispanic or Latino
Geographical mobility - Moved within same county (%) - American Indian and Alaska Native
Geographical mobility - Moved within same county (%) - Multirace
Geographical mobility - Moved within same county (%) - Other Race
Geographical mobility - Moved from different county within same state (%)
Geographical mobility - Moved from different county within same state (%) - White
Geographical mobility - Moved from different county within same state (%) - Black or African American
Geographical mobility - Moved from different county within same state (%) - Asian
Geographical mobility - Moved from different county within same state (%) - Hispanic or Latino
Geographical mobility - Moved from different county within same state (%) - American Indian and Alaska Native
Geographical mobility - Moved from different county within same state (%) - Multirace
Geographical mobility - Moved from different county within same state (%) - Other Race
Geographical mobility - Moved from different state (%)
Geographical mobility - Moved from different state (%) - White
Geographical mobility - Moved from different state (%) - Black or African American
Geographical mobility - Moved from different state (%) - Asian
Geographical mobility - Moved from different state (%) - Hispanic or Latino
Geographical mobility - Moved from different state (%) - American Indian and Alaska Native
Geographical mobility - Moved from different state (%) - Multirace
Geographical mobility - Moved from different state (%) - Other Race
Geographical mobility - Moved from abroad (%)
Geographical mobility - Moved from abroad (%) - White
Geographical mobility - Moved from abroad (%) - Black or African American
Geographical mobility - Moved from abroad (%) - Asian
Geographical mobility - Moved from abroad (%) - Hispanic or Latino
Geographical mobility - Moved from abroad (%) - American Indian and Alaska Native
Geographical mobility - Moved from abroad (%) - Multirace
Geographical mobility - Moved from abroad (%) - Other Race
Place of birth for the foreign-born population - Ireland (%)
Place of birth for the foreign-born population - Denmark (%)
Place of birth for the foreign-born population - Norway (%)
Place of birth for the foreign-born population - Sweden (%)
Place of birth for the foreign-born population - United Kingdom (%)
Place of birth for the foreign-born population - England (%)
Place of birth for the foreign-born population - Scotland (%)
Place of birth for the foreign-born population - Other Northern Europe (%)
Place of birth for the foreign-born population - Austria (%)
Place of birth for the foreign-born population - Belgium (%)
Place of birth for the foreign-born population - France (%)
Place of birth for the foreign-born population - Germany (%)
Place of birth for the foreign-born population - Netherlands (%)
Place of birth for the foreign-born population - Switzerland (%)
Place of birth for the foreign-born population - Other Western Europe (%)
Place of birth for the foreign-born population - Greece (%)
Place of birth for the foreign-born population - Italy (%)
Place of birth for the foreign-born population - Portugal (%)
Place of birth for the foreign-born population - Spain (%)
Place of birth for the foreign-born population - Other Southern Europe (%)
Place of birth for the foreign-born population - Albania (%)
Place of birth for the foreign-born population - Belarus (%)
Place of birth for the foreign-born population - Bosnia and Herzegovina (%)
Place of birth for the foreign-born population - Bulgaria (%)
Place of birth for the foreign-born population - Croatia (%)
Place of birth for the foreign-born population - Czechoslovakia (%)
Place of birth for the foreign-born population - Hungary (%)
Place of birth for the foreign-born population - Latvia (%)
Place of birth for the foreign-born population - Lithuania (%)
Place of birth for the foreign-born population - North Macedonia (Macedonia) (%)
Place of birth for the foreign-born population - Moldova (%)
Place of birth for the foreign-born population - Poland (%)
Place of birth for the foreign-born population - Romania (%)
Place of birth for the foreign-born population - Russia (%)
Place of birth for the foreign-born population - Serbia (%)
Place of birth for the foreign-born population - Ukraine (%)
Place of birth for the foreign-born population - Other Eastern Europe (%)
Place of birth for the foreign-born population - China (%)
Place of birth for the foreign-born population - Hong Kong (%)
Place of birth for the foreign-born population - Taiwan (%)
Place of birth for the foreign-born population - Japan (%)
Place of birth for the foreign-born population - Korea (%)
Place of birth for the foreign-born population - Other Eastern Asia (%)
Place of birth for the foreign-born population - Afghanistan (%)
Place of birth for the foreign-born population - Bangladesh (%)
Place of birth for the foreign-born population - India (%)
Place of birth for the foreign-born population - Iran (%)
Place of birth for the foreign-born population - Kazakhstan (%)
Place of birth for the foreign-born population - Nepal (%)
Place of birth for the foreign-born population - Pakistan (%)
Place of birth for the foreign-born population - Sri Lanka (%)
Place of birth for the foreign-born population - Uzbekistan (%)
Place of birth for the foreign-born population - Other South Central Asia (%)
Place of birth for the foreign-born population - Burma (%)
Place of birth for the foreign-born population - Cambodia (%)
Place of birth for the foreign-born population - Indonesia (%)
Place of birth for the foreign-born population - Laos (%)
Place of birth for the foreign-born population - Malaysia (%)
Place of birth for the foreign-born population - Philippines (%)
Place of birth for the foreign-born population - Singapore (%)
Place of birth for the foreign-born population - Thailand (%)
Place of birth for the foreign-born population - Vietnam (%)
Place of birth for the foreign-born population - Other South Eastern Asia (%)
Place of birth for the foreign-born population - Armenia (%)
Place of birth for the foreign-born population - Iraq (%)
Place of birth for the foreign-born population - Israel (%)
Place of birth for the foreign-born population - Jordan (%)
Place of birth for the foreign-born population - Kuwait (%)
Place of birth for the foreign-born population - Lebanon (%)
Place of birth for the foreign-born population - Saudi Arabia (%)
Place of birth for the foreign-born population - Syria (%)
Place of birth for the foreign-born population - Turkey (%)
Place of birth for the foreign-born population - Yemen (%)
Place of birth for the foreign-born population - Other Western Asia (%)
Place of birth for the foreign-born population - Eritrea (%)
Place of birth for the foreign-born population - Ethiopia (%)
Place of birth for the foreign-born population - Kenya (%)
Place of birth for the foreign-born population - Somalia (%)
Place of birth for the foreign-born population - Uganda (%)
Place of birth for the foreign-born population - Zimbabwe (%)
Place of birth for the foreign-born population - Other Eastern Africa (%)
Place of birth for the foreign-born population - Cameroon (%)
Place of birth for the foreign-born population - Congo (%)
Place of birth for the foreign-born population - Democratic Republic of Congo (Zaire) (%)
Place of birth for the foreign-born population - Other Middle Africa (%)
Place of birth for the foreign-born population - Egypt (%)
Place of birth for the foreign-born population - Morocco (%)
Place of birth for the foreign-born population - Sudan (%)
Place of birth for the foreign-born population - Other Northern Africa (%)
Place of birth for the foreign-born population - South Africa (%)
Place of birth for the foreign-born population - Other Southern Africa (%)
Place of birth for the foreign-born population - Cabo Verde (%)
Place of birth for the foreign-born population - Ghana (%)
Place of birth for the foreign-born population - Liberia (%)
Place of birth for the foreign-born population - Nigeria (%)
Place of birth for the foreign-born population - Senegal (%)
Place of birth for the foreign-born population - Sierra Leone (%)
Place of birth for the foreign-born population - Other Western Africa (%)
Place of birth for the foreign-born population - Australia (%)
Place of birth for the foreign-born population - New Zealand (%)
Place of birth for the foreign-born population - Fiji (%)
Place of birth for the foreign-born population - Micronesia (%)
Place of birth for the foreign-born population - Bahamas (%)
Place of birth for the foreign-born population - Barbados (%)
Place of birth for the foreign-born population - Cuba (%)
Place of birth for the foreign-born population - Dominica (%)
Place of birth for the foreign-born population - Dominican Republic (%)
Place of birth for the foreign-born population - Grenada (%)
Place of birth for the foreign-born population - Haiti (%)
Place of birth for the foreign-born population - Jamaica (%)
Place of birth for the foreign-born population - St. Vincent and the Grenadines (%)
Place of birth for the foreign-born population - Trinidad and Tobago (%)
Place of birth for the foreign-born population - West Indies (%)
Place of birth for the foreign-born population - Other Caribbean (%)
Place of birth for the foreign-born population - Belize (%)
Place of birth for the foreign-born population - Costa Rica (%)
Place of birth for the foreign-born population - El Salvador (%)
Place of birth for the foreign-born population - Guatemala (%)
Place of birth for the foreign-born population - Honduras (%)
Place of birth for the foreign-born population - Mexico (%)
Place of birth for the foreign-born population - Nicaragua (%)
Place of birth for the foreign-born population - Panama (%)
Place of birth for the foreign-born population - Other Central America (%)
Place of birth for the foreign-born population - Argentina (%)
Place of birth for the foreign-born population - Bolivia (%)
Place of birth for the foreign-born population - Brazil (%)
Place of birth for the foreign-born population - Chile (%)
Place of birth for the foreign-born population - Colombia (%)
Place of birth for the foreign-born population - Ecuador (%)
Place of birth for the foreign-born population - Guyana (%)
Place of birth for the foreign-born population - Peru (%)
Place of birth for the foreign-born population - Uruguay (%)
Place of birth for the foreign-born population - Venezuela (%)
Place of birth for the foreign-born population - Other South America (%)
Place of birth for the foreign-born population - Canada (%)
Place of birth for the foreign-born population - Other Northern America (%)
Place of birth for the foreign-born population - Other (%)
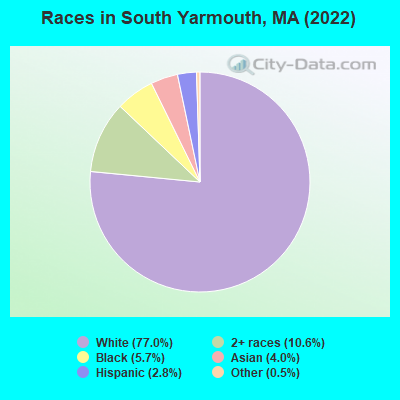
According to 2022 data, the most numerous races in South Yarmouth, MA are White alone (9,206 residents), Hispanic (337 residents), and Asian alone (474 residents). 80.9% of South Yarmouth residents speak English at home. 17.7% of South Yarmouth, MA residents are foreign-born (8.9% born in Latin America, 5.2% born in Europe, 3.4% born in Asia), which is about the same as the foreign-born rate of 18.0% across the entire state of Massachusetts.
Race distribution in South Yarmouth
2000 2022
5,198,359 81.9% White alone 428,729 6.8% Hispanic 318,329 5.0% Black alone 236,786 3.7% Asian alone 110,338 1.7% Two or more races 43,586 0.7% Other race alone 11,264 0.2% American Indian alone 1,706 0.03% Native Hawaiian and Other
4,676,627 67.0% White alone 911,038 13.0% Hispanic 501,463 7.2% Asian alone 459,740 6.6% Black alone 341,889 4.9% Two or more races 84,403 1.2% Other race alone 5,838 0.08% American Indian alone 976 0.01% Native Hawaiian and Other
Income and house value in South Yarmouth Median household income in 2022 $80,535 White non-Hispanic householdersover $200,000 Asian householders$64,039 Two or more races householders$104,284 Hispanic or Latino race householdersMedian 2022 house value $523,545 White Non-Hispanic householders$502,355 Black or African American householders$502,355 American Indian or Alaska Native householders over $1,000,000 Asian householders$593,692 Some other race householders$354,754 Two or more races householders$361,330 Hispanic or Latino householders
Median age by race in South Yarmouth
61.8 Median age for White residents59.2 64.1 33.3 Median age for Black or African American residents34.9 26.0 -490,693,738.9 Median age for American Indian / Alaska Native residents-404,092,071.2 -493,702,770.3 33.9 Median age for Asian residents15.6 34.0 -666,666,666.0 Median age for Native Hawaiian / Pacific Islander residents-666,666,666.0 -666,666,666.0 56.2 Median age for Other race residents52.0 38.3 42.5 Median age for Two or more races residents38.4 53.3 61.6 Median age for White alone residents58.7 64.0 48.2 Median age for Hispanic or Latino residents52.6 37.7
Owner/renter occupied households by race in South Yarmouth
House owners and renters - White residents 3,574 79.6% Owner occupied914 20.4% Renter occupiedHouse owners and renters - Black or African American residents 118 56.5% Owner occupied91 43.5% Renter occupiedHouse owners and renters - Asian residents 41 53.4% Owner occupied36 46.6% Renter occupiedHouse owners and renters - Other race residents 31 36.8% Owner occupied54 63.2% Renter occupiedHouse owners and renters - Two or more races residents 512 88.4% Owner occupied67 11.6% Renter occupiedHouse owners and renters - White alone residents 3,564 79.6% Owner occupied914 20.4% Renter occupiedHouse owners and renters - Hispanic or Latino residents 48 49.7% Owner occupied49 50.3% Renter occupied
Language usage in South Yarmouth
English speakers - Total 80.9% of residents of South Yarmouth speak English at home.
1.7% of residents speak Spanish at home 86 43.2% Speak English very well113 56.8% Speak English less than very well17.6% of residents speak other language at home 1,314 64.8% Speak English very well715 35.2% Speak English less than very well
English speakers - Born in the United States 94.0% of residents of South Yarmouth speak English at home.
1.3% of residents speak Spanish at home 36 100.0% Speak English very well5.5% of residents speak other language at home 147 100.0% Speak English very well
English speakers - Native, born elsewhere 50.5% of residents of South Yarmouth speak English at home.
26.3% of residents speak Spanish at home 26 100.0% Speak English less than very well37.4% of residents speak other language at home 37 100.0% Speak English very well
English speakers - Foreign-born 30.3% of residents of South Yarmouth speak English at home.
4.2% of residents speak Spanish at home 22 27.2% Speak English very well59 72.8% Speak English less than very well64.0% of residents speak other language at home 550 44.2% Speak English very well695 55.8% Speak English less than very well
White (Caucasian) - Speak only English Native:
95.8% (8,042)Foreign-born:
63.6% (318)
White (Caucasian) - Speak another language Native:
4.1% (343)Foreign-born:
38.3% (191)
Black or African American - Speak only English Native:
100.0% (333)Foreign-born:
60.6% (232)
Asian - Speak another language Native:
100.0% (114)Foreign-born:
100.0% (368)
Other race - Speak another language Native:
86.8% (162)Foreign-born:
99.0% (215)
Two or more races - Speak another language Native:
53.9% (349)Foreign-born:
100.0% (685)
White alone - Speak only English Native:
95.6% (8,023)Foreign-born:
57.5% (319)
White alone - Speak another language Native:
4.4% (371)Foreign-born:
41.2% (228)
Hispanic or Latino - Speak another language Native:
63.5% (142)Foreign-born:
96.5% (108)
Foreign-born residents in South Yarmouth 2,122 residents are foreign born (8.9% Latin America , 5.2% Europe , 3.4% Asia ).
This city:
17.7%Massachusetts:
17.6%
Marital status for residents in South Yarmouth Marital status - White (Caucasian) population 15 years and over
Males 38.4% Never married43.9% Now married0.5% Separated8.1% Widowed9.0% DivorcedFemales 21.6% Never married47.6% Now married0.0% Separated15.6% Widowed15.2% DivorcedWomen who gave birth in the past 12 months Now married:
35.4% (17)Unmarried:
64.6% (30)
Women who did not give birth in the past 12 months Now married:
18.7% (179)Unmarried:
81.3% (781)
Marital status - Black or African American population 15 years and over
Males 31.7% Never married68.3% Now married0.0% Separated0.0% Widowed0.0% DivorcedFemales 48.4% Never married38.9% Now married0.0% Separated0.0% Widowed12.7% DivorcedWomen who did not give birth in the past 12 months Now married:
51.3% (115)Unmarried:
48.7% (109)
Marital status - Asian population 15 years and over
Males 41.0% Never married59.0% Now married0.0% Separated0.0% Widowed0.0% DivorcedFemales 39.7% Never married55.3% Now married0.0% Separated5.0% Widowed0.0% DivorcedWomen who did not give birth in the past 12 months Now married:
58.2% (113)Unmarried:
41.8% (81)
Marital status - Other race population 15 years and over
Males 23.6% Never married76.4% Now married0.0% Separated0.0% Widowed0.0% DivorcedFemales 15.7% Never married29.1% Now married17.3% Separated0.0% Widowed37.8% DivorcedWomen who did not give birth in the past 12 months Now married:
27.8% (18)Unmarried:
72.2% (47)
Marital status - Two or more races population 15 years and over
Males 42.0% Never married58.0% Now married0.0% Separated0.0% Widowed0.0% DivorcedFemales 43.8% Never married42.3% Now married0.0% Separated0.0% Widowed13.9% DivorcedWomen who did not give birth in the past 12 months Now married:
46.6% (151)Unmarried:
53.4% (173)
Marital status - White alone, not Hispanic / Latino population 15 years and over
Males 38.3% Never married44.0% Now married0.5% Separated8.1% Widowed9.1% DivorcedFemales 21.3% Never married48.0% Now married0.0% Separated15.5% Widowed15.3% DivorcedWomen who gave birth in the past 12 months Now married:
35.4% (17)Unmarried:
64.6% (31)
Women who did not give birth in the past 12 months Now married:
19.1% (180)Unmarried:
80.9% (765)
Marital status - Hispanic or Latino population 15 years and over
Males 11.4% Never married88.6% Now married0.0% Separated0.0% Widowed0.0% DivorcedFemales 33.1% Never married29.8% Now married17.7% Separated10.5% Widowed8.9% DivorcedWomen who did not give birth in the past 12 months Now married:
22.4% (15)Unmarried:
77.6% (53)
Ancestries in South Yarmouth
928 15.5% Irish836 13.9% English628 10.5% Brazilian591 9.9% Jamaican587 9.8% Italian424 7.1% American257 4.3% Scottish235 3.9% German117 2.0% French Canadian91 1.5% European88 1.5% Swedish70 1.2% Bulgarian63 1.1% French54 0.9% Albanian53 0.9% Cape Verdean52 0.9% Portuguese51 0.9% Polish47 0.8% Scotch-Irish41 0.7% Lebanese37 0.6% Ukrainian36 0.6% Armenian35 0.6% Finnish34 0.6% Greek32 0.5% British22 0.4% Norwegian22 0.4% Swiss21 0.4% Russian20 0.3% Syrian12 0.2% Danish11 0.2% Slovak8 0.1% Eastern European1 0.02% Lithuanian
Children Nativity (place of birth) in South Yarmouth
Children under 6 years - Living with two parents Both parents native 24 100.0% NativeBoth parents foreign-born 209 100.0% NativeChildren under 6 years - Living with one parent Native parent 227 100.0% NativeChildren 6 to 17 years - Living with two parents Both parents native 115 100.0% NativeBoth parents foreign-born 270 79.4% Native70 20.6% Foreign-bornOne native, one foreign-born parent 27 100.0% NativeChildren 6 to 17 years - Living with one parent Native parent 326 97.3% Native9 2.7% Foreign-bornForeign-born parent 8 100.0% Native
Grandparents responsible for own grandchildren in South Yarmouth
Grandparents (30 to 59 years) White / Caucasian 52 64.1% Responsible for grandchildren29 35.9% Not responsible for grandchildrenBlack or African American 2 100.0% Not responsible for grandchildrenTwo or more races 52 100.0% Responsible for grandchildrenWhite alone, not Hispanic / Latino 52 62.8% Responsible for grandchildren31 37.2% Not responsible for grandchildrenGrandparents (60 years and over) White / Caucasian 83 51.3% Responsible for grandchildren79 48.7% Not responsible for grandchildrenBlack or African American 27 100.0% Not responsible for grandchildrenTwo or more races 103 100.0% Responsible for grandchildrenWhite alone, not Hispanic / Latino 83 51.3% Responsible for grandchildren79 48.7% Not responsible for grandchildren