Races in Southaven, Mississippi (MS) Detailed Stats
Data:
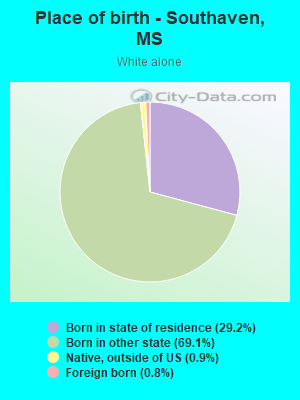
Races - White alone (%)
Races - White alone (% change since 2000)
Races - Black alone (%)
Races - Black alone (% change since 2000)
Races - American Indian alone (%)
Races - American Indian alone (% change since 2000)
Races - Asian alone (%)
Races - Asian alone (% change since 2000)
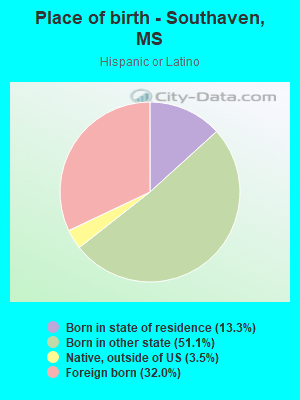
Races - Hispanic (%)
Races - Hispanic (% change since 2000)
Races - Native Hawaiian and Other Pacific Islander alone (%)
Races - Native Hawaiian and Other Pacific Islander alone (% change since 2000)
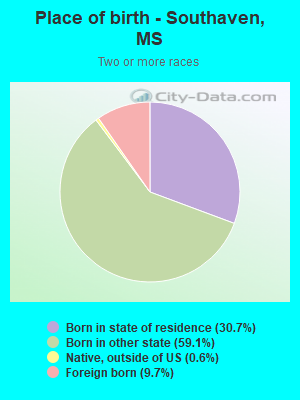
Races - Two or more races(%)
Races - Two or more races(% change since 2000)
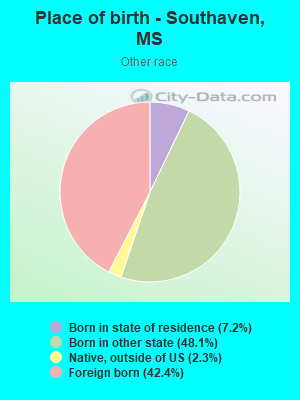
Races - Other race alone (%)
Races - Other race alone (% change since 2000)
Racial diversity
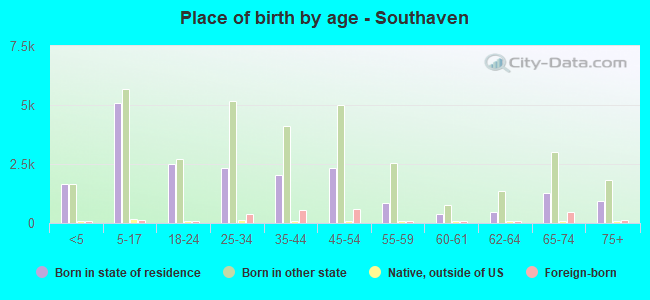
Place of birth - Born in state of residence (%)
Place of birth - Born in state of residence (%) - White
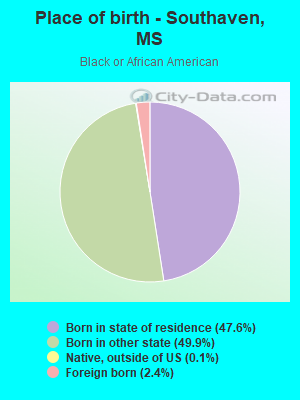
Place of birth - Born in state of residence (%) - Black or African American
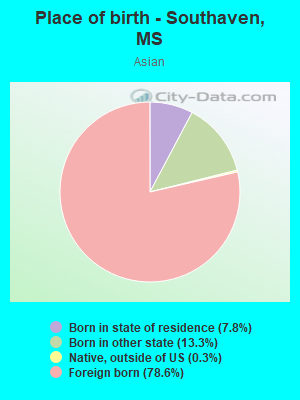
Place of birth - Born in state of residence (%) - Asian
Place of birth - Born in state of residence (%) - Hispanic or Latino
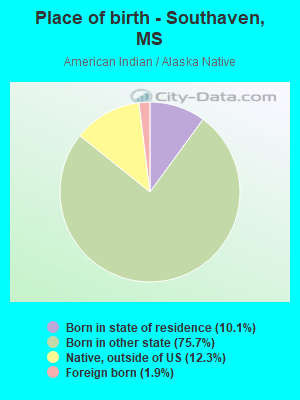
Place of birth - Born in state of residence (%) - American Indian and Alaska Native
Place of birth - Born in state of residence (%) - Multirace
Place of birth - Born in state of residence (%) - Other Race
Place of birth - Born in other state (%)
Place of birth - Born in other state (%) - White
Place of birth - Born in other state (%) - Black or African American
Place of birth - Born in other state (%) - Asian
Place of birth - Born in other state (%) - Hispanic or Latino
Place of birth - Born in other state (%) - American Indian and Alaska Native
Place of birth - Born in other state (%) - Multirace
Place of birth - Born in other state (%) - Other Race
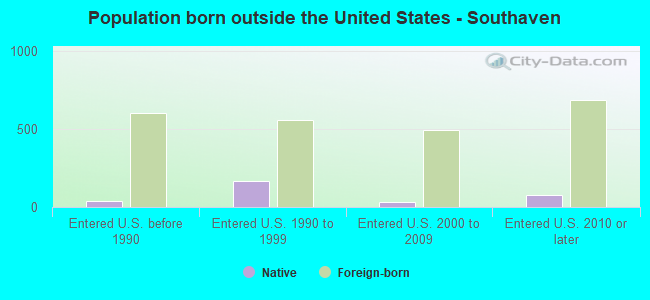
Place of birth - Native, outside of US (%)
Place of birth - Native, outside of US (%) - White
Place of birth - Native, outside of US (%) - Black or African American
Place of birth - Native, outside of US (%) - Asian
Place of birth - Native, outside of US (%) - Hispanic or Latino
Place of birth - Native, outside of US (%) - American Indian and Alaska Native
Place of birth - Native, outside of US (%) - Multirace
Place of birth - Native, outside of US (%) - Other Race
Place of birth - Foreign born (%)
Place of birth - Foreign born (%) - White
Place of birth - Foreign born (%) - Black or African American
Place of birth - Foreign born (%) - Asian
Place of birth - Foreign born (%) - Hispanic or Latino
Place of birth - Foreign born (%) - American Indian and Alaska Native
Place of birth - Foreign born (%) - Multirace
Place of birth - Foreign born (%) - Other Race
Residents speaking English at home (%)
Residents speaking English at home - Born in the United States (%)
Residents speaking English at home - Native, born elsewhere (%)
Residents speaking English at home - Foreign born (%)
Residents speaking Spanish at home (%)
Residents speaking Spanish at home - Born in the United States (%)
Residents speaking Spanish at home - Native, born elsewhere (%)
Residents speaking Spanish at home - Foreign born (%)
Residents speaking other language at home (%)
Residents speaking other language at home - Born in the United States (%)
Residents speaking other language at home - Native, born elsewhere (%)
Residents speaking other language at home - Foreign born (%)
Marital status - Never married (%)
Marital status - Now married (%)
Marital status - Separated (%)
Marital status - Widowed (%)
Marital status - Divorced (%)
Ancestries Reported - Arab (%)
Ancestries Reported - Czech (%)
Ancestries Reported - Danish (%)
Ancestries Reported - Dutch (%)
Ancestries Reported - English (%)
Ancestries Reported - French (%)
Ancestries Reported - French Canadian (%)
Ancestries Reported - German (%)
Ancestries Reported - Greek (%)
Ancestries Reported - Hungarian (%)
Ancestries Reported - Irish (%)
Ancestries Reported - Italian (%)
Ancestries Reported - Lithuanian (%)
Ancestries Reported - Norwegian (%)
Ancestries Reported - Polish (%)
Ancestries Reported - Portuguese (%)
Ancestries Reported - Russian (%)
Ancestries Reported - Scotch-Irish (%)
Ancestries Reported - Scottish (%)
Ancestries Reported - Slovak (%)
Ancestries Reported - Subsaharan African (%)
Ancestries Reported - Swedish (%)
Ancestries Reported - Swiss (%)
Ancestries Reported - Ukrainian (%)
Ancestries Reported - United States (%)
Ancestries Reported - Welsh (%)
Ancestries Reported - West Indian (%)
Ancestries Reported - Other (%)
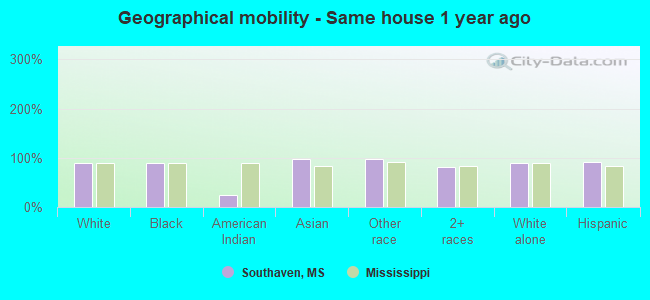
Geographical mobility - Same house 1 year ago (%)
Geographical mobility - Same house 1 year ago (%) - White
Geographical mobility - Same house 1 year ago (%) - Black or African American
Geographical mobility - Same house 1 year ago (%) - Asian
Geographical mobility - Same house 1 year ago (%) - Hispanic or Latino
Geographical mobility - Same house 1 year ago (%) - American Indian and Alaska Native
Geographical mobility - Same house 1 year ago (%) - Multirace
Geographical mobility - Same house 1 year ago (%) - Other Race
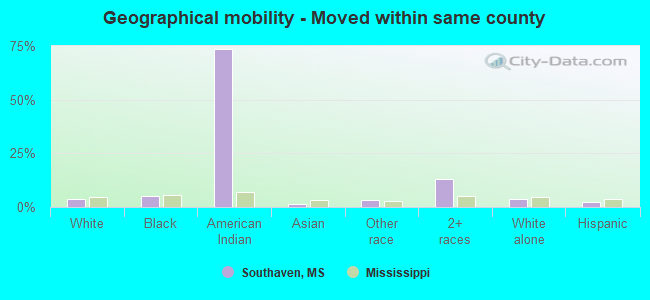
Geographical mobility - Moved within same county (%)
Geographical mobility - Moved within same county (%) - White
Geographical mobility - Moved within same county (%) - Black or African American
Geographical mobility - Moved within same county (%) - Asian
Geographical mobility - Moved within same county (%) - Hispanic or Latino
Geographical mobility - Moved within same county (%) - American Indian and Alaska Native
Geographical mobility - Moved within same county (%) - Multirace
Geographical mobility - Moved within same county (%) - Other Race
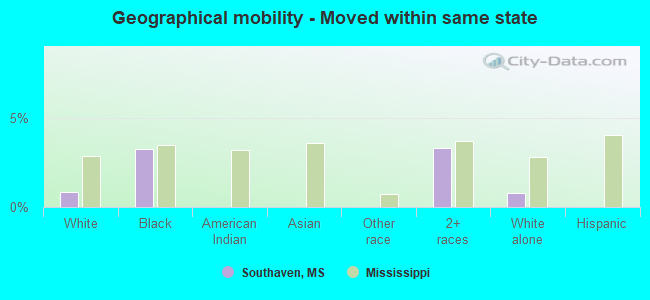
Geographical mobility - Moved from different county within same state (%)
Geographical mobility - Moved from different county within same state (%) - White
Geographical mobility - Moved from different county within same state (%) - Black or African American
Geographical mobility - Moved from different county within same state (%) - Asian
Geographical mobility - Moved from different county within same state (%) - Hispanic or Latino
Geographical mobility - Moved from different county within same state (%) - American Indian and Alaska Native
Geographical mobility - Moved from different county within same state (%) - Multirace
Geographical mobility - Moved from different county within same state (%) - Other Race
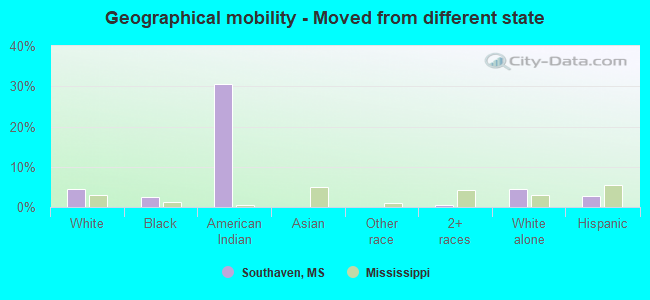
Geographical mobility - Moved from different state (%)
Geographical mobility - Moved from different state (%) - White
Geographical mobility - Moved from different state (%) - Black or African American
Geographical mobility - Moved from different state (%) - Asian
Geographical mobility - Moved from different state (%) - Hispanic or Latino
Geographical mobility - Moved from different state (%) - American Indian and Alaska Native
Geographical mobility - Moved from different state (%) - Multirace
Geographical mobility - Moved from different state (%) - Other Race
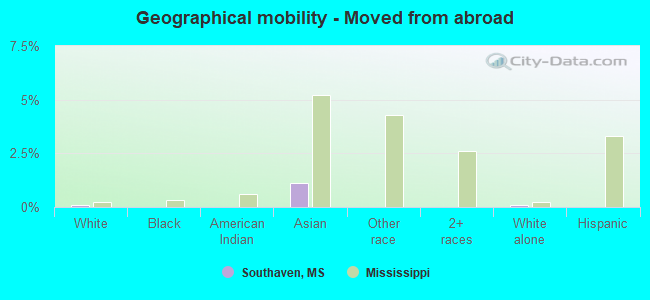
Geographical mobility - Moved from abroad (%)
Geographical mobility - Moved from abroad (%) - White
Geographical mobility - Moved from abroad (%) - Black or African American
Geographical mobility - Moved from abroad (%) - Asian
Geographical mobility - Moved from abroad (%) - Hispanic or Latino
Geographical mobility - Moved from abroad (%) - American Indian and Alaska Native
Geographical mobility - Moved from abroad (%) - Multirace
Geographical mobility - Moved from abroad (%) - Other Race
Place of birth for the foreign-born population - Ireland (%)
Place of birth for the foreign-born population - Denmark (%)
Place of birth for the foreign-born population - Norway (%)
Place of birth for the foreign-born population - Sweden (%)
Place of birth for the foreign-born population - United Kingdom (%)
Place of birth for the foreign-born population - England (%)
Place of birth for the foreign-born population - Scotland (%)
Place of birth for the foreign-born population - Other Northern Europe (%)
Place of birth for the foreign-born population - Austria (%)
Place of birth for the foreign-born population - Belgium (%)
Place of birth for the foreign-born population - France (%)
Place of birth for the foreign-born population - Germany (%)
Place of birth for the foreign-born population - Netherlands (%)
Place of birth for the foreign-born population - Switzerland (%)
Place of birth for the foreign-born population - Other Western Europe (%)
Place of birth for the foreign-born population - Greece (%)
Place of birth for the foreign-born population - Italy (%)
Place of birth for the foreign-born population - Portugal (%)
Place of birth for the foreign-born population - Spain (%)
Place of birth for the foreign-born population - Other Southern Europe (%)
Place of birth for the foreign-born population - Albania (%)
Place of birth for the foreign-born population - Belarus (%)
Place of birth for the foreign-born population - Bosnia and Herzegovina (%)
Place of birth for the foreign-born population - Bulgaria (%)
Place of birth for the foreign-born population - Croatia (%)
Place of birth for the foreign-born population - Czechoslovakia (%)
Place of birth for the foreign-born population - Hungary (%)
Place of birth for the foreign-born population - Latvia (%)
Place of birth for the foreign-born population - Lithuania (%)
Place of birth for the foreign-born population - North Macedonia (Macedonia) (%)
Place of birth for the foreign-born population - Moldova (%)
Place of birth for the foreign-born population - Poland (%)
Place of birth for the foreign-born population - Romania (%)
Place of birth for the foreign-born population - Russia (%)
Place of birth for the foreign-born population - Serbia (%)
Place of birth for the foreign-born population - Ukraine (%)
Place of birth for the foreign-born population - Other Eastern Europe (%)
Place of birth for the foreign-born population - China (%)
Place of birth for the foreign-born population - Hong Kong (%)
Place of birth for the foreign-born population - Taiwan (%)
Place of birth for the foreign-born population - Japan (%)
Place of birth for the foreign-born population - Korea (%)
Place of birth for the foreign-born population - Other Eastern Asia (%)
Place of birth for the foreign-born population - Afghanistan (%)
Place of birth for the foreign-born population - Bangladesh (%)
Place of birth for the foreign-born population - India (%)
Place of birth for the foreign-born population - Iran (%)
Place of birth for the foreign-born population - Kazakhstan (%)
Place of birth for the foreign-born population - Nepal (%)
Place of birth for the foreign-born population - Pakistan (%)
Place of birth for the foreign-born population - Sri Lanka (%)
Place of birth for the foreign-born population - Uzbekistan (%)
Place of birth for the foreign-born population - Other South Central Asia (%)
Place of birth for the foreign-born population - Burma (%)
Place of birth for the foreign-born population - Cambodia (%)
Place of birth for the foreign-born population - Indonesia (%)
Place of birth for the foreign-born population - Laos (%)
Place of birth for the foreign-born population - Malaysia (%)
Place of birth for the foreign-born population - Philippines (%)
Place of birth for the foreign-born population - Singapore (%)
Place of birth for the foreign-born population - Thailand (%)
Place of birth for the foreign-born population - Vietnam (%)
Place of birth for the foreign-born population - Other South Eastern Asia (%)
Place of birth for the foreign-born population - Armenia (%)
Place of birth for the foreign-born population - Iraq (%)
Place of birth for the foreign-born population - Israel (%)
Place of birth for the foreign-born population - Jordan (%)
Place of birth for the foreign-born population - Kuwait (%)
Place of birth for the foreign-born population - Lebanon (%)
Place of birth for the foreign-born population - Saudi Arabia (%)
Place of birth for the foreign-born population - Syria (%)
Place of birth for the foreign-born population - Turkey (%)
Place of birth for the foreign-born population - Yemen (%)
Place of birth for the foreign-born population - Other Western Asia (%)
Place of birth for the foreign-born population - Eritrea (%)
Place of birth for the foreign-born population - Ethiopia (%)
Place of birth for the foreign-born population - Kenya (%)
Place of birth for the foreign-born population - Somalia (%)
Place of birth for the foreign-born population - Uganda (%)
Place of birth for the foreign-born population - Zimbabwe (%)
Place of birth for the foreign-born population - Other Eastern Africa (%)
Place of birth for the foreign-born population - Cameroon (%)
Place of birth for the foreign-born population - Congo (%)
Place of birth for the foreign-born population - Democratic Republic of Congo (Zaire) (%)
Place of birth for the foreign-born population - Other Middle Africa (%)
Place of birth for the foreign-born population - Egypt (%)
Place of birth for the foreign-born population - Morocco (%)
Place of birth for the foreign-born population - Sudan (%)
Place of birth for the foreign-born population - Other Northern Africa (%)
Place of birth for the foreign-born population - South Africa (%)
Place of birth for the foreign-born population - Other Southern Africa (%)
Place of birth for the foreign-born population - Cabo Verde (%)
Place of birth for the foreign-born population - Ghana (%)
Place of birth for the foreign-born population - Liberia (%)
Place of birth for the foreign-born population - Nigeria (%)
Place of birth for the foreign-born population - Senegal (%)
Place of birth for the foreign-born population - Sierra Leone (%)
Place of birth for the foreign-born population - Other Western Africa (%)
Place of birth for the foreign-born population - Australia (%)
Place of birth for the foreign-born population - New Zealand (%)
Place of birth for the foreign-born population - Fiji (%)
Place of birth for the foreign-born population - Micronesia (%)
Place of birth for the foreign-born population - Bahamas (%)
Place of birth for the foreign-born population - Barbados (%)
Place of birth for the foreign-born population - Cuba (%)
Place of birth for the foreign-born population - Dominica (%)
Place of birth for the foreign-born population - Dominican Republic (%)
Place of birth for the foreign-born population - Grenada (%)
Place of birth for the foreign-born population - Haiti (%)
Place of birth for the foreign-born population - Jamaica (%)
Place of birth for the foreign-born population - St. Vincent and the Grenadines (%)
Place of birth for the foreign-born population - Trinidad and Tobago (%)
Place of birth for the foreign-born population - West Indies (%)
Place of birth for the foreign-born population - Other Caribbean (%)
Place of birth for the foreign-born population - Belize (%)
Place of birth for the foreign-born population - Costa Rica (%)
Place of birth for the foreign-born population - El Salvador (%)
Place of birth for the foreign-born population - Guatemala (%)
Place of birth for the foreign-born population - Honduras (%)
Place of birth for the foreign-born population - Mexico (%)
Place of birth for the foreign-born population - Nicaragua (%)
Place of birth for the foreign-born population - Panama (%)
Place of birth for the foreign-born population - Other Central America (%)
Place of birth for the foreign-born population - Argentina (%)
Place of birth for the foreign-born population - Bolivia (%)
Place of birth for the foreign-born population - Brazil (%)
Place of birth for the foreign-born population - Chile (%)
Place of birth for the foreign-born population - Colombia (%)
Place of birth for the foreign-born population - Ecuador (%)
Place of birth for the foreign-born population - Guyana (%)
Place of birth for the foreign-born population - Peru (%)
Place of birth for the foreign-born population - Uruguay (%)
Place of birth for the foreign-born population - Venezuela (%)
Place of birth for the foreign-born population - Other South America (%)
Place of birth for the foreign-born population - Canada (%)
Place of birth for the foreign-born population - Other Northern America (%)
Place of birth for the foreign-born population - Other (%)
Latest news about races in Southaven, MS collected exclusively by city-data.com from local newspapers, TV, and radio stations
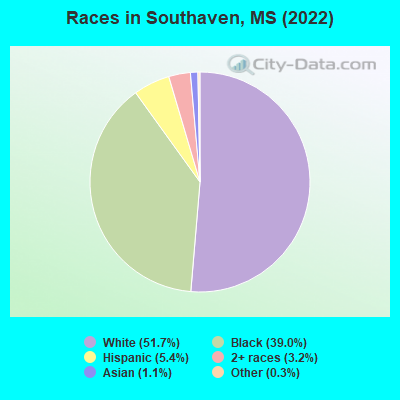
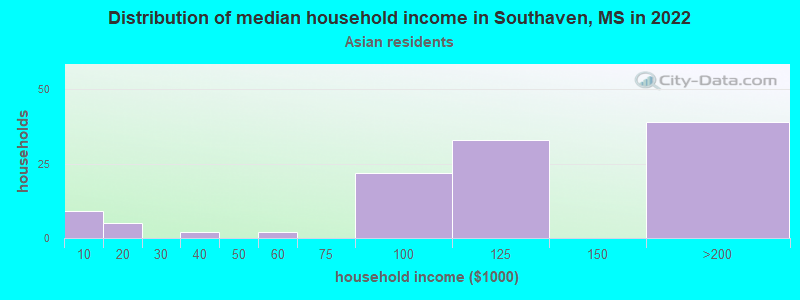
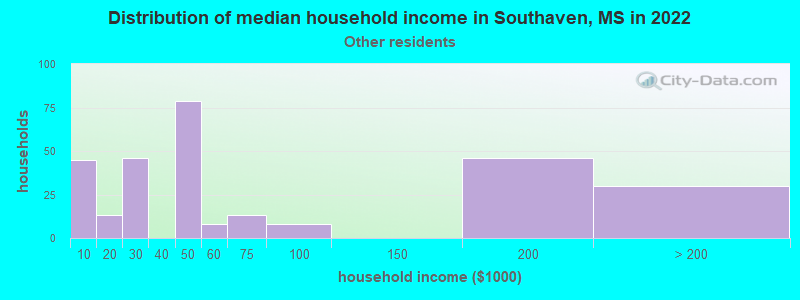
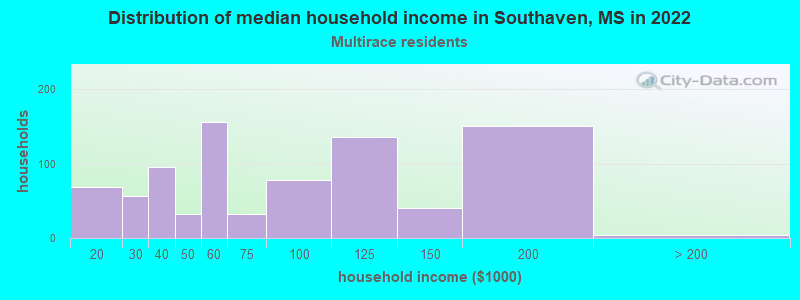
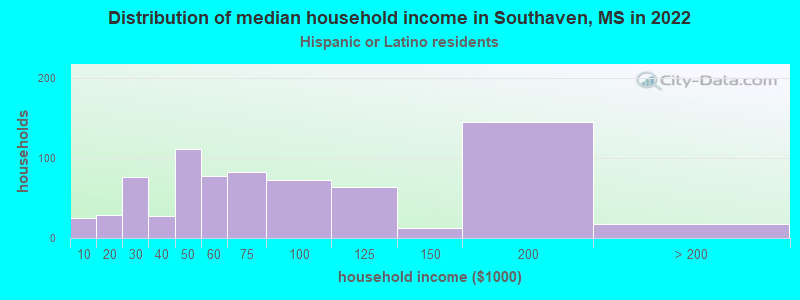
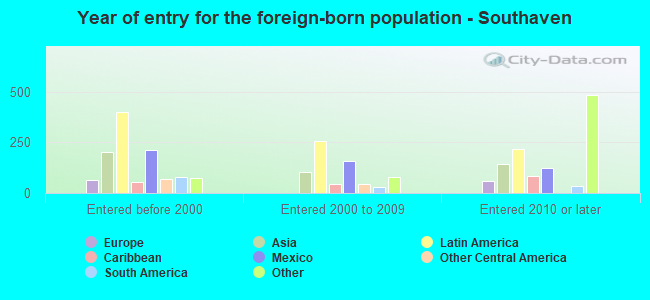
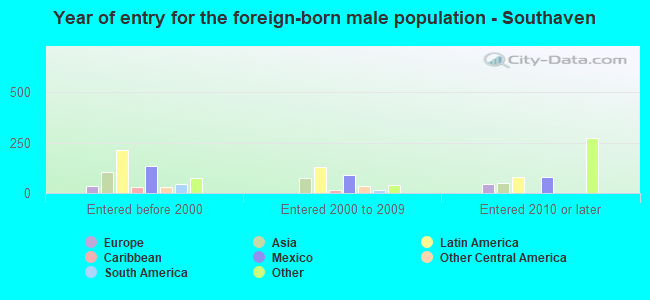
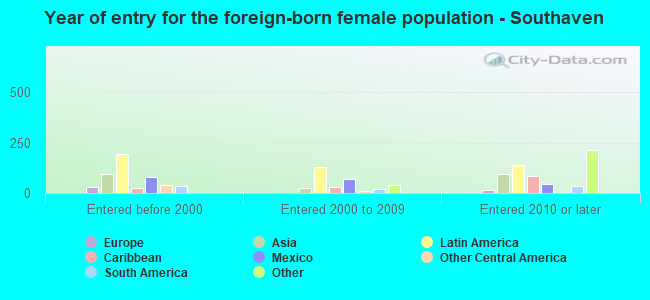
According to 2022 data, the most numerous races in Southaven, MS are White alone (29,237 residents), Black alone (22,072 residents), and Hispanic (3,044 residents). 94.6% of Southaven residents speak English at home. 4.1% of Southaven, MS residents are foreign-born (1.8% born in Latin America, 1.0% born in Africa, 0.9% born in Asia), which is 50.6% greater than the foreign-born rate of 2.0% across the entire state of Mississippi.
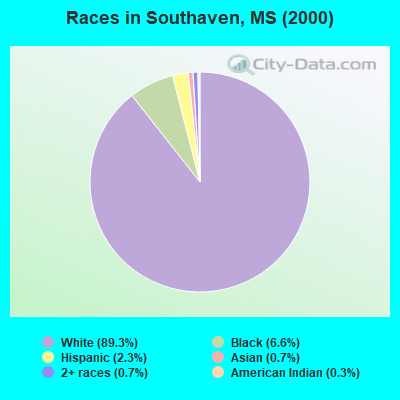
Race distribution in Southaven
2000 2022
1,727,908 60.7% White alone 1,028,473 36.2% Black alone 39,569 1.4% Hispanic 17,272 0.6% Two or more races 18,349 0.6% Asian alone 11,224 0.4% American Indian alone 1,294 0.05% Other race alone 569 0.02% Native Hawaiian and Other
1,625,979 55.3% White alone 1,072,962 36.5% Black alone 97,177 3.3% Hispanic 96,367 3.3% Two or more races 25,217 0.9% Asian alone 12,457 0.4% American Indian alone 9,501 0.3% Other race alone 397 0.01% Native Hawaiian and Other
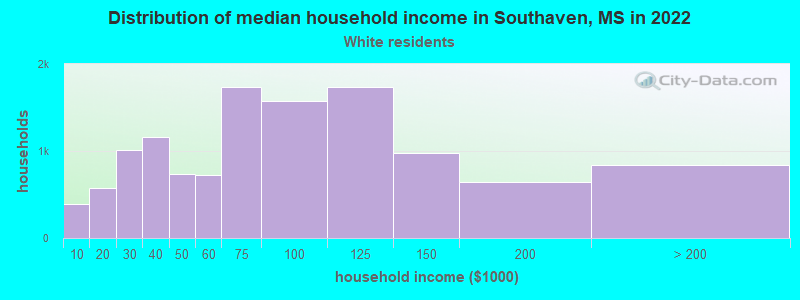
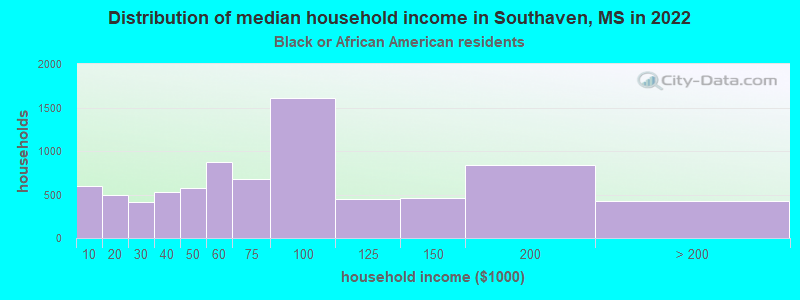
Income and house value in Southaven Median household income in 2022 $74,343 White non-Hispanic householders$79,048 Black householders$89,151 Asian householders$45,422 Some other race householders$63,629 Two or more races householders$49,872 Hispanic or Latino race householdersMedian 2022 house value $228,041 White Non-Hispanic householders$233,996 Black or African American householders$157,073 American Indian or Alaska Native householders $188,587 Asian householders$235,733 Native Hawaiian and other Pacific Islander householders$204,219 Two or more races householders$161,291 Hispanic or Latino householders
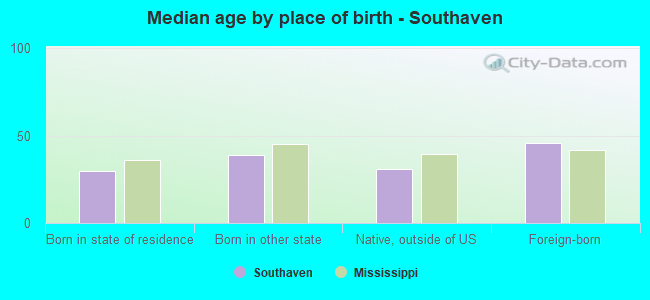
Median age by race in Southaven
39.4 Median age for White residents37.9 42.4 33.6 Median age for Black or African American residents29.3 35.1 16.9 Median age for American Indian / Alaska Native residents-575,569,357.6 20.3 49.8 Median age for Asian residents37.5 58.0 -666,666,666.0 Median age for Native Hawaiian / Pacific Islander residents-666,666,666.0 -666,666,666.0 26.9 Median age for Other race residents28.7 37.6 16.3 Median age for Two or more races residents10.1 30.1 39.7 Median age for White alone residents38.0 43.7 35.5 Median age for Hispanic or Latino residents24.8 36.1
Owner/renter occupied households by race in Southaven
House owners and renters - White residents 9,534 80.6% Owner occupied2,288 19.4% Renter occupiedHouse owners and renters - Black or African American residents 4,927 66.1% Owner occupied2,523 33.9% Renter occupiedHouse owners and renters - American Indian / Alaska Native residents 16 100.0% Owner occupiedHouse owners and renters - Asian residents 224 100.0% Owner occupiedHouse owners and renters - Other race residents 271 85.1% Owner occupied48 14.9% Renter occupiedHouse owners and renters - Two or more races residents 517 67.4% Owner occupied251 32.6% Renter occupiedHouse owners and renters - White alone residents 9,378 80.7% Owner occupied2,246 19.3% Renter occupiedHouse owners and renters - Hispanic or Latino residents 663 72.3% Owner occupied254 27.7% Renter occupied
Language usage in Southaven
English speakers - Total 94.6% of residents of Southaven speak English at home.
3.8% of residents speak Spanish at home 1,450 71.1% Speak English very well588 28.9% Speak English less than very well1.5% of residents speak other language at home 412 50.1% Speak English very well410 49.9% Speak English less than very well
English speakers - Born in the United States 97.4% of residents of Southaven speak English at home.
2.7% of residents speak Spanish at home 720 83.0% Speak English very well147 17.0% Speak English less than very well0.2% of residents speak other language at home 27 45.8% Speak English very well32 54.2% Speak English less than very well
English speakers - Native, born elsewhere 60.3% of residents of Southaven speak English at home.
37.3% of residents speak Spanish at home 110 100.0% Speak English very well29.5% of residents speak other language at home 33 37.9% Speak English very well54 62.1% Speak English less than very well
English speakers - Foreign-born 22.2% of residents of Southaven speak English at home.
44.3% of residents speak Spanish at home 532 52.0% Speak English very well491 48.0% Speak English less than very well34.2% of residents speak other language at home 508 64.3% Speak English very well282 35.7% Speak English less than very well
White (Caucasian) - Speak only English Native:
98.7% (27,687)Foreign-born:
61.3% (151)
White (Caucasian) - Speak another language Native:
0.9% (246)Foreign-born:
84.6% (209)
Black or African American - Speak only English Native:
100.0% (17,876)Foreign-born:
33.6% (188)
American Indian / Alaska Native - Speak only English Native:
98.6% (31)Foreign-born:
100.0% (1)
Asian - Speak only English Native:
83.5% (99)Foreign-born:
21.9% (106)
Asian - Speak another language Native:
17.3% (20)Foreign-born:
82.1% (399)
Other race - Speak only English Native:
49.2% (276)Foreign-born:
4.6% (27)
Other race - Speak another language Native:
51.5% (289)Foreign-born:
100.0% (583)
Two or more races - Speak only English Native:
80.9% (1,876)Foreign-born:
11.7% (35)
Two or more races - Speak another language Native:
18.7% (434)Foreign-born:
89.1% (268)
White alone - Speak only English Native:
99.3% (27,359)Foreign-born:
81.1% (180)
White alone - Speak another language Native:
0.7% (191)Foreign-born:
24.3% (54)
Hispanic or Latino - Speak only English Native:
52.6% (916)Foreign-born:
2.3% (23)
Hispanic or Latino - Speak another language Native:
47.5% (828)Foreign-born:
100.0% (1,001)
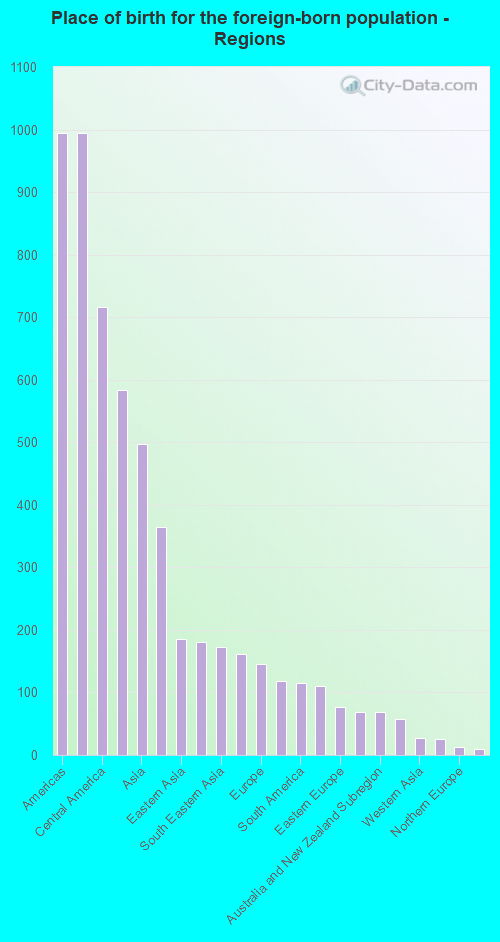
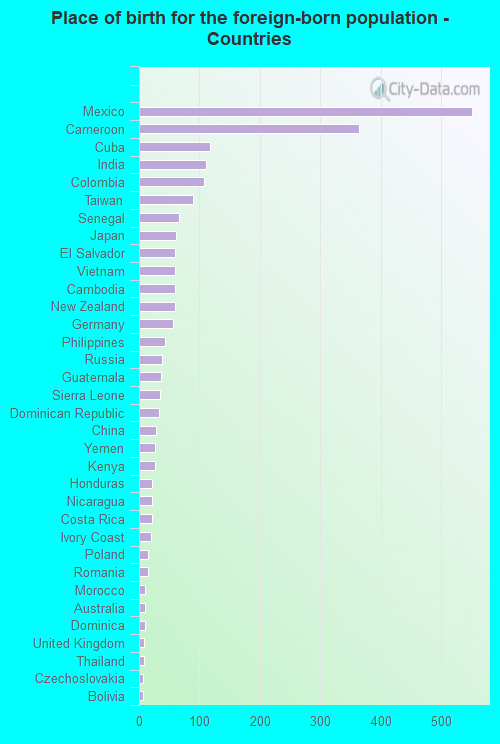
Foreign-born residents in Southaven 2,291 residents are foreign born (1.8% Latin America , 1.0% Africa , 0.9% Asia ).
This city:
4.1%Mississippi:
2.3%
Marital status for residents in Southaven Marital status - White (Caucasian) population 15 years and over
Males 30.7% Never married54.5% Now married1.3% Separated2.8% Widowed10.6% DivorcedFemales 20.5% Never married53.0% Now married0.6% Separated10.2% Widowed15.6% DivorcedWomen who gave birth in the past 12 months Now married:
62.9% (374)Unmarried:
37.1% (221)
Women who did not give birth in the past 12 months Now married:
55.1% (3,554)Unmarried:
44.9% (2,900)
Marital status - Black or African American population 15 years and over
Males 38.2% Never married44.9% Now married1.0% Separated1.1% Widowed14.8% DivorcedFemales 43.6% Never married32.9% Now married4.6% Separated4.0% Widowed14.8% DivorcedWomen who gave birth in the past 12 months Now married:
68.8% (252)Unmarried:
31.2% (114)
Women who did not give birth in the past 12 months Now married:
31.5% (1,984)Unmarried:
68.5% (4,309)
Marital status - American Indian / Alaska Native population 15 years and over
Males 0.0% Never married100.0% Now married0.0% Separated0.0% Widowed0.0% DivorcedFemales 77.8% Never married18.5% Now married0.0% Separated0.0% Widowed3.7% DivorcedWomen who gave birth in the past 12 months Now married:
100.0% (5)Unmarried:
0.0% (0)
Women who did not give birth in the past 12 months Now married:
0.0% (0)Unmarried:
100.0% (12)
Marital status - Asian population 15 years and over
Males 12.3% Never married52.4% Now married35.3% Separated0.0% Widowed0.0% DivorcedFemales 8.0% Never married69.5% Now married0.0% Separated6.5% Widowed16.0% DivorcedWomen who gave birth in the past 12 months Now married:
100.0% (25)Unmarried:
0.0% (0)
Women who did not give birth in the past 12 months Now married:
79.3% (113)Unmarried:
20.7% (30)
Marital status - Other race population 15 years and over
Males 37.3% Never married53.0% Now married2.8% Separated0.0% Widowed6.9% DivorcedFemales 13.4% Never married56.7% Now married0.0% Separated0.0% Widowed29.9% DivorcedWomen who did not give birth in the past 12 months Now married:
72.5% (233)Unmarried:
27.5% (89)
Marital status - Two or more races population 15 years and over
Males 54.8% Never married37.6% Now married0.0% Separated3.0% Widowed4.6% DivorcedFemales 42.6% Never married46.6% Now married0.0% Separated1.4% Widowed9.3% DivorcedWomen who gave birth in the past 12 months Now married:
100.0% (70)Unmarried:
0.0% (0)
Women who did not give birth in the past 12 months Now married:
42.8% (346)Unmarried:
57.2% (462)
Marital status - White alone, not Hispanic / Latino population 15 years and over
Males 30.6% Never married54.3% Now married1.3% Separated2.9% Widowed10.9% DivorcedFemales 20.0% Never married52.8% Now married0.6% Separated10.4% Widowed16.1% DivorcedWomen who gave birth in the past 12 months Now married:
57.8% (310)Unmarried:
42.2% (226)
Women who did not give birth in the past 12 months Now married:
55.1% (3,466)Unmarried:
44.9% (2,828)
Marital status - Hispanic or Latino population 15 years and over
Males 33.7% Never married58.8% Now married2.1% Separated0.0% Widowed5.4% DivorcedFemales 25.7% Never married58.6% Now married1.0% Separated1.8% Widowed13.0% DivorcedWomen who gave birth in the past 12 months Now married:
100.0% (128)Unmarried:
0.0% (0)
Women who did not give birth in the past 12 months Now married:
62.4% (503)Unmarried:
37.6% (302)
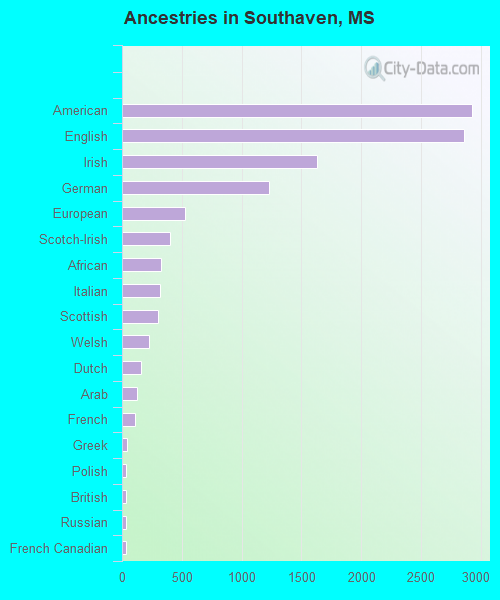
Ancestries in Southaven
2,924 9.7% American2,860 9.5% English1,634 5.4% Irish1,233 4.1% German528 1.8% European398 1.3% Scotch-Irish329 1.1% African318 1.1% Italian302 1.0% Scottish227 0.8% Welsh161 0.5% Dutch125 0.4% Arab109 0.4% French43 0.1% Greek35 0.1% Polish33 0.1% British33 0.1% Russian30 0.10% French Canadian25 0.08% Norwegian22 0.07% Lebanese20 0.07% Danish16 0.05% Kenyan15 0.05% Romanian13 0.04% Senegalese13 0.04% Swedish10 0.03% Moroccan9 0.03% Australian6 0.02% Canadian4 0.01% Eastern European
Geographical mobility in Southaven Same house 1 year ago 26,600 90.2% White (Caucasian)19,768 90.0% Black or African American8 24.9% American Indian / Alaska Native507 98.0% Asian1,313 97.4% Other race2,631 80.4% Two or more races26,125 90.1% White alone, not Hispanic / Latino2,534 92.4% Hispanic or LatinoMoved within same county 1,139 3.9% White / Caucasian1,112 5.1% Black or African American22 73.6% American Indian / Alaska Native6 1.2% Asian42 3.1% Other race424 13.0% Two or more races1,134 3.9% White alone, not Hispanic / Latino67 2.4% Hispanic or LatinoMoved within same state 244 0.8% White / Caucasian714 3.3% Black or African American107 3.3% Two or more races232 0.8% White alone, not Hispanic / LatinoMoved from different state 1,349 4.6% White / Caucasian533 2.4% Black or African American9 30.5% American Indian / Alaska Native17 0.5% Two or more races1,297 4.5% White alone, not Hispanic / Latino73 2.7% Hispanic or LatinoMoved from abroad 29 0.1% White6 1.1% Asian29 0.1% White alone, not Hispanic / Latino
Children Nativity (place of birth) in Southaven
Children under 6 years - Living with two parents Both parents native 2,178 100.0% NativeBoth parents foreign-born 128 100.0% NativeOne native, one foreign-born parent 175 100.0% NativeChildren under 6 years - Living with one parent Native parent 1,259 100.0% NativeForeign-born parent 73 100.0% Foreign-bornChildren 6 to 17 years - Living with two parents Both parents native 4,796 100.0% NativeBoth parents foreign-born 271 75.7% Native87 24.3% Foreign-bornOne native, one foreign-born parent 347 100.0% NativeChildren 6 to 17 years - Living with one parent Native parent 3,779 100.0% NativeForeign-born parent 36 51.7% Native34 48.3% Foreign-born
Grandparents responsible for own grandchildren in Southaven
Grandparents (30 to 59 years) White / Caucasian 210 38.3% Responsible for grandchildren337 61.7% Not responsible for grandchildrenBlack or African American 66 24.2% Responsible for grandchildren208 75.8% Not responsible for grandchildrenAmerican Indian / Alaska Native 10 100.0% Not responsible for grandchildrenOther race 30 100.0% Responsible for grandchildrenWhite alone, not Hispanic / Latino 210 38.3% Responsible for grandchildren337 61.7% Not responsible for grandchildrenHispanic or Latino 23 69.3% Responsible for grandchildren10 30.7% Not responsible for grandchildrenGrandparents (60 years and over) White / Caucasian 219 66.3% Responsible for grandchildren111 33.7% Not responsible for grandchildrenBlack or African American 91 24.1% Responsible for grandchildren287 75.9% Not responsible for grandchildrenOther race 64 100.0% Not responsible for grandchildrenWhite alone, not Hispanic / Latino 219 66.3% Responsible for grandchildren111 33.7% Not responsible for grandchildrenHispanic or Latino 78 100.0% Not responsible for grandchildren