Races in Southeast Arcadia, Florida (FL) Detailed Stats
Data:
Races - White alone (%)
Races - White alone (% change since 2000)
Races - Black alone (%)
Races - Black alone (% change since 2000)
Races - American Indian alone (%)
Races - American Indian alone (% change since 2000)
Races - Asian alone (%)
Races - Asian alone (% change since 2000)
Races - Hispanic (%)
Races - Hispanic (% change since 2000)
Races - Native Hawaiian and Other Pacific Islander alone (%)
Races - Native Hawaiian and Other Pacific Islander alone (% change since 2000)
Races - Two or more races(%)
Races - Two or more races(% change since 2000)
Races - Other race alone (%)
Races - Other race alone (% change since 2000)
Racial diversity
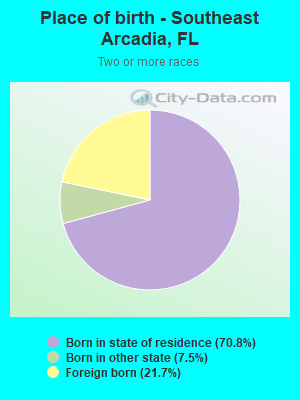
Place of birth - Born in state of residence (%)
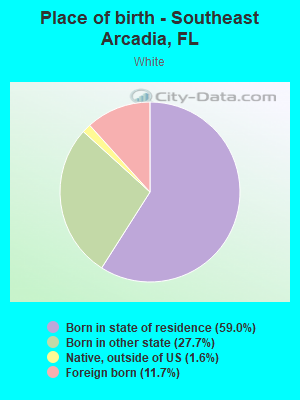
Place of birth - Born in state of residence (%) - White
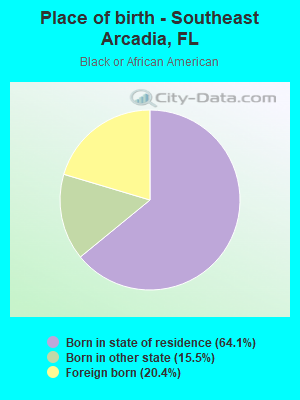
Place of birth - Born in state of residence (%) - Black or African American
Place of birth - Born in state of residence (%) - Asian
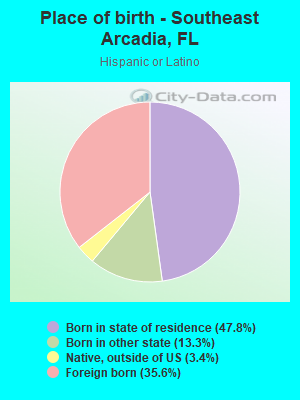
Place of birth - Born in state of residence (%) - Hispanic or Latino
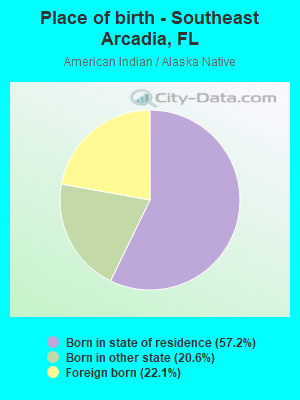
Place of birth - Born in state of residence (%) - American Indian and Alaska Native
Place of birth - Born in state of residence (%) - Multirace
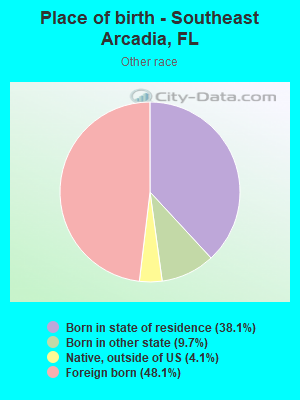
Place of birth - Born in state of residence (%) - Other Race
Place of birth - Born in other state (%)
Place of birth - Born in other state (%) - White
Place of birth - Born in other state (%) - Black or African American
Place of birth - Born in other state (%) - Asian
Place of birth - Born in other state (%) - Hispanic or Latino
Place of birth - Born in other state (%) - American Indian and Alaska Native
Place of birth - Born in other state (%) - Multirace
Place of birth - Born in other state (%) - Other Race
Place of birth - Native, outside of US (%)
Place of birth - Native, outside of US (%) - White
Place of birth - Native, outside of US (%) - Black or African American
Place of birth - Native, outside of US (%) - Asian
Place of birth - Native, outside of US (%) - Hispanic or Latino
Place of birth - Native, outside of US (%) - American Indian and Alaska Native
Place of birth - Native, outside of US (%) - Multirace
Place of birth - Native, outside of US (%) - Other Race
Place of birth - Foreign born (%)
Place of birth - Foreign born (%) - White
Place of birth - Foreign born (%) - Black or African American
Place of birth - Foreign born (%) - Asian
Place of birth - Foreign born (%) - Hispanic or Latino
Place of birth - Foreign born (%) - American Indian and Alaska Native
Place of birth - Foreign born (%) - Multirace
Place of birth - Foreign born (%) - Other Race
Residents speaking English at home (%)
Residents speaking English at home - Born in the United States (%)
Residents speaking English at home - Native, born elsewhere (%)
Residents speaking English at home - Foreign born (%)
Residents speaking Spanish at home (%)
Residents speaking Spanish at home - Born in the United States (%)
Residents speaking Spanish at home - Native, born elsewhere (%)
Residents speaking Spanish at home - Foreign born (%)
Residents speaking other language at home (%)
Residents speaking other language at home - Born in the United States (%)
Residents speaking other language at home - Native, born elsewhere (%)
Residents speaking other language at home - Foreign born (%)
Marital status - Never married (%)
Marital status - Now married (%)
Marital status - Separated (%)
Marital status - Widowed (%)
Marital status - Divorced (%)
Ancestries Reported - Arab (%)
Ancestries Reported - Czech (%)
Ancestries Reported - Danish (%)
Ancestries Reported - Dutch (%)
Ancestries Reported - English (%)
Ancestries Reported - French (%)
Ancestries Reported - French Canadian (%)
Ancestries Reported - German (%)
Ancestries Reported - Greek (%)
Ancestries Reported - Hungarian (%)
Ancestries Reported - Irish (%)
Ancestries Reported - Italian (%)
Ancestries Reported - Lithuanian (%)
Ancestries Reported - Norwegian (%)
Ancestries Reported - Polish (%)
Ancestries Reported - Portuguese (%)
Ancestries Reported - Russian (%)
Ancestries Reported - Scotch-Irish (%)
Ancestries Reported - Scottish (%)
Ancestries Reported - Slovak (%)
Ancestries Reported - Subsaharan African (%)
Ancestries Reported - Swedish (%)
Ancestries Reported - Swiss (%)
Ancestries Reported - Ukrainian (%)
Ancestries Reported - United States (%)
Ancestries Reported - Welsh (%)
Ancestries Reported - West Indian (%)
Ancestries Reported - Other (%)
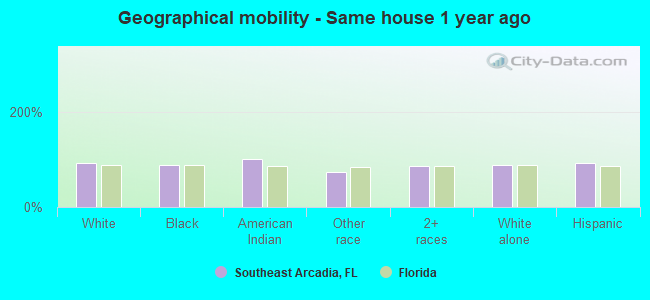
Geographical mobility - Same house 1 year ago (%)
Geographical mobility - Same house 1 year ago (%) - White
Geographical mobility - Same house 1 year ago (%) - Black or African American
Geographical mobility - Same house 1 year ago (%) - Asian
Geographical mobility - Same house 1 year ago (%) - Hispanic or Latino
Geographical mobility - Same house 1 year ago (%) - American Indian and Alaska Native
Geographical mobility - Same house 1 year ago (%) - Multirace
Geographical mobility - Same house 1 year ago (%) - Other Race
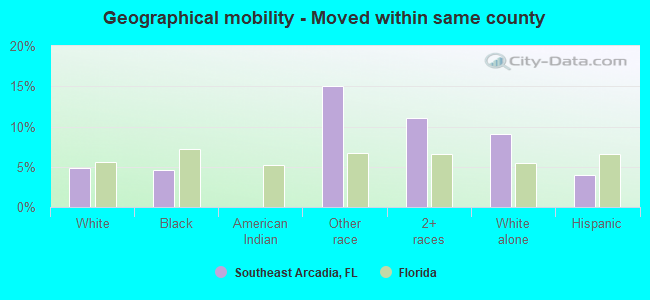
Geographical mobility - Moved within same county (%)
Geographical mobility - Moved within same county (%) - White
Geographical mobility - Moved within same county (%) - Black or African American
Geographical mobility - Moved within same county (%) - Asian
Geographical mobility - Moved within same county (%) - Hispanic or Latino
Geographical mobility - Moved within same county (%) - American Indian and Alaska Native
Geographical mobility - Moved within same county (%) - Multirace
Geographical mobility - Moved within same county (%) - Other Race
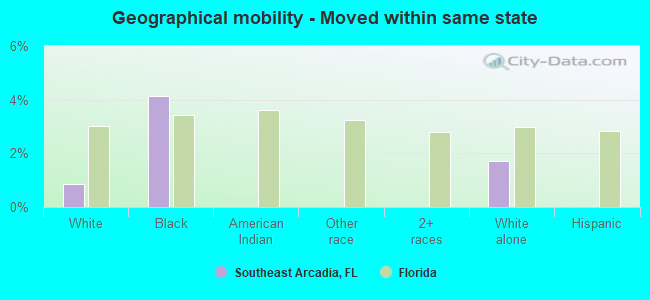
Geographical mobility - Moved from different county within same state (%)
Geographical mobility - Moved from different county within same state (%) - White
Geographical mobility - Moved from different county within same state (%) - Black or African American
Geographical mobility - Moved from different county within same state (%) - Asian
Geographical mobility - Moved from different county within same state (%) - Hispanic or Latino
Geographical mobility - Moved from different county within same state (%) - American Indian and Alaska Native
Geographical mobility - Moved from different county within same state (%) - Multirace
Geographical mobility - Moved from different county within same state (%) - Other Race
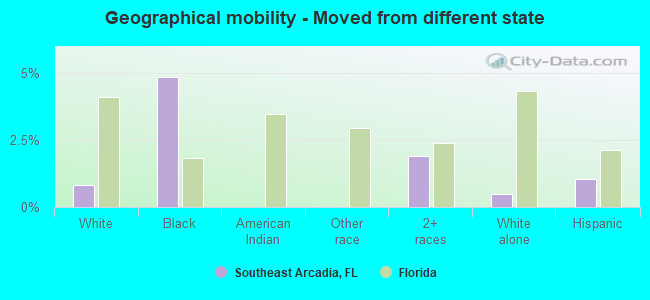
Geographical mobility - Moved from different state (%)
Geographical mobility - Moved from different state (%) - White
Geographical mobility - Moved from different state (%) - Black or African American
Geographical mobility - Moved from different state (%) - Asian
Geographical mobility - Moved from different state (%) - Hispanic or Latino
Geographical mobility - Moved from different state (%) - American Indian and Alaska Native
Geographical mobility - Moved from different state (%) - Multirace
Geographical mobility - Moved from different state (%) - Other Race
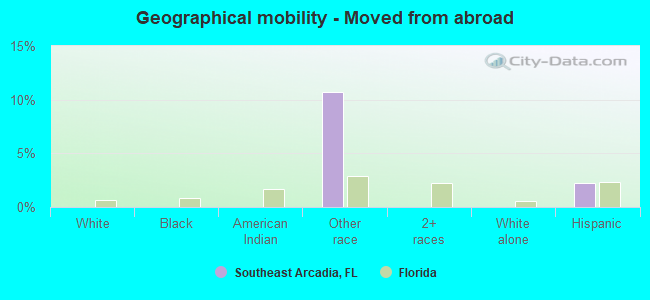
Geographical mobility - Moved from abroad (%)
Geographical mobility - Moved from abroad (%) - White
Geographical mobility - Moved from abroad (%) - Black or African American
Geographical mobility - Moved from abroad (%) - Asian
Geographical mobility - Moved from abroad (%) - Hispanic or Latino
Geographical mobility - Moved from abroad (%) - American Indian and Alaska Native
Geographical mobility - Moved from abroad (%) - Multirace
Geographical mobility - Moved from abroad (%) - Other Race
Place of birth for the foreign-born population - Ireland (%)
Place of birth for the foreign-born population - Denmark (%)
Place of birth for the foreign-born population - Norway (%)
Place of birth for the foreign-born population - Sweden (%)
Place of birth for the foreign-born population - United Kingdom (%)
Place of birth for the foreign-born population - England (%)
Place of birth for the foreign-born population - Scotland (%)
Place of birth for the foreign-born population - Other Northern Europe (%)
Place of birth for the foreign-born population - Austria (%)
Place of birth for the foreign-born population - Belgium (%)
Place of birth for the foreign-born population - France (%)
Place of birth for the foreign-born population - Germany (%)
Place of birth for the foreign-born population - Netherlands (%)
Place of birth for the foreign-born population - Switzerland (%)
Place of birth for the foreign-born population - Other Western Europe (%)
Place of birth for the foreign-born population - Greece (%)
Place of birth for the foreign-born population - Italy (%)
Place of birth for the foreign-born population - Portugal (%)
Place of birth for the foreign-born population - Spain (%)
Place of birth for the foreign-born population - Other Southern Europe (%)
Place of birth for the foreign-born population - Albania (%)
Place of birth for the foreign-born population - Belarus (%)
Place of birth for the foreign-born population - Bosnia and Herzegovina (%)
Place of birth for the foreign-born population - Bulgaria (%)
Place of birth for the foreign-born population - Croatia (%)
Place of birth for the foreign-born population - Czechoslovakia (%)
Place of birth for the foreign-born population - Hungary (%)
Place of birth for the foreign-born population - Latvia (%)
Place of birth for the foreign-born population - Lithuania (%)
Place of birth for the foreign-born population - North Macedonia (Macedonia) (%)
Place of birth for the foreign-born population - Moldova (%)
Place of birth for the foreign-born population - Poland (%)
Place of birth for the foreign-born population - Romania (%)
Place of birth for the foreign-born population - Russia (%)
Place of birth for the foreign-born population - Serbia (%)
Place of birth for the foreign-born population - Ukraine (%)
Place of birth for the foreign-born population - Other Eastern Europe (%)
Place of birth for the foreign-born population - China (%)
Place of birth for the foreign-born population - Hong Kong (%)
Place of birth for the foreign-born population - Taiwan (%)
Place of birth for the foreign-born population - Japan (%)
Place of birth for the foreign-born population - Korea (%)
Place of birth for the foreign-born population - Other Eastern Asia (%)
Place of birth for the foreign-born population - Afghanistan (%)
Place of birth for the foreign-born population - Bangladesh (%)
Place of birth for the foreign-born population - India (%)
Place of birth for the foreign-born population - Iran (%)
Place of birth for the foreign-born population - Kazakhstan (%)
Place of birth for the foreign-born population - Nepal (%)
Place of birth for the foreign-born population - Pakistan (%)
Place of birth for the foreign-born population - Sri Lanka (%)
Place of birth for the foreign-born population - Uzbekistan (%)
Place of birth for the foreign-born population - Other South Central Asia (%)
Place of birth for the foreign-born population - Burma (%)
Place of birth for the foreign-born population - Cambodia (%)
Place of birth for the foreign-born population - Indonesia (%)
Place of birth for the foreign-born population - Laos (%)
Place of birth for the foreign-born population - Malaysia (%)
Place of birth for the foreign-born population - Philippines (%)
Place of birth for the foreign-born population - Singapore (%)
Place of birth for the foreign-born population - Thailand (%)
Place of birth for the foreign-born population - Vietnam (%)
Place of birth for the foreign-born population - Other South Eastern Asia (%)
Place of birth for the foreign-born population - Armenia (%)
Place of birth for the foreign-born population - Iraq (%)
Place of birth for the foreign-born population - Israel (%)
Place of birth for the foreign-born population - Jordan (%)
Place of birth for the foreign-born population - Kuwait (%)
Place of birth for the foreign-born population - Lebanon (%)
Place of birth for the foreign-born population - Saudi Arabia (%)
Place of birth for the foreign-born population - Syria (%)
Place of birth for the foreign-born population - Turkey (%)
Place of birth for the foreign-born population - Yemen (%)
Place of birth for the foreign-born population - Other Western Asia (%)
Place of birth for the foreign-born population - Eritrea (%)
Place of birth for the foreign-born population - Ethiopia (%)
Place of birth for the foreign-born population - Kenya (%)
Place of birth for the foreign-born population - Somalia (%)
Place of birth for the foreign-born population - Uganda (%)
Place of birth for the foreign-born population - Zimbabwe (%)
Place of birth for the foreign-born population - Other Eastern Africa (%)
Place of birth for the foreign-born population - Cameroon (%)
Place of birth for the foreign-born population - Congo (%)
Place of birth for the foreign-born population - Democratic Republic of Congo (Zaire) (%)
Place of birth for the foreign-born population - Other Middle Africa (%)
Place of birth for the foreign-born population - Egypt (%)
Place of birth for the foreign-born population - Morocco (%)
Place of birth for the foreign-born population - Sudan (%)
Place of birth for the foreign-born population - Other Northern Africa (%)
Place of birth for the foreign-born population - South Africa (%)
Place of birth for the foreign-born population - Other Southern Africa (%)
Place of birth for the foreign-born population - Cabo Verde (%)
Place of birth for the foreign-born population - Ghana (%)
Place of birth for the foreign-born population - Liberia (%)
Place of birth for the foreign-born population - Nigeria (%)
Place of birth for the foreign-born population - Senegal (%)
Place of birth for the foreign-born population - Sierra Leone (%)
Place of birth for the foreign-born population - Other Western Africa (%)
Place of birth for the foreign-born population - Australia (%)
Place of birth for the foreign-born population - New Zealand (%)
Place of birth for the foreign-born population - Fiji (%)
Place of birth for the foreign-born population - Micronesia (%)
Place of birth for the foreign-born population - Bahamas (%)
Place of birth for the foreign-born population - Barbados (%)
Place of birth for the foreign-born population - Cuba (%)
Place of birth for the foreign-born population - Dominica (%)
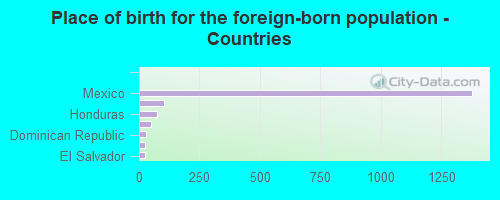
Place of birth for the foreign-born population - Dominican Republic (%)
Place of birth for the foreign-born population - Grenada (%)
Place of birth for the foreign-born population - Haiti (%)
Place of birth for the foreign-born population - Jamaica (%)
Place of birth for the foreign-born population - St. Vincent and the Grenadines (%)
Place of birth for the foreign-born population - Trinidad and Tobago (%)
Place of birth for the foreign-born population - West Indies (%)
Place of birth for the foreign-born population - Other Caribbean (%)
Place of birth for the foreign-born population - Belize (%)
Place of birth for the foreign-born population - Costa Rica (%)
Place of birth for the foreign-born population - El Salvador (%)
Place of birth for the foreign-born population - Guatemala (%)
Place of birth for the foreign-born population - Honduras (%)
Place of birth for the foreign-born population - Mexico (%)
Place of birth for the foreign-born population - Nicaragua (%)
Place of birth for the foreign-born population - Panama (%)
Place of birth for the foreign-born population - Other Central America (%)
Place of birth for the foreign-born population - Argentina (%)
Place of birth for the foreign-born population - Bolivia (%)
Place of birth for the foreign-born population - Brazil (%)
Place of birth for the foreign-born population - Chile (%)
Place of birth for the foreign-born population - Colombia (%)
Place of birth for the foreign-born population - Ecuador (%)
Place of birth for the foreign-born population - Guyana (%)
Place of birth for the foreign-born population - Peru (%)
Place of birth for the foreign-born population - Uruguay (%)
Place of birth for the foreign-born population - Venezuela (%)
Place of birth for the foreign-born population - Other South America (%)
Place of birth for the foreign-born population - Canada (%)
Place of birth for the foreign-born population - Other Northern America (%)
Place of birth for the foreign-born population - Other (%)
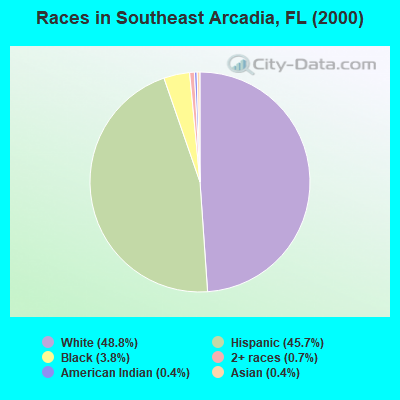
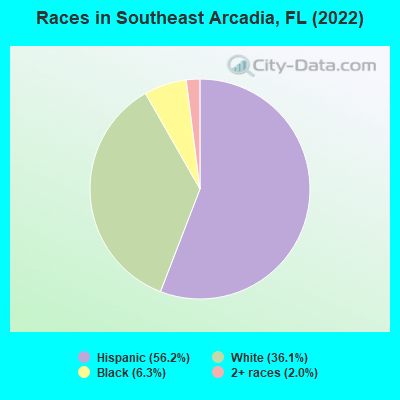
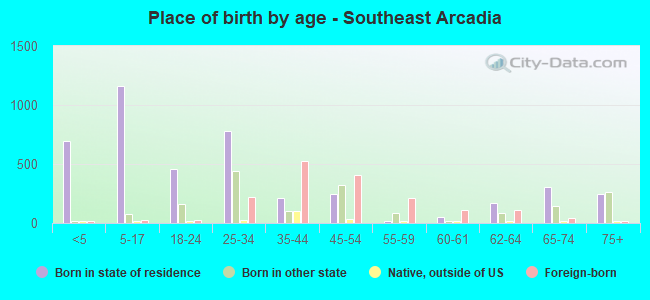
According to 2022 data, the most numerous races in Southeast Arcadia, FL are White alone (2,848 residents), Hispanic (4,437 residents), and Black alone (497 residents). 52.8% of Southeast Arcadia residents speak English at home. 21.4% of Southeast Arcadia, FL residents are foreign-born (20.9% born in Latin America), which is about the same as the foreign-born rate of 21.0% across the entire state of Florida.
Race distribution in Southeast Arcadia
2000 2022
10,458,509 65.4% White alone 2,682,715 16.8% Hispanic 2,264,268 14.2% Black alone 261,693 1.6% Asian alone 236,954 1.5% Two or more races 42,358 0.3% American Indian alone 28,994 0.2% Other race alone 6,887 0.04% Native Hawaiian and Other
11,309,403 50.8% White alone 6,025,039 27.1% Hispanic 3,241,015 14.6% Black alone 861,630 3.9% Two or more races 623,692 2.8% Asian alone 152,054 0.7% Other race alone 22,504 0.1% American Indian alone 9,486 0.04% Native Hawaiian and Other
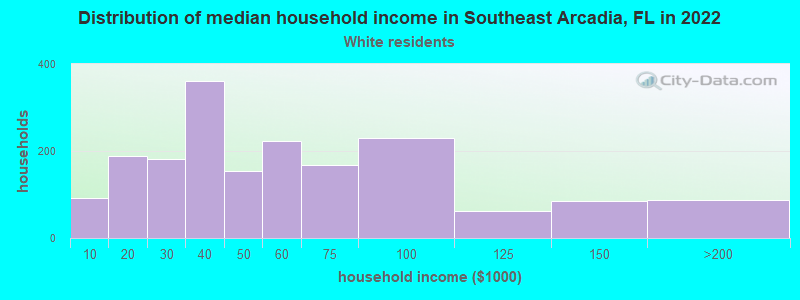
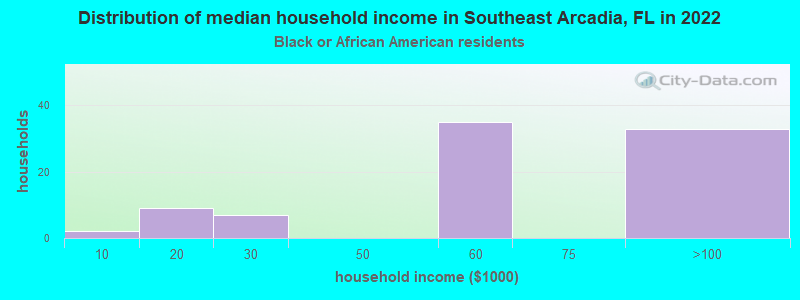
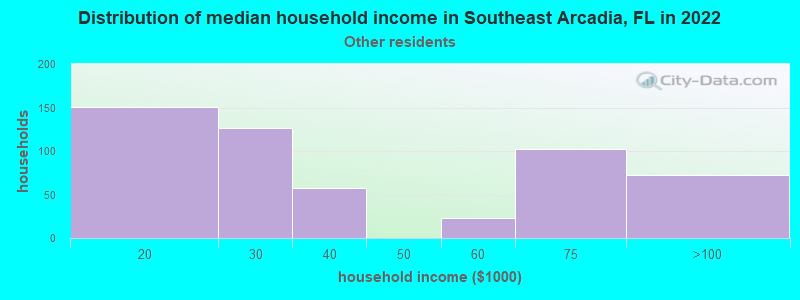
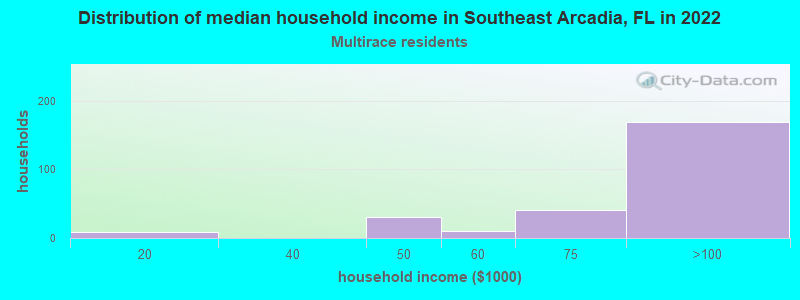
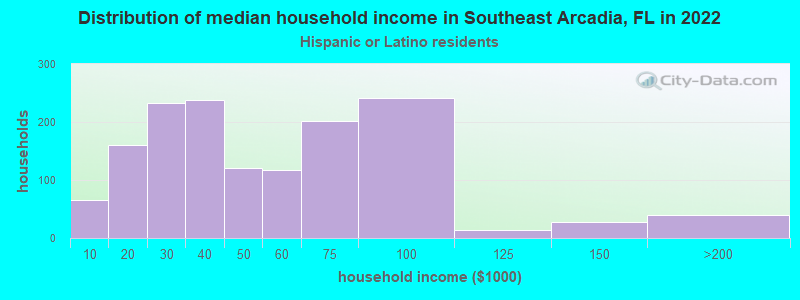
Income and house value in Southeast Arcadia Median household income in 2022 $53,397 White non-Hispanic householders$55,887 Black householders$28,307 Some other race householders$80,452 Two or more races householders$41,376 Hispanic or Latino race householdersMedian 2022 house value $235,185 White Non-Hispanic householders$82,568 Some other race householders$159,384 Hispanic or Latino householders
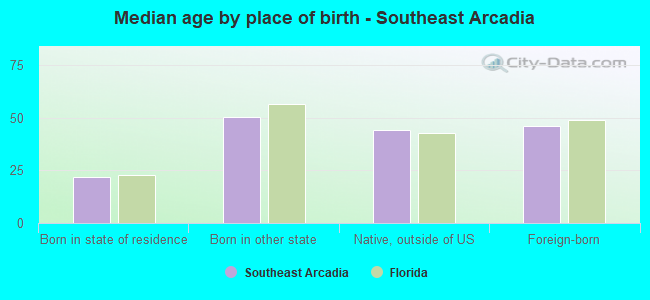
Median age by race in Southeast Arcadia
37.2 Median age for White residents36.6 39.7 20.1 Median age for Black or African American residents19.6 44.3 14.5 Median age for American Indian / Alaska Native residents-611,418,047.3 17.1 -679,966,749.1 Median age for Asian residents-680,591,818.3 -677,857,713.2 -679,849,340.2 Median age for Native Hawaiian / Pacific Islander residents-858,307,848.3 -443,298,968.6 32.5 Median age for Other race residents32.6 31.8 30.0 Median age for Two or more races residents40.2 17.5 50.1 Median age for White alone residents48.4 51.3 32.3 Median age for Hispanic or Latino residents34.2 24.1
Owner/renter occupied households by race in Southeast Arcadia
House owners and renters - White residents 1,262 68.2% Owner occupied587 31.8% Renter occupiedHouse owners and renters - Black or African American residents 50 56.6% Owner occupied38 43.4% Renter occupiedHouse owners and renters - American Indian / Alaska Native residents 20 100.0% Owner occupiedHouse owners and renters - Other race residents 220 37.6% Owner occupied365 62.4% Renter occupiedHouse owners and renters - Two or more races residents 221 86.0% Owner occupied36 14.0% Renter occupiedHouse owners and renters - White alone residents 961 81.2% Owner occupied222 18.8% Renter occupiedHouse owners and renters - Hispanic or Latino residents 713 47.9% Owner occupied776 52.1% Renter occupied
Language usage in Southeast Arcadia
English speakers - Total 52.8% of residents of Southeast Arcadia speak English at home.
45.7% of residents speak Spanish at home 1,729 52.8% Speak English very well1,547 47.2% Speak English less than very well1.4% of residents speak other language at home 23 22.3% Speak English very well80 77.7% Speak English less than very well
English speakers - Born in the United States 74.2% of residents of Southeast Arcadia speak English at home.
25.6% of residents speak Spanish at home 328 76.5% Speak English very well101 23.5% Speak English less than very well
English speakers - Native, born elsewhere 12.3% of residents of Southeast Arcadia speak English at home.
85.4% of residents speak Spanish at home 12 8.2% Speak English very well134 91.8% Speak English less than very well
English speakers - Foreign-born 13.9% of residents of Southeast Arcadia speak English at home.
80.1% of residents speak Spanish at home 356 26.4% Speak English very well993 73.6% Speak English less than very well6.1% of residents speak other language at home 23 22.3% Speak English very well80 77.7% Speak English less than very well
White (Caucasian) - Speak only English Native:
68.3% (2,739)Foreign-born:
19.6% (116)
White (Caucasian) - Speak another language Native:
21.7% (870)Foreign-born:
77.0% (454)
American Indian / Alaska Native - Speak another language Native:
100.0% (113)Foreign-born:
100.0% (33)
Other race - Speak only English Native:
21.0% (119)Foreign-born:
24.5% (133)
Other race - Speak another language Native:
78.6% (447)Foreign-born:
75.3% (410)
Two or more races - Speak another language Native:
19.8% (86)Foreign-born:
100.0% (148)
Hispanic or Latino - Speak only English Native:
19.9% (479)Foreign-born:
15.2% (240)
Hispanic or Latino - Speak another language Native:
78.7% (1,899)Foreign-born:
84.9% (1,343)
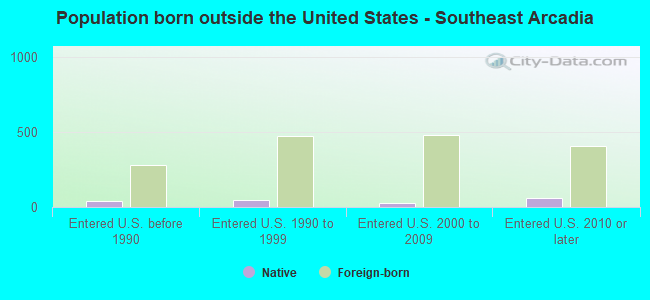
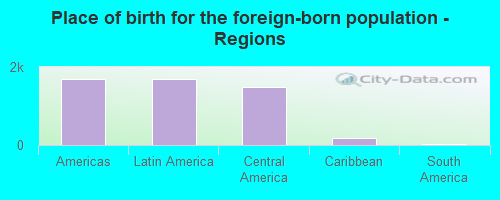
Foreign-born residents in Southeast Arcadia 1,687 residents are foreign born (20.9% Latin America ).
This city:
21.4%Florida:
21.1%
Marital status for residents in Southeast Arcadia Marital status - White (Caucasian) population 15 years and over
Males 35.9% Never married38.1% Now married2.0% Separated3.7% Widowed20.3% DivorcedFemales 25.9% Never married40.5% Now married1.8% Separated14.4% Widowed17.3% DivorcedWomen who did not give birth in the past 12 months Now married:
43.1% (389)Unmarried:
56.9% (513)
Marital status - Black or African American population 15 years and over
Males 66.1% Never married23.9% Now married3.7% Separated4.6% Widowed1.8% DivorcedFemales 23.7% Never married30.4% Now married15.6% Separated0.0% Widowed30.4% DivorcedWomen who gave birth in the past 12 months Now married:
0.0% (0)Unmarried:
100.0% (3)
Women who did not give birth in the past 12 months Now married:
30.7% (27)Unmarried:
69.3% (60)
Marital status - American Indian / Alaska Native population 15 years and over
Males 100.0% Never married0.0% Now married0.0% Separated0.0% Widowed0.0% DivorcedFemales 100.0% Never married0.0% Now married0.0% Separated0.0% Widowed0.0% DivorcedWomen who did not give birth in the past 12 months Now married:
0.0% (0)Unmarried:
100.0% (61)
Marital status - Other race population 15 years and over
Males 46.3% Never married53.7% Now married0.0% Separated0.0% Widowed0.0% DivorcedFemales 34.9% Never married36.5% Now married28.6% Separated0.0% Widowed0.0% DivorcedWomen who did not give birth in the past 12 months Now married:
47.0% (112)Unmarried:
53.0% (126)
Marital status - Two or more races population 15 years and over
Males 48.9% Never married46.8% Now married0.0% Separated0.0% Widowed4.2% DivorcedFemales 45.6% Never married41.5% Now married0.0% Separated12.9% Widowed0.0% DivorcedWomen who gave birth in the past 12 months Now married:
100.0% (53)Unmarried:
0.0% (0)
Women who did not give birth in the past 12 months Now married:
0.0% (0)Unmarried:
100.0% (93)
Marital status - White alone, not Hispanic / Latino population 15 years and over
Males 26.0% Never married34.0% Now married0.0% Separated6.7% Widowed33.2% DivorcedFemales 21.6% Never married28.4% Now married2.8% Separated21.9% Widowed25.4% DivorcedWomen who did not give birth in the past 12 months Now married:
35.9% (201)Unmarried:
64.1% (358)
Marital status - Hispanic or Latino population 15 years and over
Males 42.6% Never married44.4% Now married2.3% Separated1.4% Widowed9.3% DivorcedFemales 36.0% Never married56.2% Now married6.6% Separated0.0% Widowed1.3% DivorcedWomen who gave birth in the past 12 months Now married:
100.0% (36)Unmarried:
0.0% (0)
Women who did not give birth in the past 12 months Now married:
46.2% (338)Unmarried:
53.8% (393)
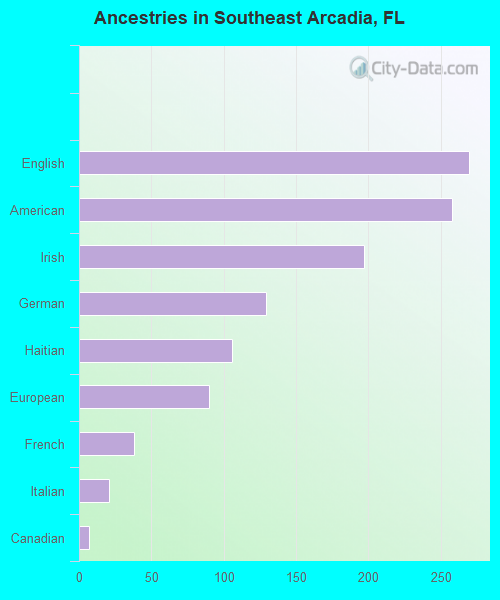
Ancestries in Southeast Arcadia
270 6.0% English258 5.8% American197 4.4% Irish129 2.9% German106 2.4% Haitian90 2.0% European38 0.8% French21 0.5% Italian7 0.2% Canadian
Children Nativity (place of birth) in Southeast Arcadia
Children under 6 years - Living with two parents Both parents native 108 100.0% NativeBoth parents foreign-born 52 100.0% NativeOne native, one foreign-born parent 359 100.0% NativeChildren under 6 years - Living with one parent Native parent 238 100.0% NativeForeign-born parent 32 100.0% NativeChildren 6 to 17 years - Living with two parents Both parents native 130 100.0% NativeBoth parents foreign-born 97 79.9% Native24 20.1% Foreign-bornOne native, one foreign-born parent 288 100.0% NativeChildren 6 to 17 years - Living with one parent Native parent 338 100.0% NativeForeign-born parent 161 50.6% Native157 49.4% Foreign-born
Grandparents responsible for own grandchildren in Southeast Arcadia
Grandparents (30 to 59 years) White / Caucasian 13 24.0% Responsible for grandchildren42 76.0% Not responsible for grandchildrenWhite alone, not Hispanic / Latino 16 40.3% Responsible for grandchildren23 59.7% Not responsible for grandchildrenHispanic or Latino 40 100.0% Not responsible for grandchildren
Grandparents (60 years and over) White / Caucasian 34 100.0% Responsible for grandchildrenWhite alone, not Hispanic / Latino 37 100.0% Responsible for grandchildrenHispanic or Latino 35 100.0% Responsible for grandchildren