Races in Southeast Osage, Oklahoma (OK) Detailed Stats
Ancestries, Foreign-born residents, place of birth
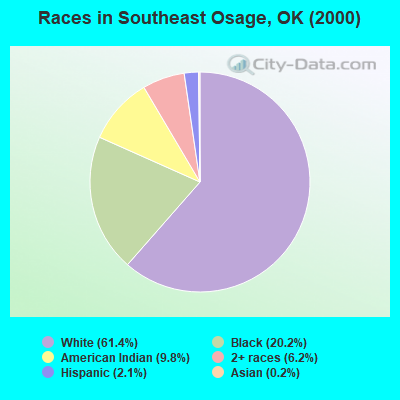
Race distribution in Southeast Osage

- 12,60761.4%White alone
- 4,14820.2%Black alone
- 2,0029.8%American Indian alone
- 1,2746.2%Two or more races
- 4362.1%Hispanic
- 350.2%Asian alone
- 100.05%Other race alone
- 90.04%Native Hawaiian and Other
Pacific Islander alone
2000
2022
-
- 2,556,36874.1%White alone
- 266,1587.7%American Indian alone
- 257,9817.5%Black alone
- 179,3045.2%Hispanic
- 140,2494.1%Two or more races
- 46,1721.3%Asian alone
- 2,3220.07%Other race alone
- 2,1000.06%Native Hawaiian and Other
Pacific Islander alone

-
- 2,517,40362.6%White alone
- 486,69212.1%Hispanic
- 364,4539.1%Two or more races
- 273,6506.8%American Indian alone
- 268,5436.7%Black alone
- 92,6722.3%Asian alone
- 10,7860.3%Other race alone
- 5,6010.1%Native Hawaiian and Other
Pacific Islander alone

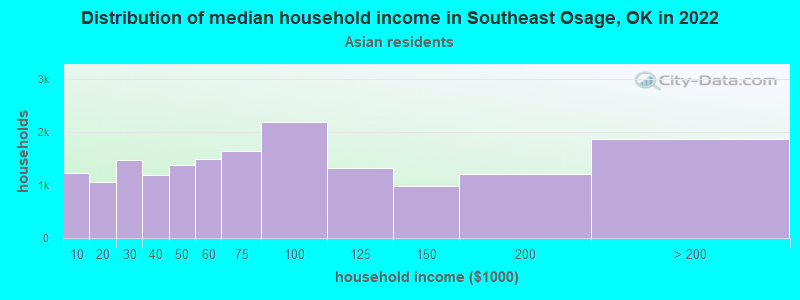
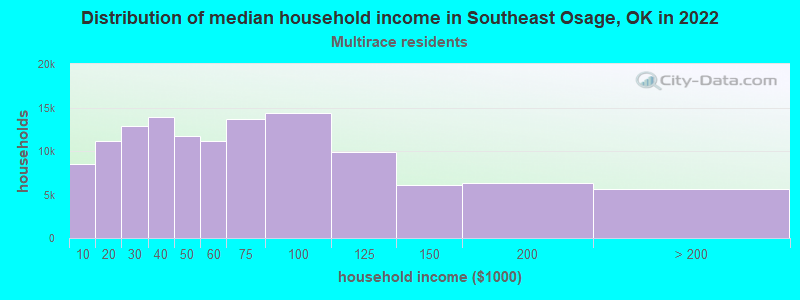
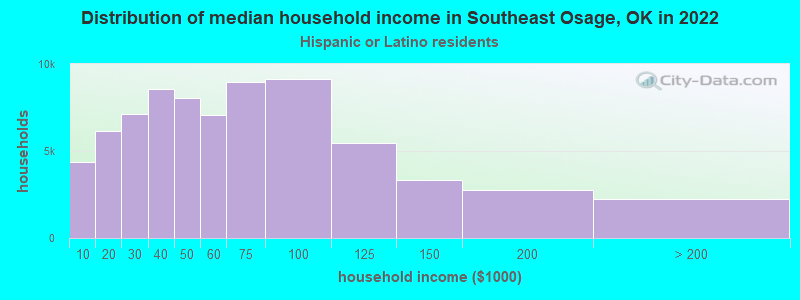
Income and house value in Southeast Osage
- Median household income in 2022
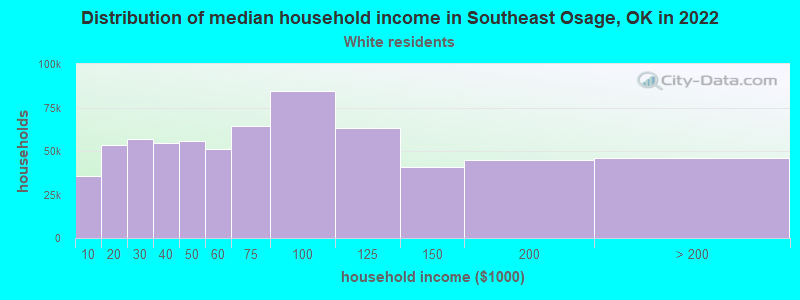
- $75,137White non-Hispanic householders
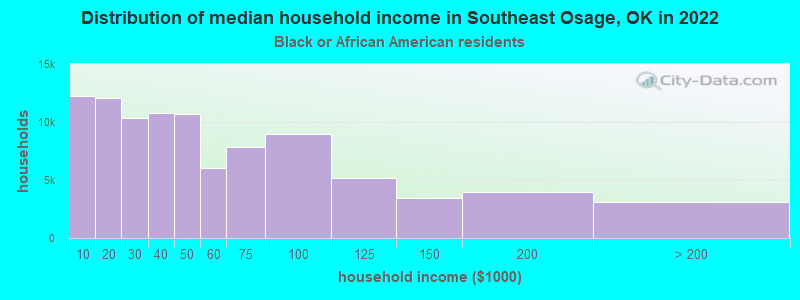
- $82,868Black householders
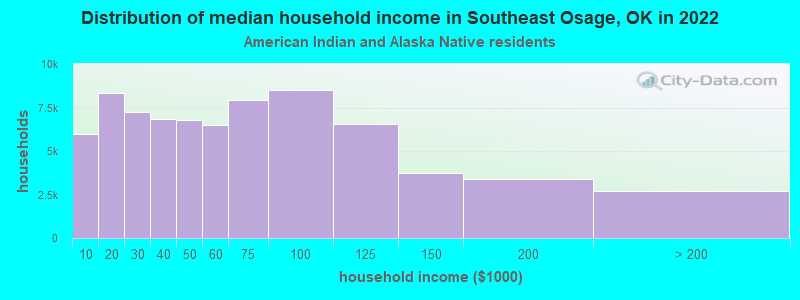
- $79,500American Indian and Alaska Native householders
- $61,047Asian householders
- $19,206Some other race householders
- $76,398Two or more races householders
- $62,865Hispanic or Latino race householders
- Median 2022 house value
- $244,582White Non-Hispanic householders
- $231,423Black or African American householders
- $193,377American Indian or Alaska Native householders
- $224,272Two or more races householders
- $211,113Hispanic or Latino householders
Household income for White non-Hispanic householders
Household income for Black householders
Household income for American Indian and Alaska Native householders
Household income for Asian householders
Household income for Two or more races householders
Household income for Hispanic or Latino race householders
Zip code: 74073