Races in Southlake, Texas (TX) Detailed Stats
Data:
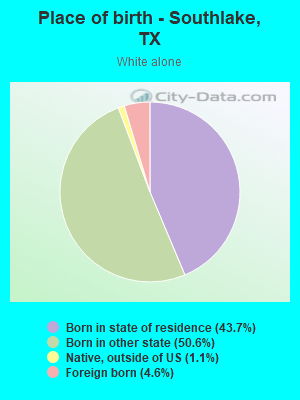
Races - White alone (%)
Races - White alone (% change since 2000)
Races - Black alone (%)
Races - Black alone (% change since 2000)
Races - American Indian alone (%)
Races - American Indian alone (% change since 2000)
Races - Asian alone (%)
Races - Asian alone (% change since 2000)
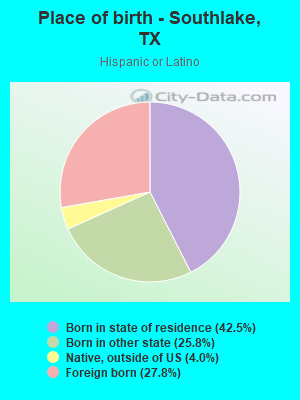
Races - Hispanic (%)
Races - Hispanic (% change since 2000)
Races - Native Hawaiian and Other Pacific Islander alone (%)
Races - Native Hawaiian and Other Pacific Islander alone (% change since 2000)
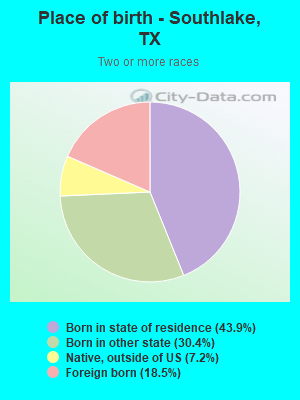
Races - Two or more races(%)
Races - Two or more races(% change since 2000)
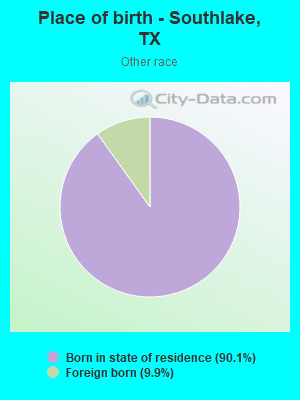
Races - Other race alone (%)
Races - Other race alone (% change since 2000)
Racial diversity
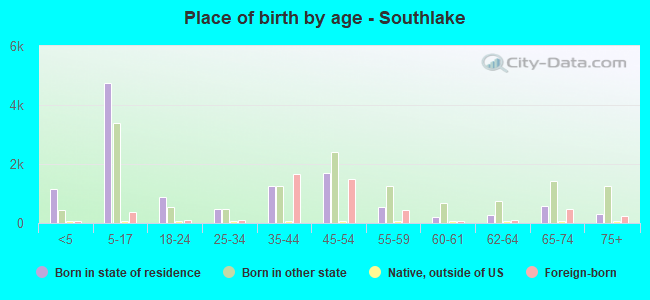
Place of birth - Born in state of residence (%)
Place of birth - Born in state of residence (%) - White
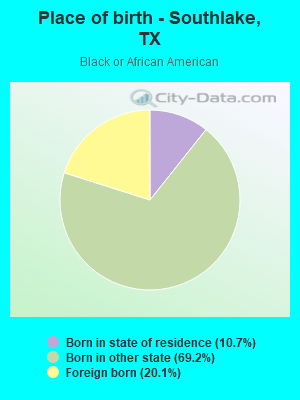
Place of birth - Born in state of residence (%) - Black or African American
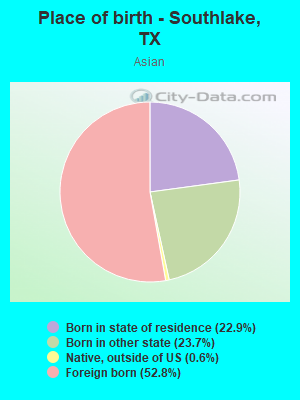
Place of birth - Born in state of residence (%) - Asian
Place of birth - Born in state of residence (%) - Hispanic or Latino
Place of birth - Born in state of residence (%) - American Indian and Alaska Native
Place of birth - Born in state of residence (%) - Multirace
Place of birth - Born in state of residence (%) - Other Race
Place of birth - Born in other state (%)
Place of birth - Born in other state (%) - White
Place of birth - Born in other state (%) - Black or African American
Place of birth - Born in other state (%) - Asian
Place of birth - Born in other state (%) - Hispanic or Latino
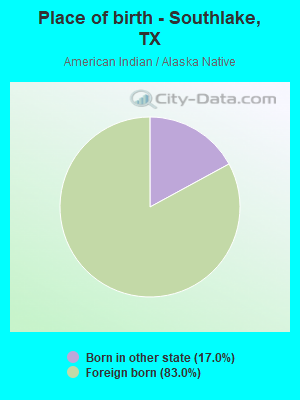
Place of birth - Born in other state (%) - American Indian and Alaska Native
Place of birth - Born in other state (%) - Multirace
Place of birth - Born in other state (%) - Other Race
Place of birth - Native, outside of US (%)
Place of birth - Native, outside of US (%) - White
Place of birth - Native, outside of US (%) - Black or African American
Place of birth - Native, outside of US (%) - Asian
Place of birth - Native, outside of US (%) - Hispanic or Latino
Place of birth - Native, outside of US (%) - American Indian and Alaska Native
Place of birth - Native, outside of US (%) - Multirace
Place of birth - Native, outside of US (%) - Other Race
Place of birth - Foreign born (%)
Place of birth - Foreign born (%) - White
Place of birth - Foreign born (%) - Black or African American
Place of birth - Foreign born (%) - Asian
Place of birth - Foreign born (%) - Hispanic or Latino
Place of birth - Foreign born (%) - American Indian and Alaska Native
Place of birth - Foreign born (%) - Multirace
Place of birth - Foreign born (%) - Other Race
Residents speaking English at home (%)
Residents speaking English at home - Born in the United States (%)
Residents speaking English at home - Native, born elsewhere (%)
Residents speaking English at home - Foreign born (%)
Residents speaking Spanish at home (%)
Residents speaking Spanish at home - Born in the United States (%)
Residents speaking Spanish at home - Native, born elsewhere (%)
Residents speaking Spanish at home - Foreign born (%)
Residents speaking other language at home (%)
Residents speaking other language at home - Born in the United States (%)
Residents speaking other language at home - Native, born elsewhere (%)
Residents speaking other language at home - Foreign born (%)
Marital status - Never married (%)
Marital status - Now married (%)
Marital status - Separated (%)
Marital status - Widowed (%)
Marital status - Divorced (%)
Ancestries Reported - Arab (%)
Ancestries Reported - Czech (%)
Ancestries Reported - Danish (%)
Ancestries Reported - Dutch (%)
Ancestries Reported - English (%)
Ancestries Reported - French (%)
Ancestries Reported - French Canadian (%)
Ancestries Reported - German (%)
Ancestries Reported - Greek (%)
Ancestries Reported - Hungarian (%)
Ancestries Reported - Irish (%)
Ancestries Reported - Italian (%)
Ancestries Reported - Lithuanian (%)
Ancestries Reported - Norwegian (%)
Ancestries Reported - Polish (%)
Ancestries Reported - Portuguese (%)
Ancestries Reported - Russian (%)
Ancestries Reported - Scotch-Irish (%)
Ancestries Reported - Scottish (%)
Ancestries Reported - Slovak (%)
Ancestries Reported - Subsaharan African (%)
Ancestries Reported - Swedish (%)
Ancestries Reported - Swiss (%)
Ancestries Reported - Ukrainian (%)
Ancestries Reported - United States (%)
Ancestries Reported - Welsh (%)
Ancestries Reported - West Indian (%)
Ancestries Reported - Other (%)
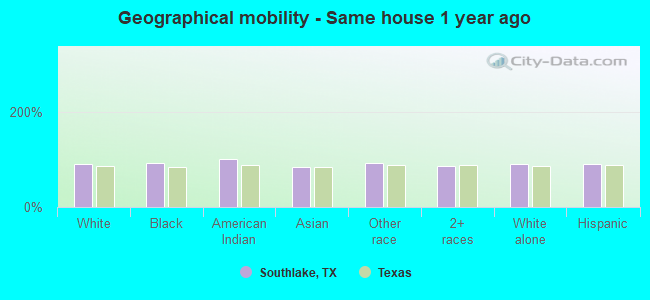
Geographical mobility - Same house 1 year ago (%)
Geographical mobility - Same house 1 year ago (%) - White
Geographical mobility - Same house 1 year ago (%) - Black or African American
Geographical mobility - Same house 1 year ago (%) - Asian
Geographical mobility - Same house 1 year ago (%) - Hispanic or Latino
Geographical mobility - Same house 1 year ago (%) - American Indian and Alaska Native
Geographical mobility - Same house 1 year ago (%) - Multirace
Geographical mobility - Same house 1 year ago (%) - Other Race
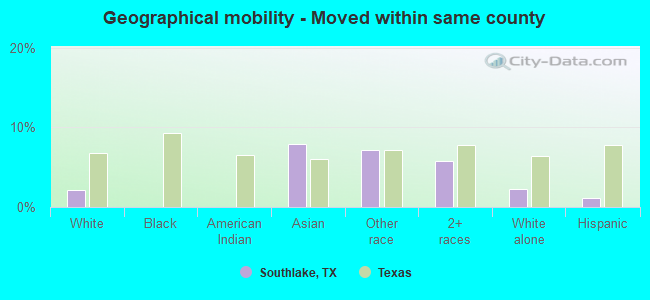
Geographical mobility - Moved within same county (%)
Geographical mobility - Moved within same county (%) - White
Geographical mobility - Moved within same county (%) - Black or African American
Geographical mobility - Moved within same county (%) - Asian
Geographical mobility - Moved within same county (%) - Hispanic or Latino
Geographical mobility - Moved within same county (%) - American Indian and Alaska Native
Geographical mobility - Moved within same county (%) - Multirace
Geographical mobility - Moved within same county (%) - Other Race
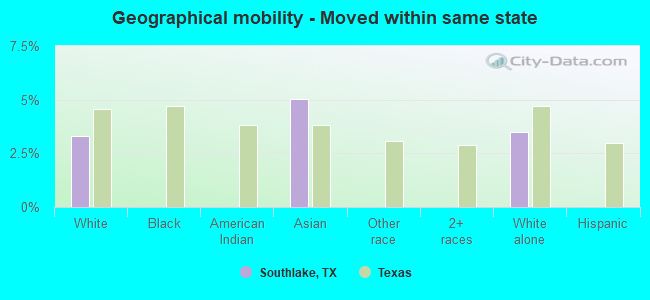
Geographical mobility - Moved from different county within same state (%)
Geographical mobility - Moved from different county within same state (%) - White
Geographical mobility - Moved from different county within same state (%) - Black or African American
Geographical mobility - Moved from different county within same state (%) - Asian
Geographical mobility - Moved from different county within same state (%) - Hispanic or Latino
Geographical mobility - Moved from different county within same state (%) - American Indian and Alaska Native
Geographical mobility - Moved from different county within same state (%) - Multirace
Geographical mobility - Moved from different county within same state (%) - Other Race
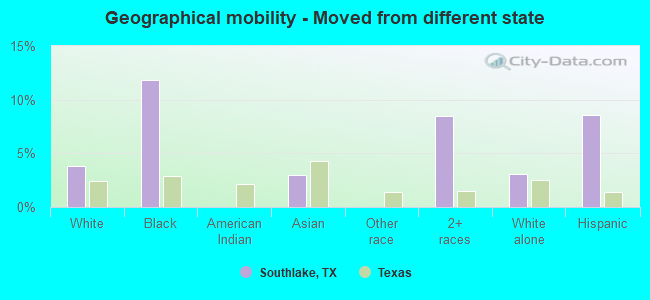
Geographical mobility - Moved from different state (%)
Geographical mobility - Moved from different state (%) - White
Geographical mobility - Moved from different state (%) - Black or African American
Geographical mobility - Moved from different state (%) - Asian
Geographical mobility - Moved from different state (%) - Hispanic or Latino
Geographical mobility - Moved from different state (%) - American Indian and Alaska Native
Geographical mobility - Moved from different state (%) - Multirace
Geographical mobility - Moved from different state (%) - Other Race
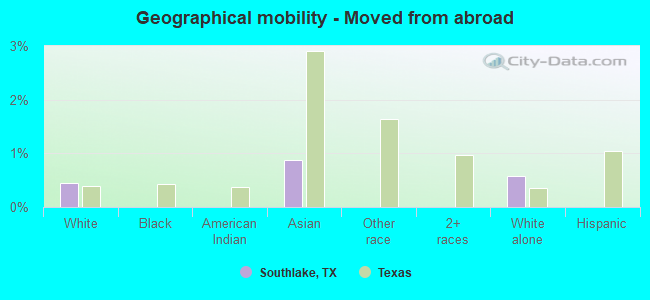
Geographical mobility - Moved from abroad (%)
Geographical mobility - Moved from abroad (%) - White
Geographical mobility - Moved from abroad (%) - Black or African American
Geographical mobility - Moved from abroad (%) - Asian
Geographical mobility - Moved from abroad (%) - Hispanic or Latino
Geographical mobility - Moved from abroad (%) - American Indian and Alaska Native
Geographical mobility - Moved from abroad (%) - Multirace
Geographical mobility - Moved from abroad (%) - Other Race
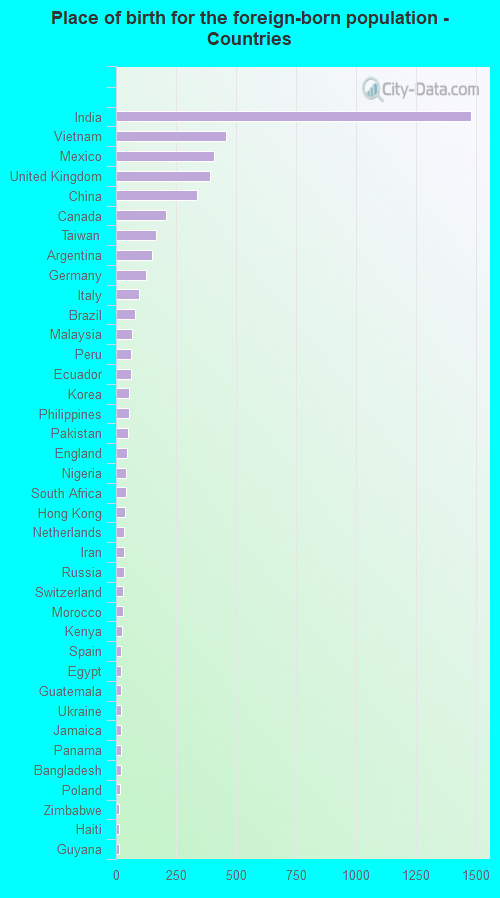
Place of birth for the foreign-born population - Ireland (%)
Place of birth for the foreign-born population - Denmark (%)
Place of birth for the foreign-born population - Norway (%)
Place of birth for the foreign-born population - Sweden (%)
Place of birth for the foreign-born population - United Kingdom (%)
Place of birth for the foreign-born population - England (%)
Place of birth for the foreign-born population - Scotland (%)
Place of birth for the foreign-born population - Other Northern Europe (%)
Place of birth for the foreign-born population - Austria (%)
Place of birth for the foreign-born population - Belgium (%)
Place of birth for the foreign-born population - France (%)
Place of birth for the foreign-born population - Germany (%)
Place of birth for the foreign-born population - Netherlands (%)
Place of birth for the foreign-born population - Switzerland (%)
Place of birth for the foreign-born population - Other Western Europe (%)
Place of birth for the foreign-born population - Greece (%)
Place of birth for the foreign-born population - Italy (%)
Place of birth for the foreign-born population - Portugal (%)
Place of birth for the foreign-born population - Spain (%)
Place of birth for the foreign-born population - Other Southern Europe (%)
Place of birth for the foreign-born population - Albania (%)
Place of birth for the foreign-born population - Belarus (%)
Place of birth for the foreign-born population - Bosnia and Herzegovina (%)
Place of birth for the foreign-born population - Bulgaria (%)
Place of birth for the foreign-born population - Croatia (%)
Place of birth for the foreign-born population - Czechoslovakia (%)
Place of birth for the foreign-born population - Hungary (%)
Place of birth for the foreign-born population - Latvia (%)
Place of birth for the foreign-born population - Lithuania (%)
Place of birth for the foreign-born population - North Macedonia (Macedonia) (%)
Place of birth for the foreign-born population - Moldova (%)
Place of birth for the foreign-born population - Poland (%)
Place of birth for the foreign-born population - Romania (%)
Place of birth for the foreign-born population - Russia (%)
Place of birth for the foreign-born population - Serbia (%)
Place of birth for the foreign-born population - Ukraine (%)
Place of birth for the foreign-born population - Other Eastern Europe (%)
Place of birth for the foreign-born population - China (%)
Place of birth for the foreign-born population - Hong Kong (%)
Place of birth for the foreign-born population - Taiwan (%)
Place of birth for the foreign-born population - Japan (%)
Place of birth for the foreign-born population - Korea (%)
Place of birth for the foreign-born population - Other Eastern Asia (%)
Place of birth for the foreign-born population - Afghanistan (%)
Place of birth for the foreign-born population - Bangladesh (%)
Place of birth for the foreign-born population - India (%)
Place of birth for the foreign-born population - Iran (%)
Place of birth for the foreign-born population - Kazakhstan (%)
Place of birth for the foreign-born population - Nepal (%)
Place of birth for the foreign-born population - Pakistan (%)
Place of birth for the foreign-born population - Sri Lanka (%)
Place of birth for the foreign-born population - Uzbekistan (%)
Place of birth for the foreign-born population - Other South Central Asia (%)
Place of birth for the foreign-born population - Burma (%)
Place of birth for the foreign-born population - Cambodia (%)
Place of birth for the foreign-born population - Indonesia (%)
Place of birth for the foreign-born population - Laos (%)
Place of birth for the foreign-born population - Malaysia (%)
Place of birth for the foreign-born population - Philippines (%)
Place of birth for the foreign-born population - Singapore (%)
Place of birth for the foreign-born population - Thailand (%)
Place of birth for the foreign-born population - Vietnam (%)
Place of birth for the foreign-born population - Other South Eastern Asia (%)
Place of birth for the foreign-born population - Armenia (%)
Place of birth for the foreign-born population - Iraq (%)
Place of birth for the foreign-born population - Israel (%)
Place of birth for the foreign-born population - Jordan (%)
Place of birth for the foreign-born population - Kuwait (%)
Place of birth for the foreign-born population - Lebanon (%)
Place of birth for the foreign-born population - Saudi Arabia (%)
Place of birth for the foreign-born population - Syria (%)
Place of birth for the foreign-born population - Turkey (%)
Place of birth for the foreign-born population - Yemen (%)
Place of birth for the foreign-born population - Other Western Asia (%)
Place of birth for the foreign-born population - Eritrea (%)
Place of birth for the foreign-born population - Ethiopia (%)
Place of birth for the foreign-born population - Kenya (%)
Place of birth for the foreign-born population - Somalia (%)
Place of birth for the foreign-born population - Uganda (%)
Place of birth for the foreign-born population - Zimbabwe (%)
Place of birth for the foreign-born population - Other Eastern Africa (%)
Place of birth for the foreign-born population - Cameroon (%)
Place of birth for the foreign-born population - Congo (%)
Place of birth for the foreign-born population - Democratic Republic of Congo (Zaire) (%)
Place of birth for the foreign-born population - Other Middle Africa (%)
Place of birth for the foreign-born population - Egypt (%)
Place of birth for the foreign-born population - Morocco (%)
Place of birth for the foreign-born population - Sudan (%)
Place of birth for the foreign-born population - Other Northern Africa (%)
Place of birth for the foreign-born population - South Africa (%)
Place of birth for the foreign-born population - Other Southern Africa (%)
Place of birth for the foreign-born population - Cabo Verde (%)
Place of birth for the foreign-born population - Ghana (%)
Place of birth for the foreign-born population - Liberia (%)
Place of birth for the foreign-born population - Nigeria (%)
Place of birth for the foreign-born population - Senegal (%)
Place of birth for the foreign-born population - Sierra Leone (%)
Place of birth for the foreign-born population - Other Western Africa (%)
Place of birth for the foreign-born population - Australia (%)
Place of birth for the foreign-born population - New Zealand (%)
Place of birth for the foreign-born population - Fiji (%)
Place of birth for the foreign-born population - Micronesia (%)
Place of birth for the foreign-born population - Bahamas (%)
Place of birth for the foreign-born population - Barbados (%)
Place of birth for the foreign-born population - Cuba (%)
Place of birth for the foreign-born population - Dominica (%)
Place of birth for the foreign-born population - Dominican Republic (%)
Place of birth for the foreign-born population - Grenada (%)
Place of birth for the foreign-born population - Haiti (%)
Place of birth for the foreign-born population - Jamaica (%)
Place of birth for the foreign-born population - St. Vincent and the Grenadines (%)
Place of birth for the foreign-born population - Trinidad and Tobago (%)
Place of birth for the foreign-born population - West Indies (%)
Place of birth for the foreign-born population - Other Caribbean (%)
Place of birth for the foreign-born population - Belize (%)
Place of birth for the foreign-born population - Costa Rica (%)
Place of birth for the foreign-born population - El Salvador (%)
Place of birth for the foreign-born population - Guatemala (%)
Place of birth for the foreign-born population - Honduras (%)
Place of birth for the foreign-born population - Mexico (%)
Place of birth for the foreign-born population - Nicaragua (%)
Place of birth for the foreign-born population - Panama (%)
Place of birth for the foreign-born population - Other Central America (%)
Place of birth for the foreign-born population - Argentina (%)
Place of birth for the foreign-born population - Bolivia (%)
Place of birth for the foreign-born population - Brazil (%)
Place of birth for the foreign-born population - Chile (%)
Place of birth for the foreign-born population - Colombia (%)
Place of birth for the foreign-born population - Ecuador (%)
Place of birth for the foreign-born population - Guyana (%)
Place of birth for the foreign-born population - Peru (%)
Place of birth for the foreign-born population - Uruguay (%)
Place of birth for the foreign-born population - Venezuela (%)
Place of birth for the foreign-born population - Other South America (%)
Place of birth for the foreign-born population - Canada (%)
Place of birth for the foreign-born population - Other Northern America (%)
Place of birth for the foreign-born population - Other (%)
Latest news about races in Southlake, TX collected exclusively by city-data.com from local newspapers, TV, and radio stations
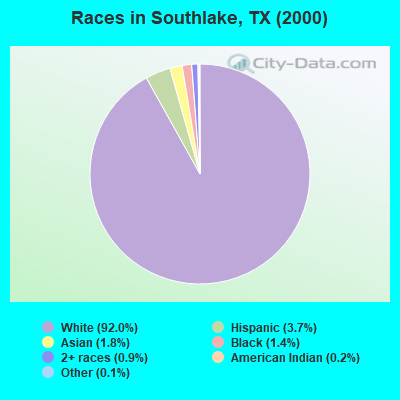
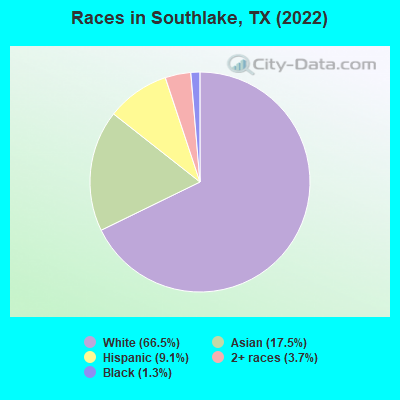
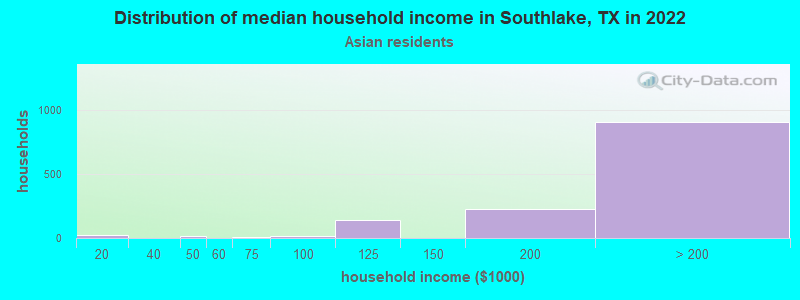
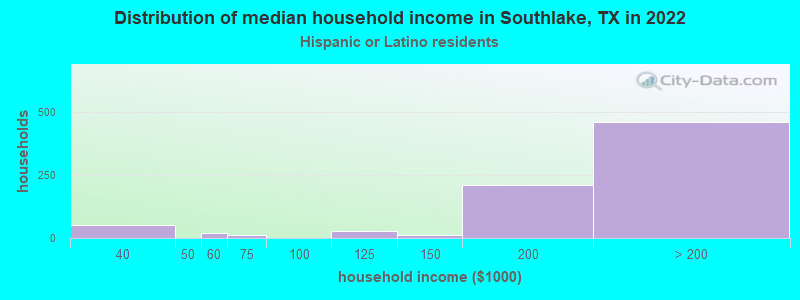
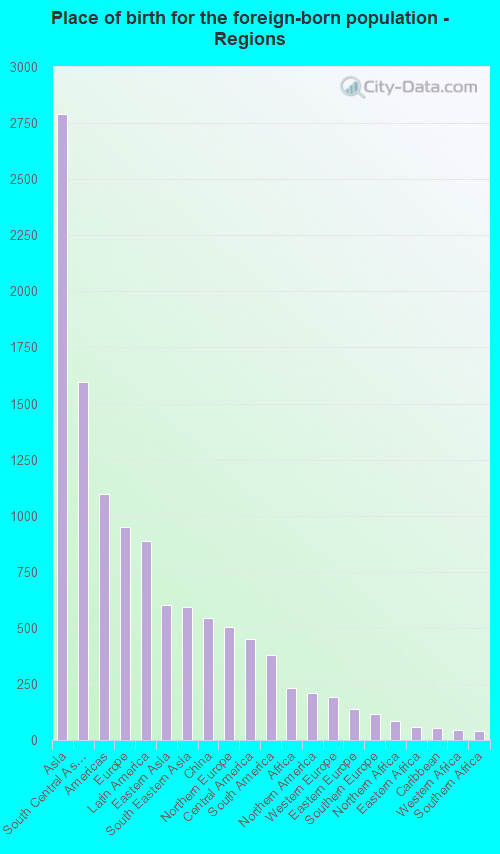
According to 2022 data, the most numerous races in Southlake, TX are Hispanic (2,851 residents), White alone (20,855 residents), and Black alone (420 residents). 79.7% of Southlake residents speak English at home. 16.2% of Southlake, TX residents are foreign-born (8.7% born in Asia, 3.0% born in Europe, 2.8% born in Latin America), which is 5.3% less than the foreign-born rate of 17.0% across the entire state of Texas.
Race distribution in Southlake
2000 2022
10,933,313 52.4% White alone 6,669,666 32.0% Hispanic 2,364,255 11.3% Black alone 554,445 2.7% Asian alone 230,567 1.1% Two or more races 68,859 0.3% American Indian alone 19,958 0.10% Other race alone 10,757 0.05% Native Hawaiian and Other
12,070,642 40.2% Hispanic 11,683,430 38.9% White alone 3,508,706 11.7% Black alone 1,608,173 5.4% Asian alone 956,560 3.2% Two or more races 125,763 0.4% Other race alone 47,023 0.2% American Indian alone 29,275 0.10% Native Hawaiian and Other
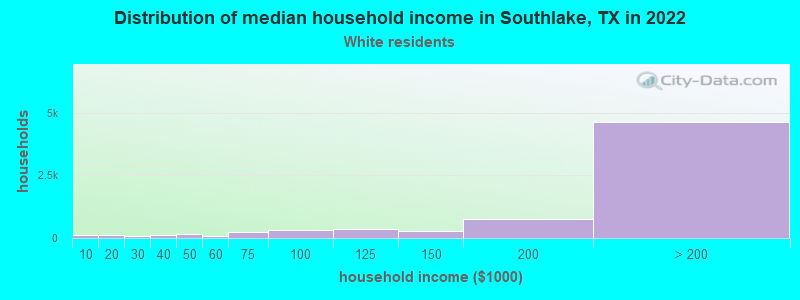
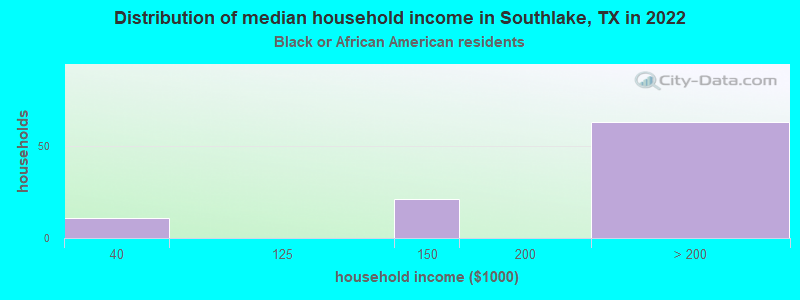
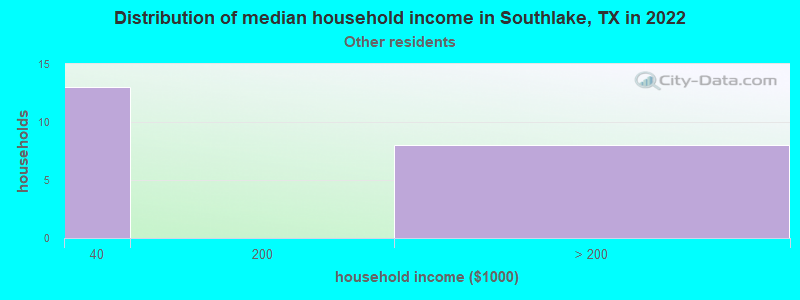
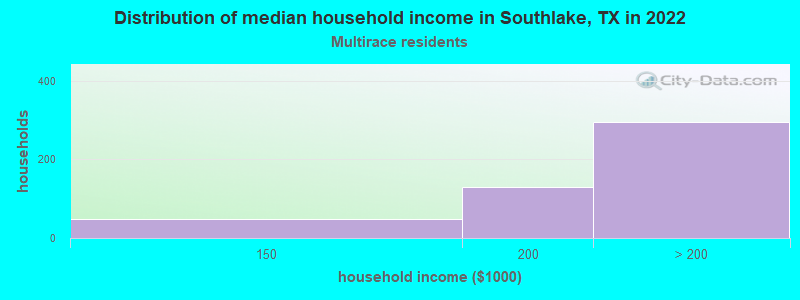
Income and house value in Southlake Median household income in 2022 over $200,000 White non-Hispanic householdersover $200,000 Black householdersover $200,000 Asian householdersover $200,000 Two or more races householdersover $200,000 Hispanic or Latino race householdersMedian 2022 house value over $1,000,000 White Non-Hispanic householders$371,382 Black or African American householdersover $1,000,000 American Indian or Alaska Native householders $910,855 Asian householders$563,234 Some other race householdersover $1,000,000 Two or more races householders$913,202 Hispanic or Latino householders
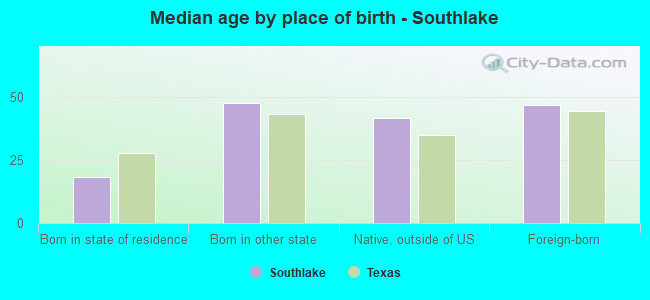
Median age by race in Southlake
47.9 Median age for White residents49.1 45.7 51.1 Median age for Black or African American residents53.2 51.2 21.6 Median age for American Indian / Alaska Native residents22.5 -763,406,939.3 38.3 Median age for Asian residents38.8 37.6 -565,040,649.8 Median age for Native Hawaiian / Pacific Islander residents-550,102,248.9 -551,928,782.8 36.5 Median age for Other race residents18.3 47.1 19.3 Median age for Two or more races residents17.9 24.9 47.5 Median age for White alone residents48.1 45.8 29.4 Median age for Hispanic or Latino residents18.7 32.4
Owner/renter occupied households by race in Southlake
House owners and renters - White residents 6,884 94.7% Owner occupied387 5.3% Renter occupiedHouse owners and renters - Black or African American residents 112 100.0% Owner occupiedHouse owners and renters - Asian residents 1,338 98.4% Owner occupied22 1.6% Renter occupiedHouse owners and renters - Other race residents 37 100.0% Owner occupiedHouse owners and renters - Two or more races residents 461 96.8% Owner occupied15 3.2% Renter occupiedHouse owners and renters - White alone residents 6,826 94.2% Owner occupied424 5.8% Renter occupiedHouse owners and renters - Hispanic or Latino residents 756 97.9% Owner occupied17 2.1% Renter occupied
Language usage in Southlake
English speakers - Total 79.7% of residents of Southlake speak English at home.
5.3% of residents speak Spanish at home 1,443 90.9% Speak English very well145 9.1% Speak English less than very well14.5% of residents speak other language at home 3,493 81.0% Speak English very well819 19.0% Speak English less than very well
English speakers - Born in the United States 90.8% of residents of Southlake speak English at home.
2.8% of residents speak Spanish at home 346 90.3% Speak English very well37 9.7% Speak English less than very well5.7% of residents speak other language at home 746 96.5% Speak English very well27 3.5% Speak English less than very well
English speakers - Native, born elsewhere 74.1% of residents of Southlake speak English at home.
17.2% of residents speak Spanish at home 79 100.0% Speak English very well15.7% of residents speak other language at home 72 100.0% Speak English very well
English speakers - Foreign-born 28.3% of residents of Southlake speak English at home.
14.1% of residents speak Spanish at home 599 85.3% Speak English very well103 14.7% Speak English less than very well57.2% of residents speak other language at home 2,214 78.0% Speak English very well626 22.0% Speak English less than very well
White (Caucasian) - Speak only English Native:
100.0% (18,755)Foreign-born:
77.8% (707)
White (Caucasian) - Speak another language Native:
2.7% (513)Foreign-born:
47.6% (433)
Black or African American - Speak only English Native:
98.6% (341)Foreign-born:
95.1% (88)
American Indian / Alaska Native - Speak only English Native:
91.1% (6)Foreign-born:
42.9% (15)
Asian - Speak only English Native:
57.8% (1,315)Foreign-born:
13.3% (386)
Asian - Speak another language Native:
43.1% (981)Foreign-born:
87.0% (2,518)
Other race - Speak only English Native:
83.2% (145)Foreign-born:
36.6% (7)
Other race - Speak another language Native:
24.4% (43)Foreign-born:
72.1% (13)
Two or more races - Speak only English Native:
68.0% (1,212)Foreign-born:
33.7% (168)
Two or more races - Speak another language Native:
24.0% (428)Foreign-born:
45.7% (228)
White alone - Speak only English Native:
97.7% (18,623)Foreign-born:
79.8% (753)
White alone - Speak another language Native:
2.3% (433)Foreign-born:
29.8% (282)
Hispanic or Latino - Speak only English Native:
67.2% (1,225)Foreign-born:
13.3% (108)
Hispanic or Latino - Speak another language Native:
30.9% (563)Foreign-born:
86.1% (700)
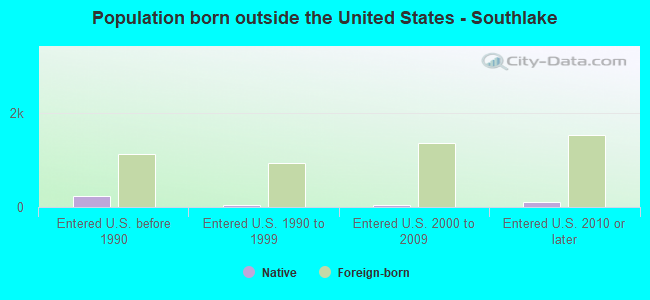
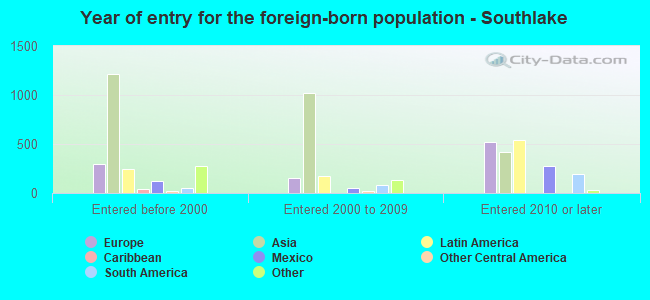
Foreign-born residents in Southlake 5,067 residents are foreign born (8.7% Asia , 3.0% Europe , 2.8% Latin America ).
This city:
16.2%Texas:
17.1%
Marital status for residents in Southlake Marital status - White (Caucasian) population 15 years and over
Males 15.9% Never married77.1% Now married0.8% Separated2.3% Widowed3.9% DivorcedFemales 18.7% Never married70.4% Now married0.0% Separated6.9% Widowed4.1% DivorcedWomen who gave birth in the past 12 months Now married:
100.0% (129)Unmarried:
0.0% (0)
Women who did not give birth in the past 12 months Now married:
61.4% (2,319)Unmarried:
38.6% (1,456)
Marital status - Black or African American population 15 years and over
Males 20.0% Never married62.8% Now married17.2% Separated0.0% Widowed0.0% DivorcedFemales 20.9% Never married71.7% Now married0.0% Separated0.0% Widowed7.3% DivorcedWomen who did not give birth in the past 12 months Now married:
44.4% (34)Unmarried:
55.6% (42)
Marital status - Asian population 15 years and over
Males 16.4% Never married76.5% Now married0.0% Separated2.6% Widowed4.4% DivorcedFemales 18.2% Never married73.8% Now married0.0% Separated8.1% Widowed0.0% DivorcedWomen who gave birth in the past 12 months Now married:
100.0% (43)Unmarried:
0.0% (0)
Women who did not give birth in the past 12 months Now married:
74.2% (1,022)Unmarried:
25.8% (354)
Marital status - Other race population 15 years and over
Males 84.4% Never married15.6% Now married0.0% Separated0.0% Widowed0.0% DivorcedFemales 32.6% Never married37.9% Now married29.5% Separated0.0% Widowed0.0% DivorcedWomen who did not give birth in the past 12 months Now married:
34.0% (15)Unmarried:
66.0% (29)
Marital status - Two or more races population 15 years and over
Males 27.8% Never married72.2% Now married0.0% Separated0.0% Widowed0.0% DivorcedFemales 34.5% Never married60.6% Now married0.0% Separated0.0% Widowed4.9% DivorcedWomen who did not give birth in the past 12 months Now married:
53.0% (385)Unmarried:
47.0% (342)
Marital status - White alone, not Hispanic / Latino population 15 years and over
Males 16.4% Never married76.4% Now married0.8% Separated2.4% Widowed4.0% DivorcedFemales 19.2% Never married70.0% Now married0.0% Separated6.9% Widowed3.9% DivorcedWomen who gave birth in the past 12 months Now married:
100.0% (134)Unmarried:
0.0% (0)
Women who did not give birth in the past 12 months Now married:
58.5% (2,281)Unmarried:
41.5% (1,617)
Marital status - Hispanic or Latino population 15 years and over
Males 22.7% Never married75.8% Now married0.0% Separated0.0% Widowed1.5% DivorcedFemales 20.4% Never married68.1% Now married3.1% Separated3.6% Widowed4.7% DivorcedWomen who gave birth in the past 12 months Now married:
100.0% (14)Unmarried:
0.0% (0)
Women who did not give birth in the past 12 months Now married:
74.9% (520)Unmarried:
25.1% (174)
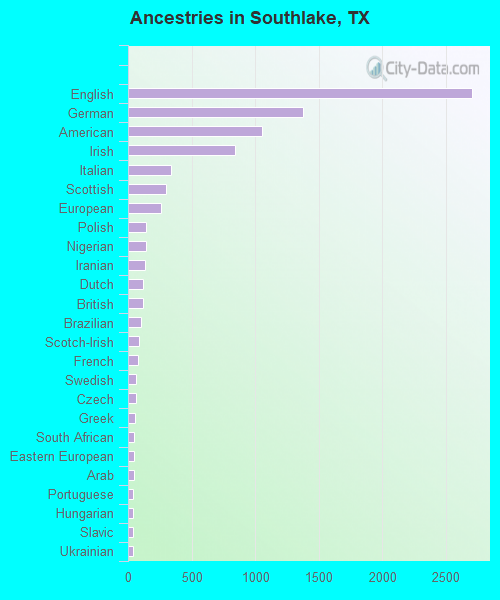
Ancestries in Southlake
2,704 19.0% English1,379 9.7% German1,051 7.4% American843 5.9% Irish336 2.4% Italian299 2.1% Scottish256 1.8% European143 1.0% Polish141 1.0% Nigerian134 0.9% Iranian120 0.8% Dutch119 0.8% British99 0.7% Brazilian89 0.6% Scotch-Irish80 0.6% French64 0.4% Swedish59 0.4% Czech56 0.4% Greek49 0.3% South African47 0.3% Eastern European45 0.3% Arab40 0.3% Portuguese39 0.3% Hungarian36 0.3% Slavic36 0.3% Ukrainian34 0.2% Northern European34 0.2% Estonian33 0.2% French Canadian33 0.2% Turkish30 0.2% Russian27 0.2% Lithuanian27 0.2% Welsh27 0.2% Jamaican25 0.2% Lebanese25 0.2% Finnish21 0.1% Egyptian17 0.1% Austrian17 0.1% Swiss15 0.1% Romanian15 0.1% Danish14 0.10% Norwegian12 0.08% Moroccan12 0.08% Croatian10 0.07% Guyanese9 0.06% Scandinavian8 0.06% Belgian
Geographical mobility in Southlake Same house 1 year ago 18,342 90.5% White (Caucasian)404 92.0% Black or African American35 100.0% American Indian / Alaska Native4,577 83.3% Asian177 93.0% Other race2,298 85.4% Two or more races18,833 90.9% White alone, not Hispanic / Latino2,554 90.4% Hispanic or LatinoMoved within same county 420 2.1% White / Caucasian437 8.0% Asian14 7.1% Other race155 5.7% Two or more races473 2.3% White alone, not Hispanic / Latino31 1.1% Hispanic or LatinoMoved within same state 669 3.3% White / Caucasian276 5.0% Asian721 3.5% White alone, not Hispanic / LatinoMoved from different state 781 3.9% White / Caucasian52 11.9% Black or African American162 3.0% Asian228 8.5% Two or more races637 3.1% White alone, not Hispanic / Latino243 8.6% Hispanic or LatinoMoved from abroad 91 0.4% White48 0.9% Asian119 0.6% White alone, not Hispanic / Latino
Children Nativity (place of birth) in Southlake
Children under 6 years - Living with two parents Both parents native 1,006 100.0% NativeBoth parents foreign-born 320 84.3% Native60 15.7% Foreign-bornOne native, one foreign-born parent 469 100.0% NativeChildren under 6 years - Living with one parent Native parent 13 100.0% NativeChildren 6 to 17 years - Living with two parents Both parents native 5,090 99.1% Native44 0.9% Foreign-bornBoth parents foreign-born 1,444 83.4% Native288 16.6% Foreign-bornOne native, one foreign-born parent 802 100.0% NativeChildren 6 to 17 years - Living with one parent Native parent 395 100.0% NativeForeign-born parent 223 49.9% Native224 50.1% Foreign-born
Grandparents responsible for own grandchildren in Southlake
Grandparents (30 to 59 years) White / Caucasian 47 100.0% Responsible for grandchildrenAsian 18 56.5% Responsible for grandchildren14 43.5% Not responsible for grandchildrenWhite alone, not Hispanic / Latino 57 100.0% Responsible for grandchildrenGrandparents (60 years and over) White / Caucasian 14 8.0% Responsible for grandchildren162 92.0% Not responsible for grandchildrenAsian 435 100.0% Not responsible for grandchildrenWhite alone, not Hispanic / Latino 15 8.7% Responsible for grandchildren161 91.3% Not responsible for grandchildren