Races in Southwest Jackson, Oregon (OR) Detailed Stats
Ancestries, Foreign-born residents, place of birth
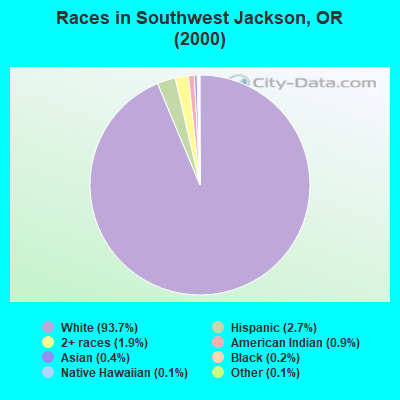
Race distribution in Southwest Jackson

- 10,35493.7%White alone
- 2942.7%Hispanic
- 2121.9%Two or more races
- 980.9%American Indian alone
- 430.4%Asian alone
- 200.2%Black alone
- 120.1%Other race alone
- 160.1%Native Hawaiian and Other
Pacific Islander alone
2000
2022
-
- 2,857,61683.5%White alone
- 275,3148.0%Hispanic
- 100,3332.9%Asian alone
- 82,7332.4%Two or more races
- 53,3251.6%Black alone
- 40,1301.2%American Indian alone
- 7,3980.2%Native Hawaiian and Other
Pacific Islander alone - 4,5500.1%Other race alone

-
- 3,037,57171.6%White alone
- 609,53814.4%Hispanic
- 252,7446.0%Two or more races
- 191,2834.5%Asian alone
- 78,2281.8%Black alone
- 29,3990.7%American Indian alone
- 25,7310.6%Other race alone
- 15,6430.4%Native Hawaiian and Other
Pacific Islander alone

Income and house value in Southwest Jackson
- Median household income in 2022
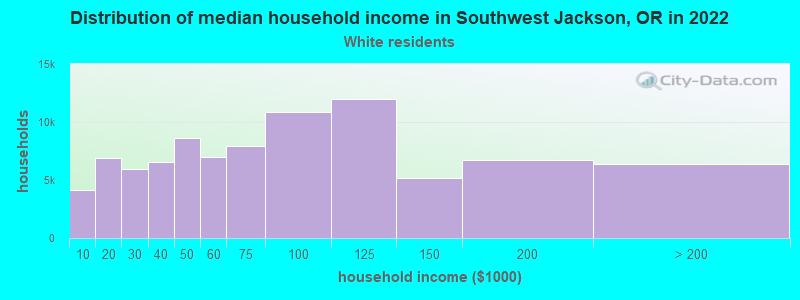
- $79,545White non-Hispanic householders
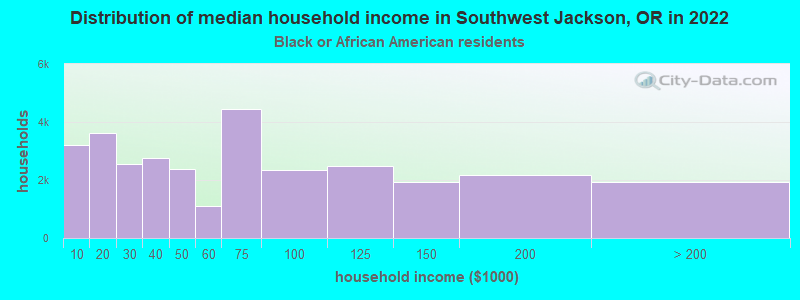
- $59,998Black householders
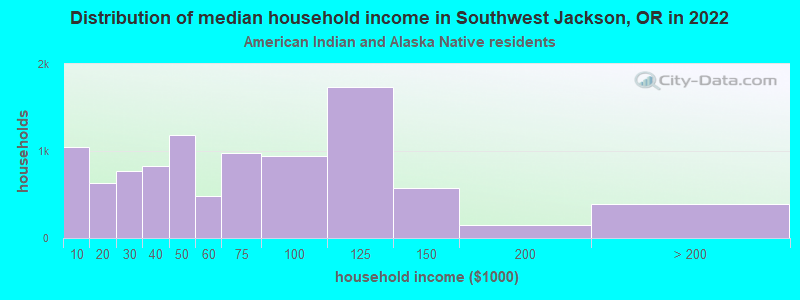
- $47,567American Indian and Alaska Native householders
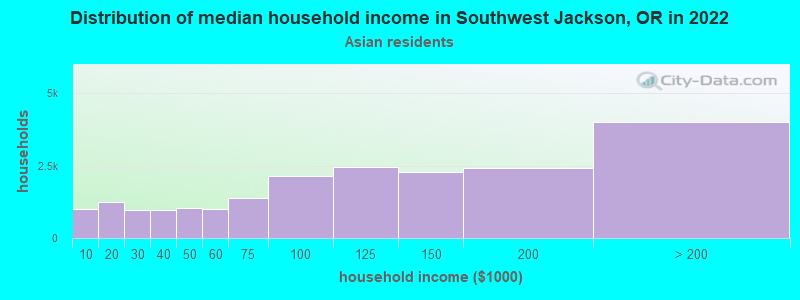
- $35,929Asian householders
- $68,395Some other race householders
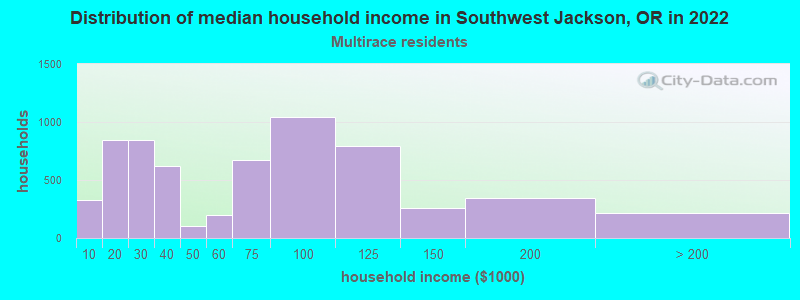
- $49,192Two or more races householders
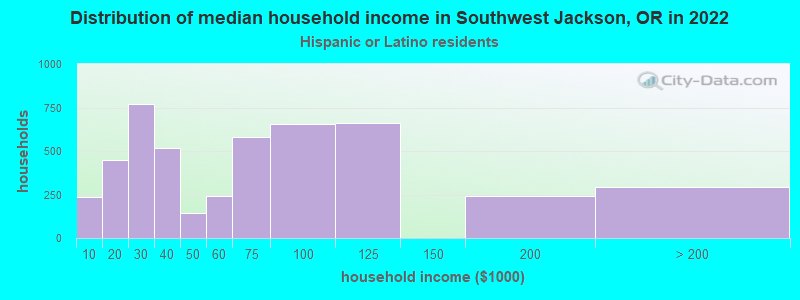
- $32,893Hispanic or Latino race householders
- Median 2022 house value
- $577,160White Non-Hispanic householders
- $362,537Black or African American householders
- $306,143American Indian or Alaska Native householders
- $312,265Two or more races householders
- $725,075Hispanic or Latino householders
Household income for White non-Hispanic householders
Household income for Black householders
Household income for American Indian and Alaska Native householders
Household income for Asian householders
Household income for Two or more races householders
Household income for Hispanic or Latino race householders
Zip code: 97530