Races in Spackenkill, New York (NY) Detailed Stats
Ancestries, Foreign-born residents, place of birth
Settings
X


Recent posts about races in Spackenkill, New York on our local forum with over 2,400,000 registered users:
 | Hispanic/Latino communities in Upstate NY (820 replies) |
| smaller Upstate NY cities and towns/African American communities (6005 replies) |
| Northern Wappinger falls (1 reply) |
| commuting from poughkeepsie to times square (30 replies) |
| Anyone Commute From Dutchess County (i.e. Poughkeepsie, Wappinger Falls, Beacon etc) To NYC Daily? (34 replies) |
| putnam, dutchess county (4 replies) |
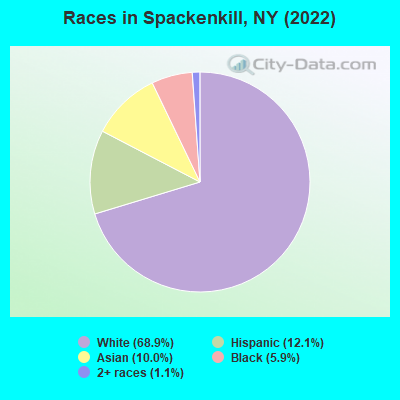
According to 2022 data, the most numerous races in Spackenkill, NY are White alone (2,998 residents), Hispanic (526 residents), and Black alone (255 residents). 70.1% of Spackenkill residents speak English at home. 18.3% of Spackenkill, NY residents are foreign-born (9.7% born in Asia, 5.2% born in Latin America, 2.2% born in Europe), which is 20.1% less than the foreign-born rate of 22.0% across the entire state of New York.
Race distribution in Spackenkill
2000
2022

- 3,96483.3%White alone
- 3166.6%Asian alone
- 2375.0%Hispanic
- 1693.6%Black alone
- 611.3%Two or more races
- 50.1%Other race alone
- 30.06%American Indian alone
- 10.02%Native Hawaiian and Other
Pacific Islander alone

-
- 2,99868.9%White alone
- 52612.1%Hispanic
- 43710.0%Asian alone
- 2555.9%Black alone
- 471.1%Two or more races
2000
2022
-
- 11,760,98162.0%White alone
- 2,867,58315.1%Hispanic
- 2,812,62314.8%Black alone
- 1,035,9265.5%Asian alone
- 366,1161.9%Two or more races
- 75,4990.4%Other race alone
- 52,4990.3%American Indian alone
- 5,2300.03%Native Hawaiian and Other
Pacific Islander alone

-
- 10,408,93352.9%White alone
- 3,867,29919.7%Hispanic
- 2,633,84013.4%Black alone
- 1,776,2869.0%Asian alone
- 732,6703.7%Two or more races
- 216,1101.1%Other race alone
- 35,0820.2%American Indian alone
- 6,9310.04%Native Hawaiian and Other
Pacific Islander alone

Income and house value in Spackenkill
- Median household income in 2022
- $159,473White non-Hispanic householders
- $38,004Black householders
- $119,527Asian householders
- $31,466Two or more races householders
- $34,424Hispanic or Latino race householders
- Median 2022 house value
- $393,818White Non-Hispanic householders
- $361,095Black or African American householders
- $314,642American Indian or Alaska Native householders
- $430,202Asian householders
- $424,939Some other race householders
- $382,376Hispanic or Latino householders
Household income for White non-Hispanic householders

Household income for Black householders

Household income for Asian householders

Household income for Some other race householders

Household income for Two or more races householders

Household income for Hispanic or Latino race householders

Median age by race in Spackenkill
- 45.6Median age for White residents
- 41.6Males
- 46.4Females
- 50.7Median age for Black or African American residents
- 53.0Males
- 53.6Females
- -815,273,477.0Median age for American Indian / Alaska Native residents
- -796,352,582.8Males
- -969,474,968.5Females
- 66.5Median age for Asian residents
- 65.8Males
- 63.6Females
- -663,333,332.7Median age for Native Hawaiian / Pacific Islander residents
- -477,502,295.2Males
- -497,387,669.3Females
- 45.4Median age for Other race residents
- -664,621,676.2Males
- 31.3Females
- 59.2Median age for Two or more races residents
- 67.0Males
- 9.5Females
- 43.9Median age for White alone residents
- 41.3Males
- 45.9Females
- 48.1Median age for Hispanic or Latino residents
- 48.5Males
- 46.6Females
Owner/renter occupied households by race in Spackenkill
- House owners and renters - White residents
- 1,10998.5%Owner occupied
- 171.5%Renter occupied
- House owners and renters - Black or African American residents
- 8693.1%Owner occupied
- 66.9%Renter occupied
- House owners and renters - Asian residents
- 17884.9%Owner occupied
- 3215.1%Renter occupied
- House owners and renters - Other race residents
- 122100.0%Owner occupied
- House owners and renters - Two or more races residents
- 116.2%Owner occupied
- 16593.8%Renter occupied
- House owners and renters - White alone residents
- 1,08098.4%Owner occupied
- 181.6%Renter occupied
- House owners and renters - Hispanic or Latino residents
- 12648.6%Owner occupied
- 13451.4%Renter occupied
Language usage in Spackenkill
- English speakers - Total
- 70.1% of residents of Spackenkill speak English at home.
- 11.2% of residents speak Spanish at home
- 30965.6%Speak English very well
- 16234.4%Speak English less than very well
- 19.6% of residents speak other language at home
- 60873.8%Speak English very well
- 21626.2%Speak English less than very well
- English speakers - Born in the United States
- 86.5% of residents of Spackenkill speak English at home.
- 12.7% of residents speak Spanish at home
- 1318.6%Speak English very well
- 5781.4%Speak English less than very well
- 2.2% of residents speak other language at home
- 12100.0%Speak English very well
- English speakers - Native, born elsewhere
- 0.0% of residents of Spackenkill speak English at home.
- 62.3% of residents speak Spanish at home
- 86100.0%Speak English very well
- English speakers - Foreign-born
- 11.6% of residents of Spackenkill speak English at home.
- 19.2% of residents speak Spanish at home
- 8650.9%Speak English very well
- 8349.1%Speak English less than very well
- 72.9% of residents speak other language at home
- 40563.2%Speak English very well
- 23636.8%Speak English less than very well
White (Caucasian) - Speak only English
| Native: | 89.7% (2,460) |
| Foreign-born: | 9.3% (26) |
White (Caucasian) - Speak another language
| Native: | 9.0% (247) |
| Foreign-born: | 93.1% (263) |
Black or African American - Speak only English
| Native: | 94.5% (163) |
| Foreign-born: | 63.8% (71) |
Black or African American - Speak another language
| Native: | 5.5% (10) |
| Foreign-born: | 36.9% (41) |
Asian - Speak only English
| Native: | 65.1% (33) |
| Foreign-born: | 2.5% (9) |
Asian - Speak another language
| Native: | 35.5% (18) |
| Foreign-born: | 100.0% (371) |
Other race - Speak another language
| Native: | 55.2% (48) |
| Foreign-born: | 100.0% (70) |
White alone - Speak only English
| Native: | 90.6% (2,432) |
| Foreign-born: | 12.7% (27) |
White alone - Speak another language
| Native: | 8.5% (228) |
| Foreign-born: | 93.8% (198) |
Hispanic or Latino - Speak another language
| Native: | 65.3% (227) |
| Foreign-born: | 100.0% (167) |
Foreign-born residents in Spackenkill
797 residents are foreign born (9.7% Asia, 5.2% Latin America, 2.2% Europe).
| This city: | 18.3% |
| New York: | 22.6% |


Marital status for residents in Spackenkill
Marital status - White (Caucasian) population 15 years and over
- Males
- 32.8%Never married
- 61.5%Now married
- 1.9%Separated
- 2.5%Widowed
- 1.4%Divorced
- Females
- 24.5%Never married
- 60.9%Now married
- 1.6%Separated
- 5.4%Widowed
- 7.6%Divorced
Women who gave birth in the past 12 months
| Now married: | 100.0% (8) |
| Unmarried: | 0.0% (0) |
Women who did not give birth in the past 12 months
| Now married: | 46.4% (272) |
| Unmarried: | 53.6% (315) |
Marital status - Black or African American population 15 years and over
- Males
- 47.0%Never married
- 53.0%Now married
- 0.0%Separated
- 0.0%Widowed
- 0.0%Divorced
- Females
- 58.9%Never married
- 30.5%Now married
- 0.0%Separated
- 0.0%Widowed
- 10.5%Divorced
Women who did not give birth in the past 12 months
| Now married: | 11.6% (12) |
| Unmarried: | 88.4% (90) |
Marital status - Asian population 15 years and over
- Males
- 1.8%Never married
- 98.2%Now married
- 0.0%Separated
- 0.0%Widowed
- 0.0%Divorced
- Females
- 22.7%Never married
- 61.7%Now married
- 0.0%Separated
- 8.4%Widowed
- 7.1%Divorced
Women who gave birth in the past 12 months
| Now married: | 100.0% (7) |
| Unmarried: | 0.0% (0) |
Women who did not give birth in the past 12 months
| Now married: | 23.9% (11) |
| Unmarried: | 76.1% (36) |
Marital status - Other race population 15 years and over
- Males
- 40.4%Never married
- 59.6%Now married
- 0.0%Separated
- 0.0%Widowed
- 0.0%Divorced
- Females
- 17.7%Never married
- 82.3%Now married
- 0.0%Separated
- 0.0%Widowed
- 0.0%Divorced
Women who did not give birth in the past 12 months
| Now married: | 69.4% (40) |
| Unmarried: | 30.6% (18) |
Marital status - Two or more races population 15 years and over
- Males
- 14.3%Never married
- 0.0%Now married
- 0.0%Separated
- 0.0%Widowed
- 85.7%Divorced
- Females
- 0.0%Never married
- 100.0%Now married
- 0.0%Separated
- 0.0%Widowed
- 0.0%Divorced
Marital status - White alone, not Hispanic / Latino population 15 years and over
- Males
- 32.5%Never married
- 61.4%Now married
- 2.0%Separated
- 2.6%Widowed
- 1.5%Divorced
- Females
- 25.3%Never married
- 60.4%Now married
- 1.7%Separated
- 5.8%Widowed
- 6.8%Divorced
Women who gave birth in the past 12 months
| Now married: | 100.0% (9) |
| Unmarried: | 0.0% (0) |
Women who did not give birth in the past 12 months
| Now married: | 43.0% (230) |
| Unmarried: | 57.0% (304) |
Marital status - Hispanic or Latino population 15 years and over
- Males
- 28.4%Never married
- 28.8%Now married
- 0.0%Separated
- 0.0%Widowed
- 42.8%Divorced
- Females
- 14.1%Never married
- 75.0%Now married
- 0.0%Separated
- 0.0%Widowed
- 10.9%Divorced
Women who did not give birth in the past 12 months
| Now married: | 71.7% (82) |
| Unmarried: | 28.3% (32) |
Ancestries in Spackenkill

- 30412.6%Eastern European
- 2179.0%Irish
- 1887.8%Italian
- 1586.5%Israeli
- 1154.7%American
- 1074.4%European
- 753.1%British West Indian
- 401.7%English
- 351.4%Greek
- 251.0%Maltese
- 190.8%Hungarian
- 180.7%Jordanian
- 180.7%Russian
- 170.7%German
- 170.7%Scottish
- 150.6%Lithuanian
- 140.6%Iranian
- 130.5%Polish
- 100.4%Danish
- 100.4%Scandinavian
- 100.4%Swedish
- 70.3%Dutch
- 70.3%Norwegian
- 70.3%Portuguese
- 60.2%Yugoslavian
- 40.2%Jamaican

Geographical mobility in Spackenkill

- Same house 1 year ago
- 2,84791.0%White (Caucasian)
- 25594.6%Black or African American
- 38690.6%Asian
- 179100.0%Other race
- 24798.3%Two or more races
- 2,76292.3%White alone, not Hispanic / Latino
- 47490.2%Hispanic or Latino

-
- Moved within same county
- 622.0%White / Caucasian
- 184.2%Asian
- 662.2%White alone, not Hispanic / Latino

-
- Moved within same state
- 1605.1%White / Caucasian
- 228.3%Black or African American
- 933.1%White alone, not Hispanic / Latino
- 6111.7%Hispanic or Latino

-
- Moved from different state
- 792.5%White / Caucasian
- 83.1%Two or more races
- 762.6%White alone, not Hispanic / Latino

Children Nativity (place of birth) in Spackenkill
Place of birth for residents in Spackenkill
![Place of birth for the foreign-born population - Regions]()
- 415Asia
- 285Americas
- 222Latin America
- 180Eastern Asia
- 172China
- 109South Central Asia
- 106Western Asia
- 106Central America
- 95Europe
- 90Caribbean
- 63Northern America
- 59Southern Europe
- 25South America
- 18South Eastern Asia
- 17Eastern Europe
- 9Northern Europe
- 8Western Europe

![Place of birth for the foreign-born population - Countries]()
- 87Hong Kong
- 83Israel
- 74India
- 63Canada
- 58China
- 53Honduras
- 53Mexico
- 30Greece
- 27Bangladesh
- 26Taiwan
- 25Argentina
- 20Haiti
- 18Italy
- 16Dominican Republic
- 15Jordan
- 10Philippines
- 9Ireland
- 9Spain
- 8Germany
- 8Bosnia and Herzegovina
- 8Hungary
- 7Korea
- 7Iran
- 7Indonesia
- 7Georgia
- 4Jamaica

Grandparents responsible for own grandchildren in Spackenkill
Zip codes: 12603.