Races in Spearfish, South Dakota (SD) Detailed Stats
Data:
Races - White alone (%)
Races - White alone (% change since 2000)
Races - Black alone (%)
Races - Black alone (% change since 2000)
Races - American Indian alone (%)
Races - American Indian alone (% change since 2000)
Races - Asian alone (%)
Races - Asian alone (% change since 2000)
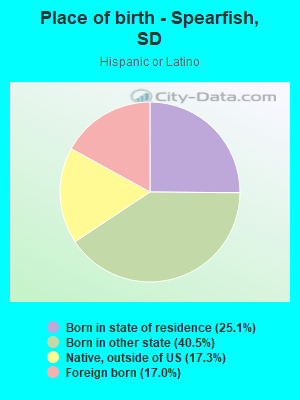
Races - Hispanic (%)
Races - Hispanic (% change since 2000)
Races - Native Hawaiian and Other Pacific Islander alone (%)
Races - Native Hawaiian and Other Pacific Islander alone (% change since 2000)
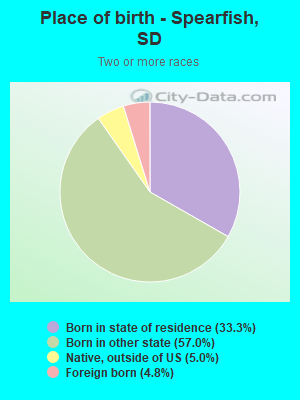
Races - Two or more races(%)
Races - Two or more races(% change since 2000)
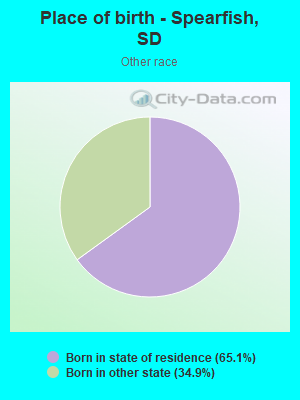
Races - Other race alone (%)
Races - Other race alone (% change since 2000)
Racial diversity
Place of birth - Born in state of residence (%)
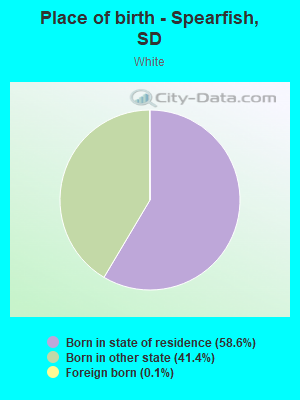
Place of birth - Born in state of residence (%) - White
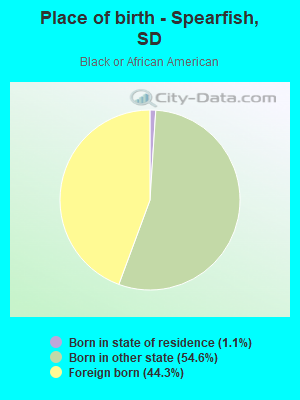
Place of birth - Born in state of residence (%) - Black or African American
Place of birth - Born in state of residence (%) - Asian
Place of birth - Born in state of residence (%) - Hispanic or Latino
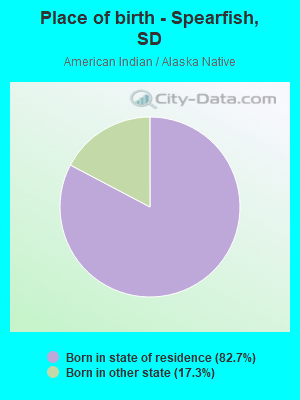
Place of birth - Born in state of residence (%) - American Indian and Alaska Native
Place of birth - Born in state of residence (%) - Multirace
Place of birth - Born in state of residence (%) - Other Race
Place of birth - Born in other state (%)
Place of birth - Born in other state (%) - White
Place of birth - Born in other state (%) - Black or African American
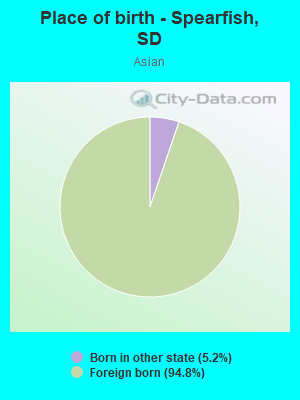
Place of birth - Born in other state (%) - Asian
Place of birth - Born in other state (%) - Hispanic or Latino
Place of birth - Born in other state (%) - American Indian and Alaska Native
Place of birth - Born in other state (%) - Multirace
Place of birth - Born in other state (%) - Other Race
Place of birth - Native, outside of US (%)
Place of birth - Native, outside of US (%) - White
Place of birth - Native, outside of US (%) - Black or African American
Place of birth - Native, outside of US (%) - Asian
Place of birth - Native, outside of US (%) - Hispanic or Latino
Place of birth - Native, outside of US (%) - American Indian and Alaska Native
Place of birth - Native, outside of US (%) - Multirace
Place of birth - Native, outside of US (%) - Other Race
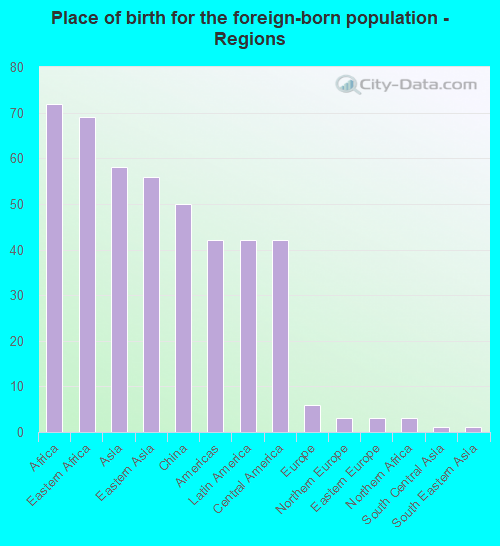
Place of birth - Foreign born (%)
Place of birth - Foreign born (%) - White
Place of birth - Foreign born (%) - Black or African American
Place of birth - Foreign born (%) - Asian
Place of birth - Foreign born (%) - Hispanic or Latino
Place of birth - Foreign born (%) - American Indian and Alaska Native
Place of birth - Foreign born (%) - Multirace
Place of birth - Foreign born (%) - Other Race
Residents speaking English at home (%)
Residents speaking English at home - Born in the United States (%)
Residents speaking English at home - Native, born elsewhere (%)
Residents speaking English at home - Foreign born (%)
Residents speaking Spanish at home (%)
Residents speaking Spanish at home - Born in the United States (%)
Residents speaking Spanish at home - Native, born elsewhere (%)
Residents speaking Spanish at home - Foreign born (%)
Residents speaking other language at home (%)
Residents speaking other language at home - Born in the United States (%)
Residents speaking other language at home - Native, born elsewhere (%)
Residents speaking other language at home - Foreign born (%)
Marital status - Never married (%)
Marital status - Now married (%)
Marital status - Separated (%)
Marital status - Widowed (%)
Marital status - Divorced (%)
Ancestries Reported - Arab (%)
Ancestries Reported - Czech (%)
Ancestries Reported - Danish (%)
Ancestries Reported - Dutch (%)
Ancestries Reported - English (%)
Ancestries Reported - French (%)
Ancestries Reported - French Canadian (%)
Ancestries Reported - German (%)
Ancestries Reported - Greek (%)
Ancestries Reported - Hungarian (%)
Ancestries Reported - Irish (%)
Ancestries Reported - Italian (%)
Ancestries Reported - Lithuanian (%)
Ancestries Reported - Norwegian (%)
Ancestries Reported - Polish (%)
Ancestries Reported - Portuguese (%)
Ancestries Reported - Russian (%)
Ancestries Reported - Scotch-Irish (%)
Ancestries Reported - Scottish (%)
Ancestries Reported - Slovak (%)
Ancestries Reported - Subsaharan African (%)
Ancestries Reported - Swedish (%)
Ancestries Reported - Swiss (%)
Ancestries Reported - Ukrainian (%)
Ancestries Reported - United States (%)
Ancestries Reported - Welsh (%)
Ancestries Reported - West Indian (%)
Ancestries Reported - Other (%)
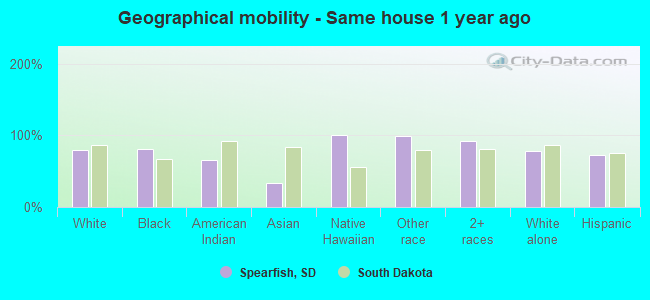
Geographical mobility - Same house 1 year ago (%)
Geographical mobility - Same house 1 year ago (%) - White
Geographical mobility - Same house 1 year ago (%) - Black or African American
Geographical mobility - Same house 1 year ago (%) - Asian
Geographical mobility - Same house 1 year ago (%) - Hispanic or Latino
Geographical mobility - Same house 1 year ago (%) - American Indian and Alaska Native
Geographical mobility - Same house 1 year ago (%) - Multirace
Geographical mobility - Same house 1 year ago (%) - Other Race
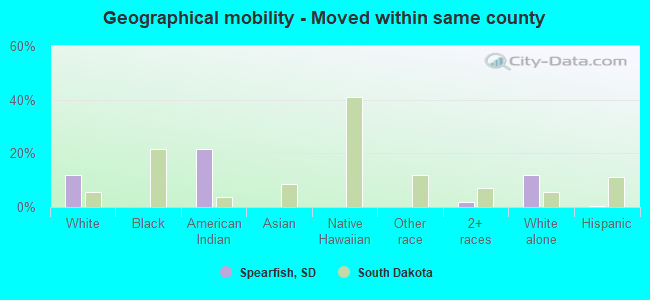
Geographical mobility - Moved within same county (%)
Geographical mobility - Moved within same county (%) - White
Geographical mobility - Moved within same county (%) - Black or African American
Geographical mobility - Moved within same county (%) - Asian
Geographical mobility - Moved within same county (%) - Hispanic or Latino
Geographical mobility - Moved within same county (%) - American Indian and Alaska Native
Geographical mobility - Moved within same county (%) - Multirace
Geographical mobility - Moved within same county (%) - Other Race
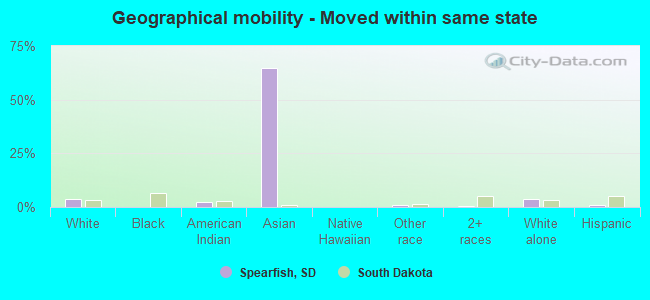
Geographical mobility - Moved from different county within same state (%)
Geographical mobility - Moved from different county within same state (%) - White
Geographical mobility - Moved from different county within same state (%) - Black or African American
Geographical mobility - Moved from different county within same state (%) - Asian
Geographical mobility - Moved from different county within same state (%) - Hispanic or Latino
Geographical mobility - Moved from different county within same state (%) - American Indian and Alaska Native
Geographical mobility - Moved from different county within same state (%) - Multirace
Geographical mobility - Moved from different county within same state (%) - Other Race
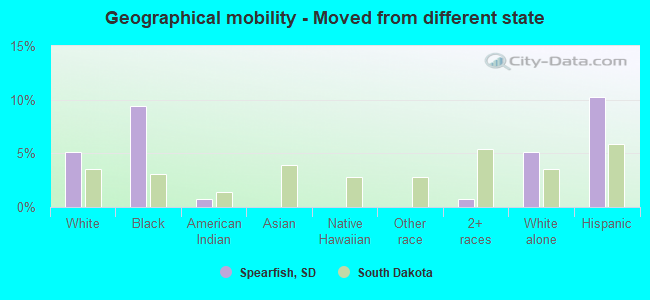
Geographical mobility - Moved from different state (%)
Geographical mobility - Moved from different state (%) - White
Geographical mobility - Moved from different state (%) - Black or African American
Geographical mobility - Moved from different state (%) - Asian
Geographical mobility - Moved from different state (%) - Hispanic or Latino
Geographical mobility - Moved from different state (%) - American Indian and Alaska Native
Geographical mobility - Moved from different state (%) - Multirace
Geographical mobility - Moved from different state (%) - Other Race
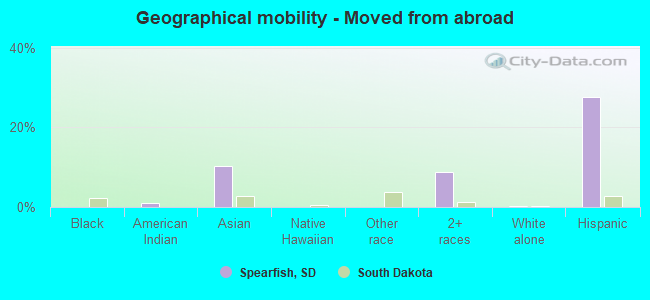
Geographical mobility - Moved from abroad (%)
Geographical mobility - Moved from abroad (%) - White
Geographical mobility - Moved from abroad (%) - Black or African American
Geographical mobility - Moved from abroad (%) - Asian
Geographical mobility - Moved from abroad (%) - Hispanic or Latino
Geographical mobility - Moved from abroad (%) - American Indian and Alaska Native
Geographical mobility - Moved from abroad (%) - Multirace
Geographical mobility - Moved from abroad (%) - Other Race
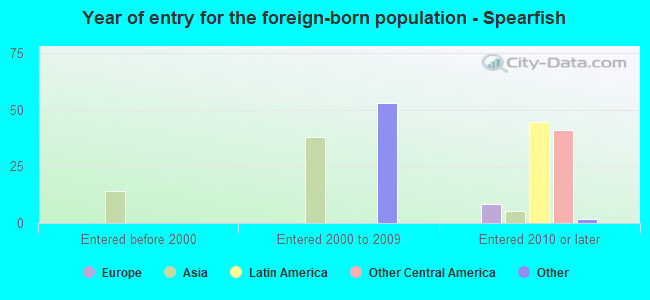
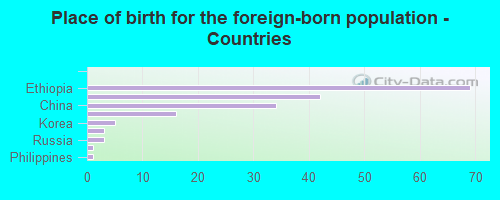
Place of birth for the foreign-born population - Ireland (%)
Place of birth for the foreign-born population - Denmark (%)
Place of birth for the foreign-born population - Norway (%)
Place of birth for the foreign-born population - Sweden (%)
Place of birth for the foreign-born population - United Kingdom (%)
Place of birth for the foreign-born population - England (%)
Place of birth for the foreign-born population - Scotland (%)
Place of birth for the foreign-born population - Other Northern Europe (%)
Place of birth for the foreign-born population - Austria (%)
Place of birth for the foreign-born population - Belgium (%)
Place of birth for the foreign-born population - France (%)
Place of birth for the foreign-born population - Germany (%)
Place of birth for the foreign-born population - Netherlands (%)
Place of birth for the foreign-born population - Switzerland (%)
Place of birth for the foreign-born population - Other Western Europe (%)
Place of birth for the foreign-born population - Greece (%)
Place of birth for the foreign-born population - Italy (%)
Place of birth for the foreign-born population - Portugal (%)
Place of birth for the foreign-born population - Spain (%)
Place of birth for the foreign-born population - Other Southern Europe (%)
Place of birth for the foreign-born population - Albania (%)
Place of birth for the foreign-born population - Belarus (%)
Place of birth for the foreign-born population - Bosnia and Herzegovina (%)
Place of birth for the foreign-born population - Bulgaria (%)
Place of birth for the foreign-born population - Croatia (%)
Place of birth for the foreign-born population - Czechoslovakia (%)
Place of birth for the foreign-born population - Hungary (%)
Place of birth for the foreign-born population - Latvia (%)
Place of birth for the foreign-born population - Lithuania (%)
Place of birth for the foreign-born population - North Macedonia (Macedonia) (%)
Place of birth for the foreign-born population - Moldova (%)
Place of birth for the foreign-born population - Poland (%)
Place of birth for the foreign-born population - Romania (%)
Place of birth for the foreign-born population - Russia (%)
Place of birth for the foreign-born population - Serbia (%)
Place of birth for the foreign-born population - Ukraine (%)
Place of birth for the foreign-born population - Other Eastern Europe (%)
Place of birth for the foreign-born population - China (%)
Place of birth for the foreign-born population - Hong Kong (%)
Place of birth for the foreign-born population - Taiwan (%)
Place of birth for the foreign-born population - Japan (%)
Place of birth for the foreign-born population - Korea (%)
Place of birth for the foreign-born population - Other Eastern Asia (%)
Place of birth for the foreign-born population - Afghanistan (%)
Place of birth for the foreign-born population - Bangladesh (%)
Place of birth for the foreign-born population - India (%)
Place of birth for the foreign-born population - Iran (%)
Place of birth for the foreign-born population - Kazakhstan (%)
Place of birth for the foreign-born population - Nepal (%)
Place of birth for the foreign-born population - Pakistan (%)
Place of birth for the foreign-born population - Sri Lanka (%)
Place of birth for the foreign-born population - Uzbekistan (%)
Place of birth for the foreign-born population - Other South Central Asia (%)
Place of birth for the foreign-born population - Burma (%)
Place of birth for the foreign-born population - Cambodia (%)
Place of birth for the foreign-born population - Indonesia (%)
Place of birth for the foreign-born population - Laos (%)
Place of birth for the foreign-born population - Malaysia (%)
Place of birth for the foreign-born population - Philippines (%)
Place of birth for the foreign-born population - Singapore (%)
Place of birth for the foreign-born population - Thailand (%)
Place of birth for the foreign-born population - Vietnam (%)
Place of birth for the foreign-born population - Other South Eastern Asia (%)
Place of birth for the foreign-born population - Armenia (%)
Place of birth for the foreign-born population - Iraq (%)
Place of birth for the foreign-born population - Israel (%)
Place of birth for the foreign-born population - Jordan (%)
Place of birth for the foreign-born population - Kuwait (%)
Place of birth for the foreign-born population - Lebanon (%)
Place of birth for the foreign-born population - Saudi Arabia (%)
Place of birth for the foreign-born population - Syria (%)
Place of birth for the foreign-born population - Turkey (%)
Place of birth for the foreign-born population - Yemen (%)
Place of birth for the foreign-born population - Other Western Asia (%)
Place of birth for the foreign-born population - Eritrea (%)
Place of birth for the foreign-born population - Ethiopia (%)
Place of birth for the foreign-born population - Kenya (%)
Place of birth for the foreign-born population - Somalia (%)
Place of birth for the foreign-born population - Uganda (%)
Place of birth for the foreign-born population - Zimbabwe (%)
Place of birth for the foreign-born population - Other Eastern Africa (%)
Place of birth for the foreign-born population - Cameroon (%)
Place of birth for the foreign-born population - Congo (%)
Place of birth for the foreign-born population - Democratic Republic of Congo (Zaire) (%)
Place of birth for the foreign-born population - Other Middle Africa (%)
Place of birth for the foreign-born population - Egypt (%)
Place of birth for the foreign-born population - Morocco (%)
Place of birth for the foreign-born population - Sudan (%)
Place of birth for the foreign-born population - Other Northern Africa (%)
Place of birth for the foreign-born population - South Africa (%)
Place of birth for the foreign-born population - Other Southern Africa (%)
Place of birth for the foreign-born population - Cabo Verde (%)
Place of birth for the foreign-born population - Ghana (%)
Place of birth for the foreign-born population - Liberia (%)
Place of birth for the foreign-born population - Nigeria (%)
Place of birth for the foreign-born population - Senegal (%)
Place of birth for the foreign-born population - Sierra Leone (%)
Place of birth for the foreign-born population - Other Western Africa (%)
Place of birth for the foreign-born population - Australia (%)
Place of birth for the foreign-born population - New Zealand (%)
Place of birth for the foreign-born population - Fiji (%)
Place of birth for the foreign-born population - Micronesia (%)
Place of birth for the foreign-born population - Bahamas (%)
Place of birth for the foreign-born population - Barbados (%)
Place of birth for the foreign-born population - Cuba (%)
Place of birth for the foreign-born population - Dominica (%)
Place of birth for the foreign-born population - Dominican Republic (%)
Place of birth for the foreign-born population - Grenada (%)
Place of birth for the foreign-born population - Haiti (%)
Place of birth for the foreign-born population - Jamaica (%)
Place of birth for the foreign-born population - St. Vincent and the Grenadines (%)
Place of birth for the foreign-born population - Trinidad and Tobago (%)
Place of birth for the foreign-born population - West Indies (%)
Place of birth for the foreign-born population - Other Caribbean (%)
Place of birth for the foreign-born population - Belize (%)
Place of birth for the foreign-born population - Costa Rica (%)
Place of birth for the foreign-born population - El Salvador (%)
Place of birth for the foreign-born population - Guatemala (%)
Place of birth for the foreign-born population - Honduras (%)
Place of birth for the foreign-born population - Mexico (%)
Place of birth for the foreign-born population - Nicaragua (%)
Place of birth for the foreign-born population - Panama (%)
Place of birth for the foreign-born population - Other Central America (%)
Place of birth for the foreign-born population - Argentina (%)
Place of birth for the foreign-born population - Bolivia (%)
Place of birth for the foreign-born population - Brazil (%)
Place of birth for the foreign-born population - Chile (%)
Place of birth for the foreign-born population - Colombia (%)
Place of birth for the foreign-born population - Ecuador (%)
Place of birth for the foreign-born population - Guyana (%)
Place of birth for the foreign-born population - Peru (%)
Place of birth for the foreign-born population - Uruguay (%)
Place of birth for the foreign-born population - Venezuela (%)
Place of birth for the foreign-born population - Other South America (%)
Place of birth for the foreign-born population - Canada (%)
Place of birth for the foreign-born population - Other Northern America (%)
Place of birth for the foreign-born population - Other (%)
Latest news about races in Spearfish, SD collected exclusively by city-data.com from local newspapers, TV, and radio stations
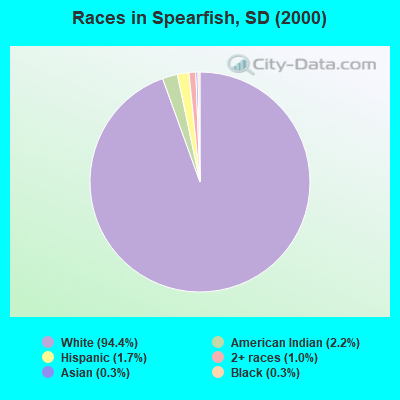
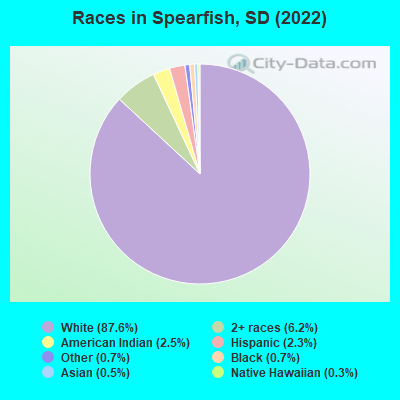
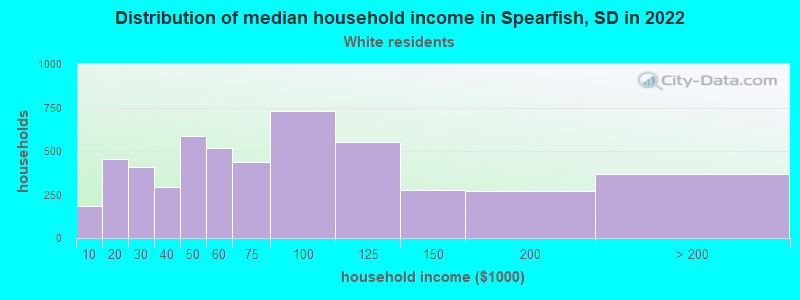
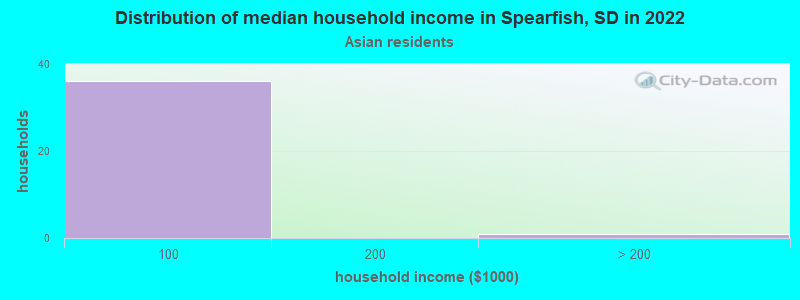
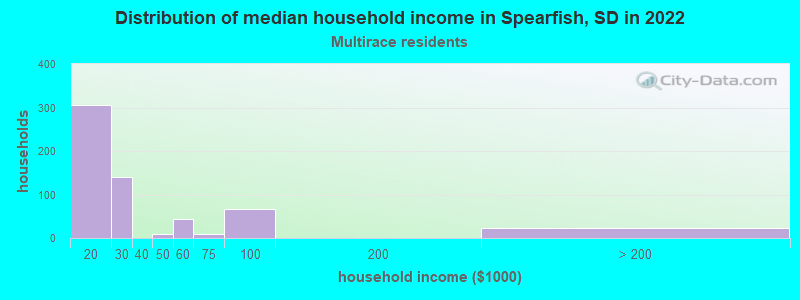
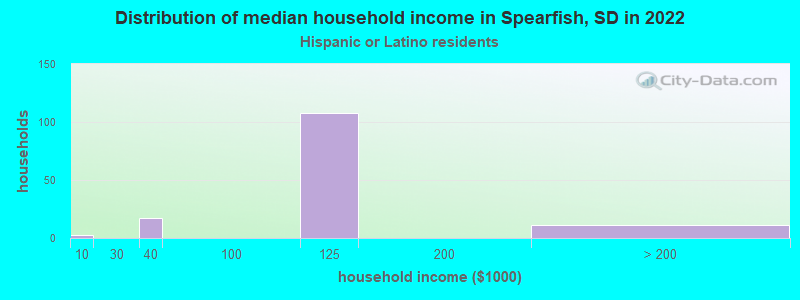
According to 2022 data, the most numerous races in Spearfish, SD are White alone (10,982 residents), American Indian alone (315 residents), and Hispanic (287 residents). 96.0% of Spearfish residents speak English at home. 1.4% of Spearfish, SD residents are foreign-born , which is 110.1% less than the foreign-born rate of 3.0% across the entire state of South Dakota.
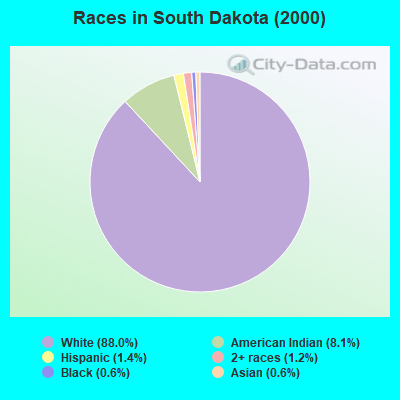
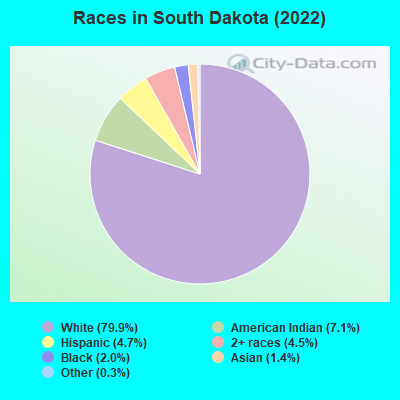
Race distribution in Spearfish
2000 2022
664,585 88.0% White alone 60,988 8.1% American Indian alone 10,903 1.4% Hispanic 8,960 1.2% Two or more races 4,563 0.6% Black alone 4,316 0.6% Asian alone 310 0.04% Other race alone 219 0.03% Native Hawaiian and Other
726,885 79.9% White alone 64,666 7.1% American Indian alone 42,430 4.7% Hispanic 40,984 4.5% Two or more races 18,053 2.0% Black alone 12,874 1.4% Asian alone 3,136 0.3% Other race alone 796 0.09% Native Hawaiian and Other
Income and house value in Spearfish Median household income in 2022 $61,803 White non-Hispanic householders$18,037 Two or more races householders$113,419 Hispanic or Latino race householdersMedian 2022 house value $332,440 White Non-Hispanic householders$337,773 American Indian or Alaska Native householders $302,218 Asian householders$268,796 Two or more races householders$231,108 Hispanic or Latino householders
Median age by race in Spearfish
41.7 Median age for White residents40.9 43.1 13.2 Median age for Black or African American residents23.0 10.0 24.6 Median age for American Indian / Alaska Native residents20.4 24.1 19.0 Median age for Asian residents-634,593,355.6 20.1 -1,333,333,332.0 Median age for Native Hawaiian / Pacific Islander residents-1,038,202,246.2 -670,599,802.7 14.1 Median age for Other race residents10.8 -1,031,928,479.2 32.5 Median age for Two or more races residents31.7 33.8 41.6 Median age for White alone residents41.0 42.8 25.5 Median age for Hispanic or Latino residents20.7 33.0
Owner/renter occupied households by race in Spearfish
House owners and renters - White residents 2,898 57.6% Owner occupied2,131 42.4% Renter occupiedHouse owners and renters - American Indian / Alaska Native residents 1 1.0% Owner occupied100 99.0% Renter occupiedHouse owners and renters - Asian residents 1 2.4% Owner occupied39 97.6% Renter occupiedHouse owners and renters - Native Hawaiian / Pacific Islander residents 31 100.0% Owner occupiedHouse owners and renters - Other race residents 31 100.0% Owner occupiedHouse owners and renters - Two or more races residents 85 14.4% Owner occupied507 85.6% Renter occupiedHouse owners and renters - White alone residents 2,868 57.3% Owner occupied2,137 42.7% Renter occupiedHouse owners and renters - Hispanic or Latino residents 68 63.3% Owner occupied40 36.7% Renter occupied
Language usage in Spearfish
English speakers - Total 96.0% of residents of Spearfish speak English at home.
1.6% of residents speak Spanish at home 124 64.6% Speak English very well68 35.4% Speak English less than very well2.0% of residents speak other language at home 230 96.6% Speak English very well8 3.4% Speak English less than very well
English speakers - Born in the United States 96.0% of residents of Spearfish speak English at home.
1.4% of residents speak Spanish at home 56 74.7% Speak English very well19 25.3% Speak English less than very well2.5% of residents speak other language at home 132 100.0% Speak English very well
English speakers - Native, born elsewhere 0.0% of residents of Spearfish speak English at home.
89.1% of residents speak Spanish at home 41 100.0% Speak English very well
English speakers - Foreign-born 53.0% of residents of Spearfish speak English at home.
31.7% of residents speak Spanish at home 14 26.9% Speak English very well38 73.1% Speak English less than very well14.0% of residents speak other language at home 15 65.2% Speak English very well8 34.8% Speak English less than very well
White (Caucasian) - Speak only English Native:
98.1% (10,272)Foreign-born:
37.2% (2)
White (Caucasian) - Speak another language Native:
1.8% (188)Foreign-born:
62.2% (4)
Black or African American - Speak only English Native:
100.0% (41)Foreign-born:
100.0% (39)
Asian - Speak only English Native:
91.5% (2)Foreign-born:
30.0% (16)
Two or more races - Speak another language Native:
21.5% (196)Foreign-born:
100.0% (47)
White alone - Speak only English Native:
98.1% (10,234)Foreign-born:
31.5% (3)
White alone - Speak another language Native:
1.8% (185)Foreign-born:
69.2% (6)
Hispanic or Latino - Speak another language Native:
40.9% (95)Foreign-born:
100.0% (50)
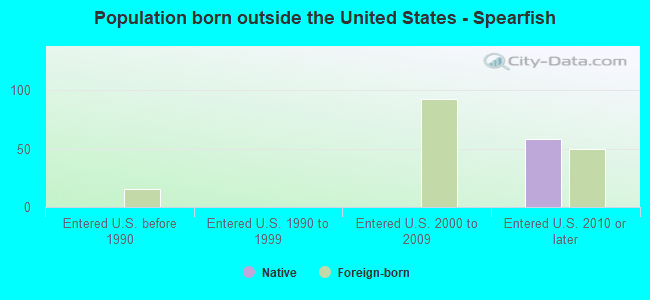
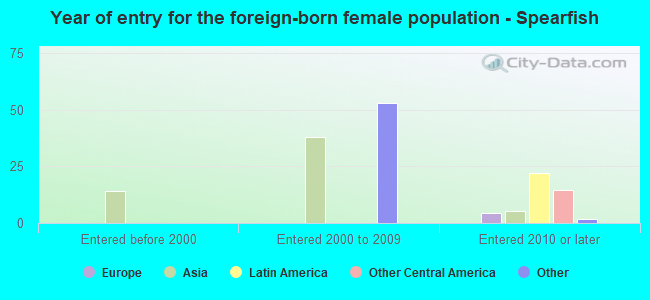
Foreign-born residents in Spearfish 179 residents are foreign born
This city:
1.4%South Dakota:
3.8%
Marital status for residents in Spearfish Marital status - White (Caucasian) population 15 years and over
Males 33.6% Never married49.7% Now married2.1% Separated2.2% Widowed12.4% DivorcedFemales 32.2% Never married44.3% Now married0.7% Separated9.9% Widowed12.8% DivorcedWomen who gave birth in the past 12 months Now married:
47.8% (11)Unmarried:
52.2% (12)
Women who did not give birth in the past 12 months Now married:
33.4% (819)Unmarried:
66.6% (1,634)
Marital status - Black or African American population 15 years and over
Males 100.0% Never married0.0% Now married0.0% Separated0.0% Widowed0.0% DivorcedFemales 100.0% Never married0.0% Now married0.0% Separated0.0% Widowed0.0% DivorcedWomen who did not give birth in the past 12 months Now married:
0.0% (0)Unmarried:
100.0% (15)
Marital status - American Indian / Alaska Native population 15 years and over
Males 93.5% Never married0.0% Now married0.0% Separated0.0% Widowed6.5% DivorcedFemales 96.4% Never married0.0% Now married0.0% Separated0.0% Widowed3.6% DivorcedWomen who did not give birth in the past 12 months Now married:
0.0% (0)Unmarried:
100.0% (165)
Marital status - Other race population 15 years and over
Males 11.5% Never married88.5% Now married0.0% Separated0.0% Widowed0.0% DivorcedFemales 0.0% Never married100.0% Now married0.0% Separated0.0% Widowed0.0% DivorcedWomen who did not give birth in the past 12 months Now married:
100.0% (23)Unmarried:
0.0% (0)
Marital status - Two or more races population 15 years and over
Males 74.5% Never married0.0% Now married0.0% Separated25.5% Widowed0.0% DivorcedFemales 56.2% Never married9.9% Now married0.0% Separated12.3% Widowed21.6% DivorcedWomen who gave birth in the past 12 months Now married:
100.0% (33)Unmarried:
0.0% (0)
Women who did not give birth in the past 12 months Now married:
3.6% (16)Unmarried:
96.4% (435)
Marital status - White alone, not Hispanic / Latino population 15 years and over
Males 33.3% Never married49.8% Now married2.1% Separated2.3% Widowed12.6% DivorcedFemales 32.0% Never married44.4% Now married0.7% Separated10.0% Widowed12.9% DivorcedWomen who gave birth in the past 12 months Now married:
47.8% (11)Unmarried:
52.2% (12)
Women who did not give birth in the past 12 months Now married:
33.7% (825)Unmarried:
66.3% (1,626)
Marital status - Hispanic or Latino population 15 years and over
Males 79.3% Never married20.7% Now married0.0% Separated0.0% Widowed0.0% DivorcedFemales 50.0% Never married37.9% Now married0.0% Separated12.1% Widowed0.0% DivorcedWomen who did not give birth in the past 12 months Now married:
35.6% (33)Unmarried:
64.4% (61)
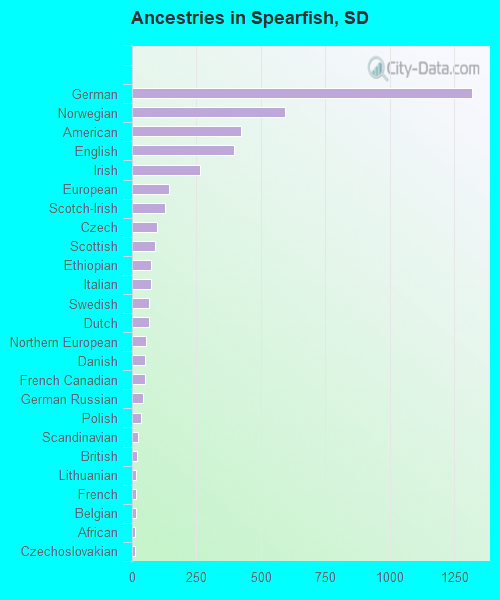
Ancestries in Spearfish
1,319 27.9% German593 12.6% Norwegian424 9.0% American395 8.4% English262 5.6% Irish143 3.0% European129 2.7% Scotch-Irish98 2.1% Czech89 1.9% Scottish74 1.6% Ethiopian72 1.5% Italian66 1.4% Swedish65 1.4% Dutch56 1.2% Northern European51 1.1% Danish51 1.1% French Canadian41 0.9% German Russian35 0.7% Polish25 0.5% Scandinavian20 0.4% British17 0.4% Lithuanian15 0.3% French14 0.3% Belgian13 0.3% African12 0.3% Czechoslovakian11 0.2% Finnish9 0.2% Greek
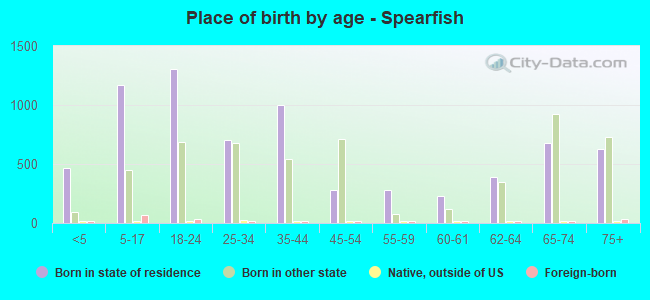
Children Nativity (place of birth) in Spearfish
Children under 6 years - Living with two parents Both parents native 436 100.0% NativeChildren under 6 years - Living with one parent Native parent 133 100.0% NativeChildren 6 to 17 years - Living with two parents Both parents native 939 92.9% Native71 7.1% Foreign-bornOne native, one foreign-born parent 15 100.0% Foreign-bornChildren 6 to 17 years - Living with one parent Native parent 519 100.0% Native
Grandparents responsible for own grandchildren in Spearfish
Grandparents (30 to 59 years) White / Caucasian 21 100.0% Responsible for grandchildrenWhite alone, not Hispanic / Latino 21 100.0% Responsible for grandchildren
Grandparents (60 years and over) White / Caucasian 74 100.0% Not responsible for grandchildrenWhite alone, not Hispanic / Latino 75 100.0% Not responsible for grandchildren