Races in Spring Hill, Florida (FL) Detailed Stats
Data:
Races - White alone (%)
Races - White alone (% change since 2000)
Races - Black alone (%)
Races - Black alone (% change since 2000)
Races - American Indian alone (%)
Races - American Indian alone (% change since 2000)
Races - Asian alone (%)
Races - Asian alone (% change since 2000)
Races - Hispanic (%)
Races - Hispanic (% change since 2000)
Races - Native Hawaiian and Other Pacific Islander alone (%)
Races - Native Hawaiian and Other Pacific Islander alone (% change since 2000)
Races - Two or more races(%)
Races - Two or more races(% change since 2000)
Races - Other race alone (%)
Races - Other race alone (% change since 2000)
Racial diversity
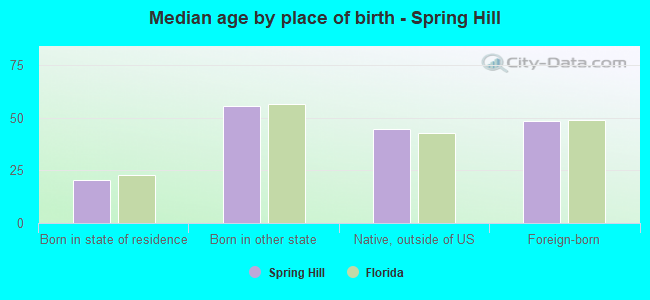
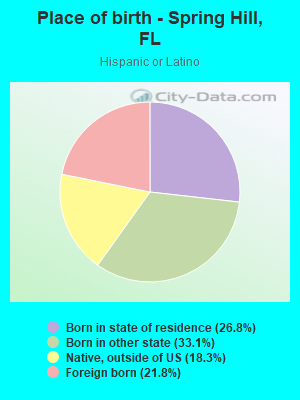
Place of birth - Born in state of residence (%)
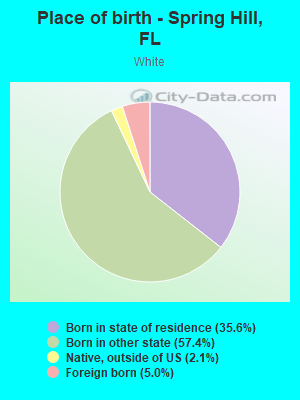
Place of birth - Born in state of residence (%) - White
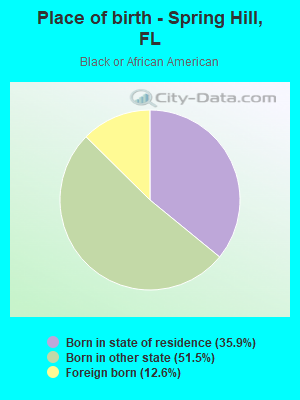
Place of birth - Born in state of residence (%) - Black or African American
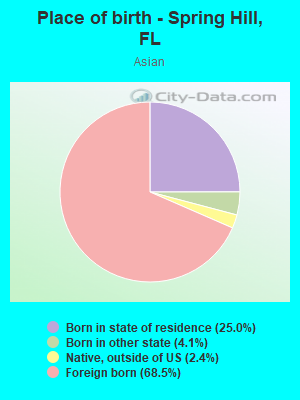
Place of birth - Born in state of residence (%) - Asian
Place of birth - Born in state of residence (%) - Hispanic or Latino
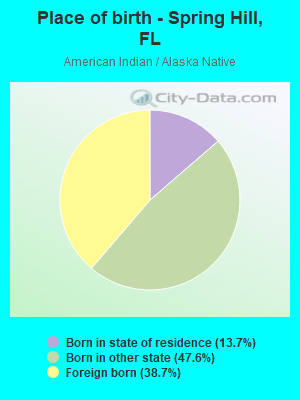
Place of birth - Born in state of residence (%) - American Indian and Alaska Native
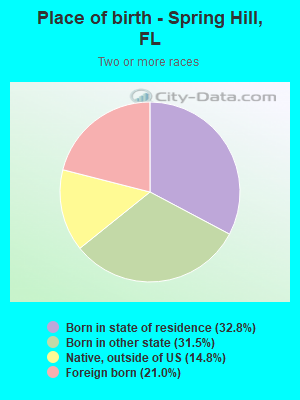
Place of birth - Born in state of residence (%) - Multirace
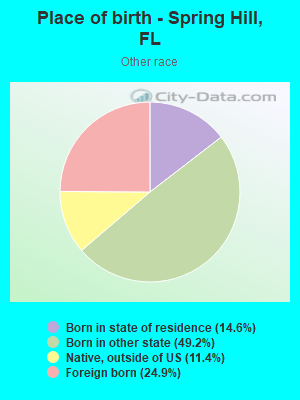
Place of birth - Born in state of residence (%) - Other Race
Place of birth - Born in other state (%)
Place of birth - Born in other state (%) - White
Place of birth - Born in other state (%) - Black or African American
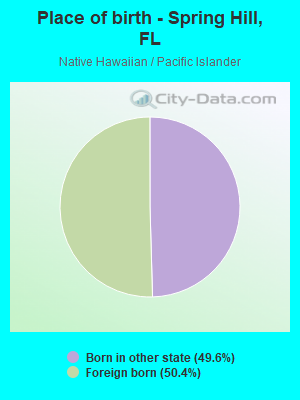
Place of birth - Born in other state (%) - Asian
Place of birth - Born in other state (%) - Hispanic or Latino
Place of birth - Born in other state (%) - American Indian and Alaska Native
Place of birth - Born in other state (%) - Multirace
Place of birth - Born in other state (%) - Other Race
Place of birth - Native, outside of US (%)
Place of birth - Native, outside of US (%) - White
Place of birth - Native, outside of US (%) - Black or African American
Place of birth - Native, outside of US (%) - Asian
Place of birth - Native, outside of US (%) - Hispanic or Latino
Place of birth - Native, outside of US (%) - American Indian and Alaska Native
Place of birth - Native, outside of US (%) - Multirace
Place of birth - Native, outside of US (%) - Other Race
Place of birth - Foreign born (%)
Place of birth - Foreign born (%) - White
Place of birth - Foreign born (%) - Black or African American
Place of birth - Foreign born (%) - Asian
Place of birth - Foreign born (%) - Hispanic or Latino
Place of birth - Foreign born (%) - American Indian and Alaska Native
Place of birth - Foreign born (%) - Multirace
Place of birth - Foreign born (%) - Other Race
Residents speaking English at home (%)
Residents speaking English at home - Born in the United States (%)
Residents speaking English at home - Native, born elsewhere (%)
Residents speaking English at home - Foreign born (%)
Residents speaking Spanish at home (%)
Residents speaking Spanish at home - Born in the United States (%)
Residents speaking Spanish at home - Native, born elsewhere (%)
Residents speaking Spanish at home - Foreign born (%)
Residents speaking other language at home (%)
Residents speaking other language at home - Born in the United States (%)
Residents speaking other language at home - Native, born elsewhere (%)
Residents speaking other language at home - Foreign born (%)
Marital status - Never married (%)
Marital status - Now married (%)
Marital status - Separated (%)
Marital status - Widowed (%)
Marital status - Divorced (%)
Ancestries Reported - Arab (%)
Ancestries Reported - Czech (%)
Ancestries Reported - Danish (%)
Ancestries Reported - Dutch (%)
Ancestries Reported - English (%)
Ancestries Reported - French (%)
Ancestries Reported - French Canadian (%)
Ancestries Reported - German (%)
Ancestries Reported - Greek (%)
Ancestries Reported - Hungarian (%)
Ancestries Reported - Irish (%)
Ancestries Reported - Italian (%)
Ancestries Reported - Lithuanian (%)
Ancestries Reported - Norwegian (%)
Ancestries Reported - Polish (%)
Ancestries Reported - Portuguese (%)
Ancestries Reported - Russian (%)
Ancestries Reported - Scotch-Irish (%)
Ancestries Reported - Scottish (%)
Ancestries Reported - Slovak (%)
Ancestries Reported - Subsaharan African (%)
Ancestries Reported - Swedish (%)
Ancestries Reported - Swiss (%)
Ancestries Reported - Ukrainian (%)
Ancestries Reported - United States (%)
Ancestries Reported - Welsh (%)
Ancestries Reported - West Indian (%)
Ancestries Reported - Other (%)
Geographical mobility - Same house 1 year ago (%)
Geographical mobility - Same house 1 year ago (%) - White
Geographical mobility - Same house 1 year ago (%) - Black or African American
Geographical mobility - Same house 1 year ago (%) - Asian
Geographical mobility - Same house 1 year ago (%) - Hispanic or Latino
Geographical mobility - Same house 1 year ago (%) - American Indian and Alaska Native
Geographical mobility - Same house 1 year ago (%) - Multirace
Geographical mobility - Same house 1 year ago (%) - Other Race
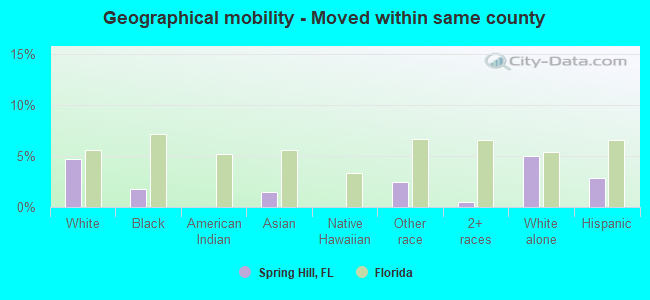
Geographical mobility - Moved within same county (%)
Geographical mobility - Moved within same county (%) - White
Geographical mobility - Moved within same county (%) - Black or African American
Geographical mobility - Moved within same county (%) - Asian
Geographical mobility - Moved within same county (%) - Hispanic or Latino
Geographical mobility - Moved within same county (%) - American Indian and Alaska Native
Geographical mobility - Moved within same county (%) - Multirace
Geographical mobility - Moved within same county (%) - Other Race
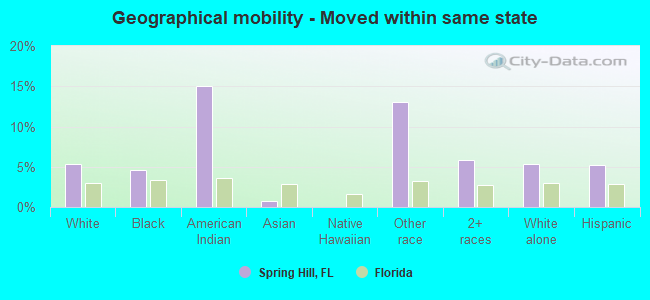
Geographical mobility - Moved from different county within same state (%)
Geographical mobility - Moved from different county within same state (%) - White
Geographical mobility - Moved from different county within same state (%) - Black or African American
Geographical mobility - Moved from different county within same state (%) - Asian
Geographical mobility - Moved from different county within same state (%) - Hispanic or Latino
Geographical mobility - Moved from different county within same state (%) - American Indian and Alaska Native
Geographical mobility - Moved from different county within same state (%) - Multirace
Geographical mobility - Moved from different county within same state (%) - Other Race
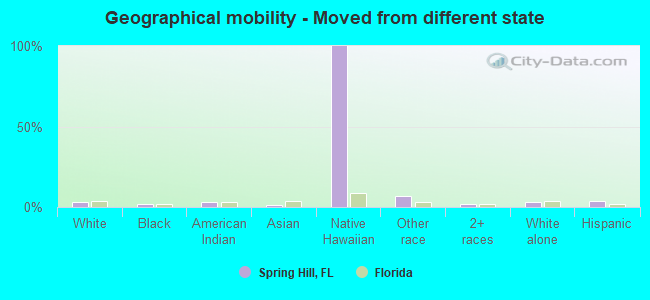
Geographical mobility - Moved from different state (%)
Geographical mobility - Moved from different state (%) - White
Geographical mobility - Moved from different state (%) - Black or African American
Geographical mobility - Moved from different state (%) - Asian
Geographical mobility - Moved from different state (%) - Hispanic or Latino
Geographical mobility - Moved from different state (%) - American Indian and Alaska Native
Geographical mobility - Moved from different state (%) - Multirace
Geographical mobility - Moved from different state (%) - Other Race
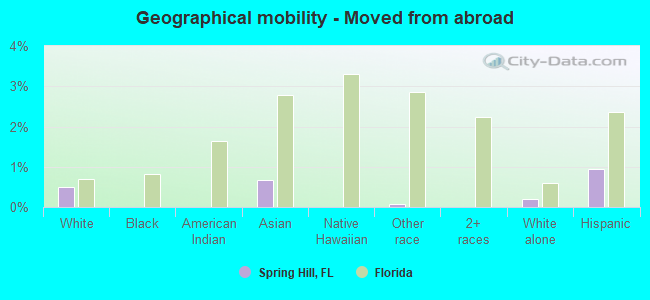
Geographical mobility - Moved from abroad (%)
Geographical mobility - Moved from abroad (%) - White
Geographical mobility - Moved from abroad (%) - Black or African American
Geographical mobility - Moved from abroad (%) - Asian
Geographical mobility - Moved from abroad (%) - Hispanic or Latino
Geographical mobility - Moved from abroad (%) - American Indian and Alaska Native
Geographical mobility - Moved from abroad (%) - Multirace
Geographical mobility - Moved from abroad (%) - Other Race
Place of birth for the foreign-born population - Ireland (%)
Place of birth for the foreign-born population - Denmark (%)
Place of birth for the foreign-born population - Norway (%)
Place of birth for the foreign-born population - Sweden (%)
Place of birth for the foreign-born population - United Kingdom (%)
Place of birth for the foreign-born population - England (%)
Place of birth for the foreign-born population - Scotland (%)
Place of birth for the foreign-born population - Other Northern Europe (%)
Place of birth for the foreign-born population - Austria (%)
Place of birth for the foreign-born population - Belgium (%)
Place of birth for the foreign-born population - France (%)
Place of birth for the foreign-born population - Germany (%)
Place of birth for the foreign-born population - Netherlands (%)
Place of birth for the foreign-born population - Switzerland (%)
Place of birth for the foreign-born population - Other Western Europe (%)
Place of birth for the foreign-born population - Greece (%)
Place of birth for the foreign-born population - Italy (%)
Place of birth for the foreign-born population - Portugal (%)
Place of birth for the foreign-born population - Spain (%)
Place of birth for the foreign-born population - Other Southern Europe (%)
Place of birth for the foreign-born population - Albania (%)
Place of birth for the foreign-born population - Belarus (%)
Place of birth for the foreign-born population - Bosnia and Herzegovina (%)
Place of birth for the foreign-born population - Bulgaria (%)
Place of birth for the foreign-born population - Croatia (%)
Place of birth for the foreign-born population - Czechoslovakia (%)
Place of birth for the foreign-born population - Hungary (%)
Place of birth for the foreign-born population - Latvia (%)
Place of birth for the foreign-born population - Lithuania (%)
Place of birth for the foreign-born population - North Macedonia (Macedonia) (%)
Place of birth for the foreign-born population - Moldova (%)
Place of birth for the foreign-born population - Poland (%)
Place of birth for the foreign-born population - Romania (%)
Place of birth for the foreign-born population - Russia (%)
Place of birth for the foreign-born population - Serbia (%)
Place of birth for the foreign-born population - Ukraine (%)
Place of birth for the foreign-born population - Other Eastern Europe (%)
Place of birth for the foreign-born population - China (%)
Place of birth for the foreign-born population - Hong Kong (%)
Place of birth for the foreign-born population - Taiwan (%)
Place of birth for the foreign-born population - Japan (%)
Place of birth for the foreign-born population - Korea (%)
Place of birth for the foreign-born population - Other Eastern Asia (%)
Place of birth for the foreign-born population - Afghanistan (%)
Place of birth for the foreign-born population - Bangladesh (%)
Place of birth for the foreign-born population - India (%)
Place of birth for the foreign-born population - Iran (%)
Place of birth for the foreign-born population - Kazakhstan (%)
Place of birth for the foreign-born population - Nepal (%)
Place of birth for the foreign-born population - Pakistan (%)
Place of birth for the foreign-born population - Sri Lanka (%)
Place of birth for the foreign-born population - Uzbekistan (%)
Place of birth for the foreign-born population - Other South Central Asia (%)
Place of birth for the foreign-born population - Burma (%)
Place of birth for the foreign-born population - Cambodia (%)
Place of birth for the foreign-born population - Indonesia (%)
Place of birth for the foreign-born population - Laos (%)
Place of birth for the foreign-born population - Malaysia (%)
Place of birth for the foreign-born population - Philippines (%)
Place of birth for the foreign-born population - Singapore (%)
Place of birth for the foreign-born population - Thailand (%)
Place of birth for the foreign-born population - Vietnam (%)
Place of birth for the foreign-born population - Other South Eastern Asia (%)
Place of birth for the foreign-born population - Armenia (%)
Place of birth for the foreign-born population - Iraq (%)
Place of birth for the foreign-born population - Israel (%)
Place of birth for the foreign-born population - Jordan (%)
Place of birth for the foreign-born population - Kuwait (%)
Place of birth for the foreign-born population - Lebanon (%)
Place of birth for the foreign-born population - Saudi Arabia (%)
Place of birth for the foreign-born population - Syria (%)
Place of birth for the foreign-born population - Turkey (%)
Place of birth for the foreign-born population - Yemen (%)
Place of birth for the foreign-born population - Other Western Asia (%)
Place of birth for the foreign-born population - Eritrea (%)
Place of birth for the foreign-born population - Ethiopia (%)
Place of birth for the foreign-born population - Kenya (%)
Place of birth for the foreign-born population - Somalia (%)
Place of birth for the foreign-born population - Uganda (%)
Place of birth for the foreign-born population - Zimbabwe (%)
Place of birth for the foreign-born population - Other Eastern Africa (%)
Place of birth for the foreign-born population - Cameroon (%)
Place of birth for the foreign-born population - Congo (%)
Place of birth for the foreign-born population - Democratic Republic of Congo (Zaire) (%)
Place of birth for the foreign-born population - Other Middle Africa (%)
Place of birth for the foreign-born population - Egypt (%)
Place of birth for the foreign-born population - Morocco (%)
Place of birth for the foreign-born population - Sudan (%)
Place of birth for the foreign-born population - Other Northern Africa (%)
Place of birth for the foreign-born population - South Africa (%)
Place of birth for the foreign-born population - Other Southern Africa (%)
Place of birth for the foreign-born population - Cabo Verde (%)
Place of birth for the foreign-born population - Ghana (%)
Place of birth for the foreign-born population - Liberia (%)
Place of birth for the foreign-born population - Nigeria (%)
Place of birth for the foreign-born population - Senegal (%)
Place of birth for the foreign-born population - Sierra Leone (%)
Place of birth for the foreign-born population - Other Western Africa (%)
Place of birth for the foreign-born population - Australia (%)
Place of birth for the foreign-born population - New Zealand (%)
Place of birth for the foreign-born population - Fiji (%)
Place of birth for the foreign-born population - Micronesia (%)
Place of birth for the foreign-born population - Bahamas (%)
Place of birth for the foreign-born population - Barbados (%)
Place of birth for the foreign-born population - Cuba (%)
Place of birth for the foreign-born population - Dominica (%)
Place of birth for the foreign-born population - Dominican Republic (%)
Place of birth for the foreign-born population - Grenada (%)
Place of birth for the foreign-born population - Haiti (%)
Place of birth for the foreign-born population - Jamaica (%)
Place of birth for the foreign-born population - St. Vincent and the Grenadines (%)
Place of birth for the foreign-born population - Trinidad and Tobago (%)
Place of birth for the foreign-born population - West Indies (%)
Place of birth for the foreign-born population - Other Caribbean (%)
Place of birth for the foreign-born population - Belize (%)
Place of birth for the foreign-born population - Costa Rica (%)
Place of birth for the foreign-born population - El Salvador (%)
Place of birth for the foreign-born population - Guatemala (%)
Place of birth for the foreign-born population - Honduras (%)
Place of birth for the foreign-born population - Mexico (%)
Place of birth for the foreign-born population - Nicaragua (%)
Place of birth for the foreign-born population - Panama (%)
Place of birth for the foreign-born population - Other Central America (%)
Place of birth for the foreign-born population - Argentina (%)
Place of birth for the foreign-born population - Bolivia (%)
Place of birth for the foreign-born population - Brazil (%)
Place of birth for the foreign-born population - Chile (%)
Place of birth for the foreign-born population - Colombia (%)
Place of birth for the foreign-born population - Ecuador (%)
Place of birth for the foreign-born population - Guyana (%)
Place of birth for the foreign-born population - Peru (%)
Place of birth for the foreign-born population - Uruguay (%)
Place of birth for the foreign-born population - Venezuela (%)
Place of birth for the foreign-born population - Other South America (%)
Place of birth for the foreign-born population - Canada (%)
Place of birth for the foreign-born population - Other Northern America (%)
Place of birth for the foreign-born population - Other (%)
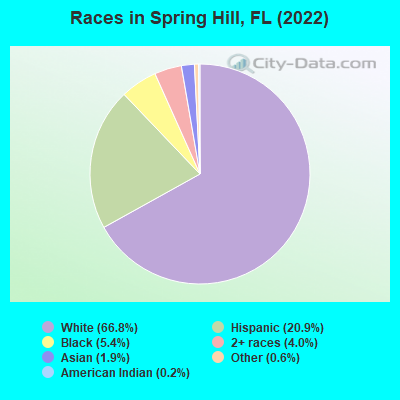
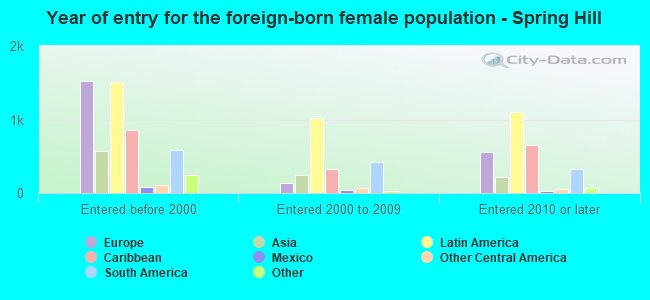
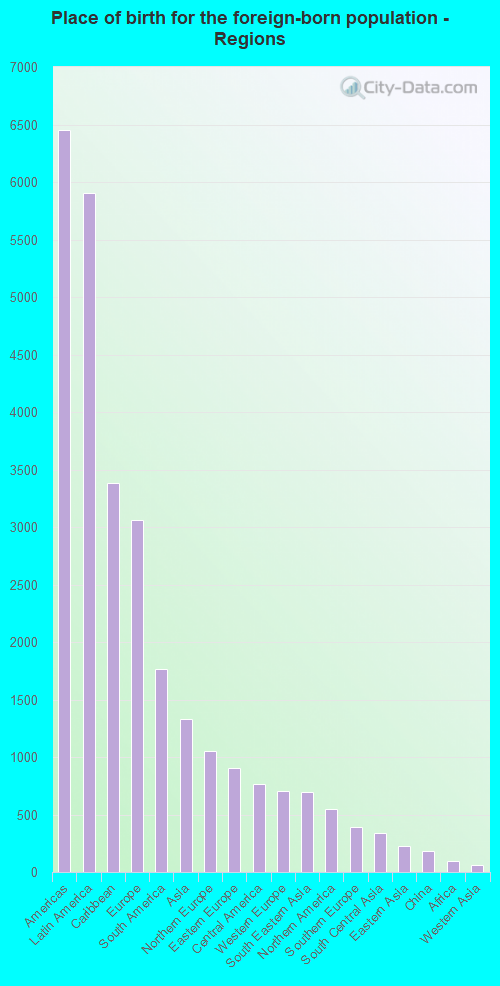
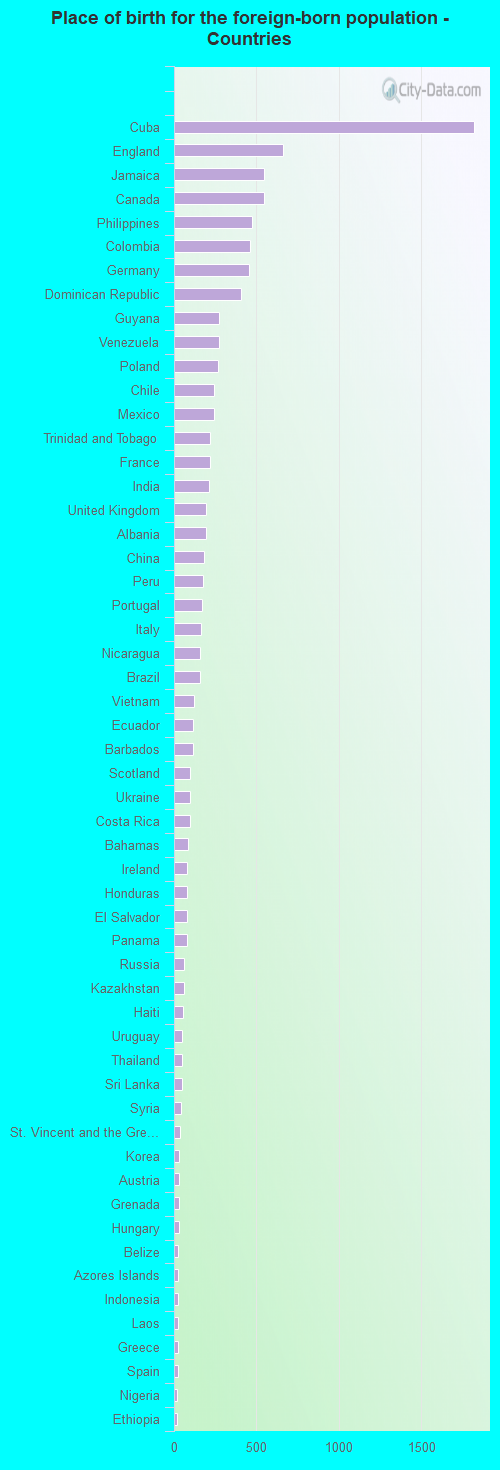
According to 2022 data, the most numerous races in Spring Hill, FL are White alone (83,958 residents), Hispanic (26,270 residents), and Black alone (6,803 residents). 83.2% of Spring Hill residents speak English at home. 8.9% of Spring Hill, FL residents are foreign-born (4.8% born in Latin America, 2.5% born in Europe, 1.1% born in Asia), which is 135.9% less than the foreign-born rate of 21.0% across the entire state of Florida.
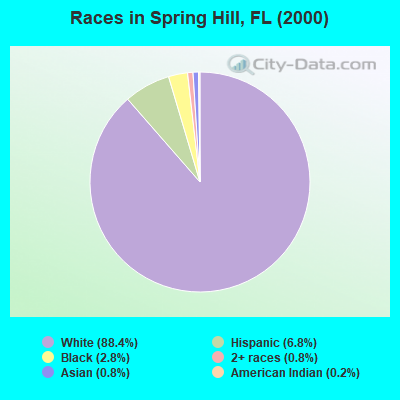
Race distribution in Spring Hill
2000 2022
10,458,509 65.4% White alone 2,682,715 16.8% Hispanic 2,264,268 14.2% Black alone 261,693 1.6% Asian alone 236,954 1.5% Two or more races 42,358 0.3% American Indian alone 28,994 0.2% Other race alone 6,887 0.04% Native Hawaiian and Other
11,309,403 50.8% White alone 6,025,039 27.1% Hispanic 3,241,015 14.6% Black alone 861,630 3.9% Two or more races 623,692 2.8% Asian alone 152,054 0.7% Other race alone 22,504 0.1% American Indian alone 9,486 0.04% Native Hawaiian and Other
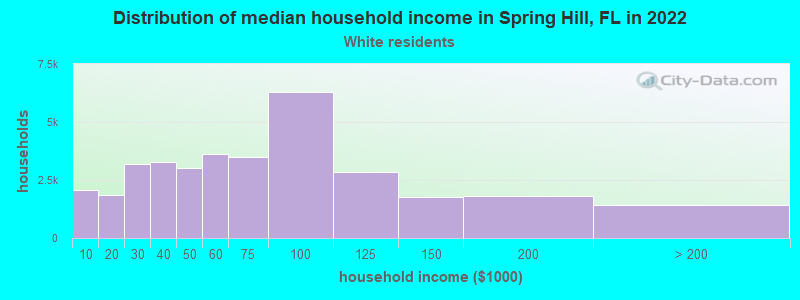
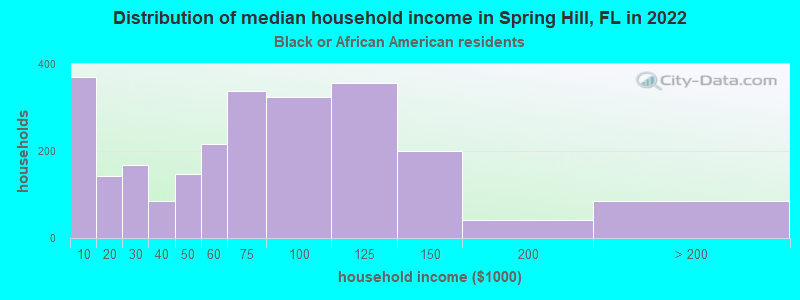
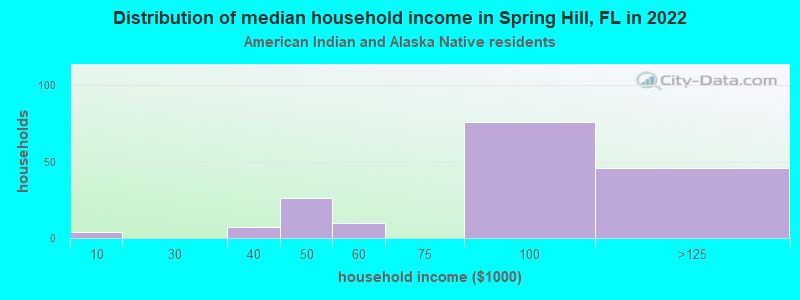
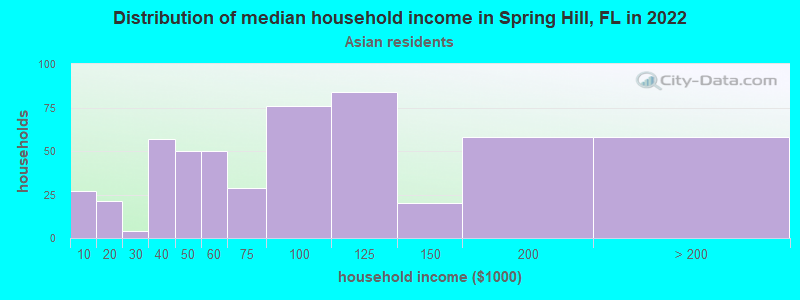
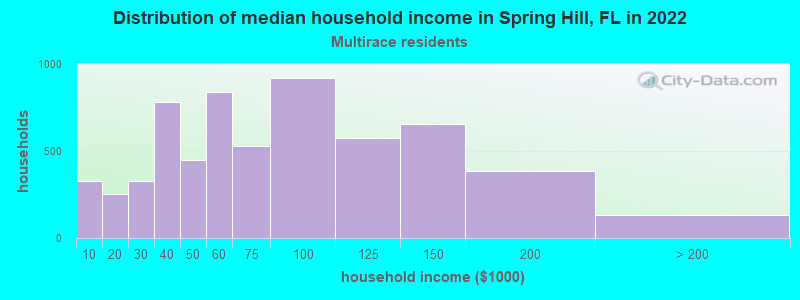
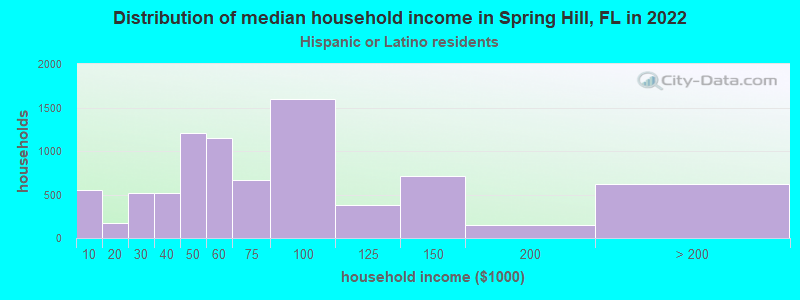
Income and house value in Spring Hill Median household income in 2022 $61,179 White non-Hispanic householders$91,043 Black householders$85,908 American Indian and Alaska Native householders$80,428 Asian householders$70,466 Some other race householders$63,586 Two or more races householders$62,510 Hispanic or Latino race householdersMedian 2022 house value $284,803 White Non-Hispanic householders$328,903 Black or African American householders$311,398 American Indian or Alaska Native householders $323,180 Asian householders$270,327 Some other race householders$263,931 Two or more races householders$269,990 Hispanic or Latino householders
Median age by race in Spring Hill
48.0 Median age for White residents45.6 49.3 35.2 Median age for Black or African American residents37.8 33.2 57.4 Median age for American Indian / Alaska Native residents63.2 50.6 40.9 Median age for Asian residents38.5 42.6 -666,666,666.0 Median age for Native Hawaiian / Pacific Islander residents-666,666,666.0 -666,666,666.0 30.7 Median age for Other race residents28.7 36.1 36.8 Median age for Two or more races residents40.1 33.4 48.7 Median age for White alone residents47.2 49.9 36.1 Median age for Hispanic or Latino residents35.7 36.3
Owner/renter occupied households by race in Spring Hill
House owners and renters - White residents 28,528 82.4% Owner occupied6,093 17.6% Renter occupiedHouse owners and renters - Black or African American residents 1,100 45.6% Owner occupied1,313 54.4% Renter occupiedHouse owners and renters - American Indian / Alaska Native residents 118 75.9% Owner occupied38 24.1% Renter occupiedHouse owners and renters - Asian residents 633 86.1% Owner occupied102 13.9% Renter occupiedHouse owners and renters - Native Hawaiian / Pacific Islander residents 27 100.0% Owner occupiedHouse owners and renters - Other race residents 1,423 72.2% Owner occupied549 27.8% Renter occupiedHouse owners and renters - Two or more races residents 4,694 81.3% Owner occupied1,079 18.7% Renter occupiedHouse owners and renters - White alone residents 27,149 83.7% Owner occupied5,282 16.3% Renter occupiedHouse owners and renters - Hispanic or Latino residents 6,349 77.0% Owner occupied1,894 23.0% Renter occupied
Language usage in Spring Hill
English speakers - Total 83.2% of residents of Spring Hill speak English at home.
12.5% of residents speak Spanish at home 10,035 66.9% Speak English very well4,969 33.1% Speak English less than very well4.3% of residents speak other language at home 3,267 63.6% Speak English very well1,870 36.4% Speak English less than very well
English speakers - Born in the United States 92.8% of residents of Spring Hill speak English at home.
5.3% of residents speak Spanish at home 3,232 94.8% Speak English very well178 5.2% Speak English less than very well2.0% of residents speak other language at home 1,158 91.4% Speak English very well109 8.6% Speak English less than very well
English speakers - Native, born elsewhere 22.6% of residents of Spring Hill speak English at home.
73.3% of residents speak Spanish at home 1,816 46.3% Speak English very well2,108 53.7% Speak English less than very well4.1% of residents speak other language at home 121 55.3% Speak English very well98 44.7% Speak English less than very well
English speakers - Foreign-born 29.1% of residents of Spring Hill speak English at home.
44.8% of residents speak Spanish at home 3,186 56.6% Speak English very well2,445 43.4% Speak English less than very well26.1% of residents speak other language at home 1,691 51.6% Speak English very well1,587 48.4% Speak English less than very well
White (Caucasian) - Speak only English Native:
95.5% (78,428)Foreign-born:
54.5% (2,357)
White (Caucasian) - Speak another language Native:
4.5% (3,731)Foreign-born:
45.5% (1,967)
Black or African American - Speak only English Native:
93.3% (4,638)Foreign-born:
88.8% (1,050)
Black or African American - Speak another language Native:
6.7% (333)Foreign-born:
8.6% (102)
American Indian / Alaska Native - Speak another language Native:
36.4% (116)Foreign-born:
100.0% (194)
Asian - Speak only English Native:
45.8% (258)Foreign-born:
18.3% (306)
Asian - Speak another language Native:
54.2% (305)Foreign-born:
81.7% (1,365)
Native Hawaiian / Pacific Islander - Speak only English Native:
87.6% (21)Foreign-born:
100.0% (29)
Other race - Speak only English Native:
56.3% (2,954)Foreign-born:
2.8% (53)
Other race - Speak another language Native:
43.7% (2,289)Foreign-born:
97.2% (1,834)
Two or more races - Speak only English Native:
64.1% (8,349)Foreign-born:
5.1% (195)
Two or more races - Speak another language Native:
35.9% (4,679)Foreign-born:
94.9% (3,609)
White alone - Speak only English Native:
98.3% (75,280)Foreign-born:
61.1% (2,357)
White alone - Speak another language Native:
1.7% (1,327)Foreign-born:
38.9% (1,500)
Hispanic or Latino - Speak only English Native:
53.6% (10,330)Foreign-born:
1.8% (104)
Hispanic or Latino - Speak another language Native:
46.4% (8,932)Foreign-born:
98.2% (5,631)
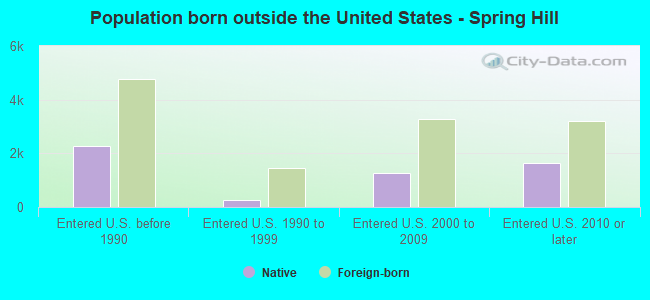
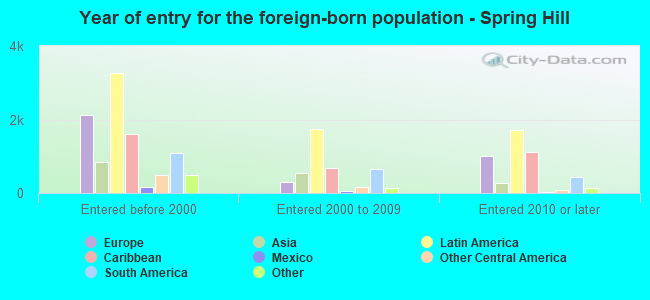
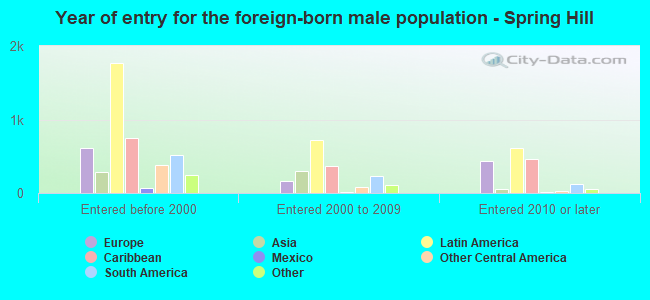
Foreign-born residents in Spring Hill 10,949 residents are foreign born (4.8% Latin America , 2.5% Europe , 1.1% Asia ).
This city:
8.9%Florida:
21.1%
Marital status for residents in Spring Hill Marital status - White (Caucasian) population 15 years and over
Males 35.2% Never married49.1% Now married0.7% Separated4.8% Widowed10.2% DivorcedFemales 21.8% Never married47.2% Now married1.9% Separated13.9% Widowed15.2% DivorcedWomen who gave birth in the past 12 months Now married:
58.9% (901)Unmarried:
41.1% (628)
Women who did not give birth in the past 12 months Now married:
40.2% (6,519)Unmarried:
59.8% (9,694)
Marital status - Black or African American population 15 years and over
Males 32.9% Never married18.2% Now married0.0% Separated20.1% Widowed28.8% DivorcedFemales 55.7% Never married18.5% Now married12.1% Separated11.2% Widowed2.5% DivorcedWomen who gave birth in the past 12 months Now married:
38.5% (5)Unmarried:
61.5% (8)
Women who did not give birth in the past 12 months Now married:
45.7% (559)Unmarried:
54.3% (663)
Marital status - American Indian / Alaska Native population 15 years and over
Males 20.4% Never married69.1% Now married0.0% Separated0.0% Widowed10.5% DivorcedFemales 45.0% Never married27.5% Now married0.0% Separated0.0% Widowed27.5% DivorcedWomen who did not give birth in the past 12 months Now married:
37.0% (33)Unmarried:
63.0% (56)
Marital status - Asian population 15 years and over
Males 29.3% Never married70.0% Now married0.0% Separated0.0% Widowed0.7% DivorcedFemales 31.8% Never married49.6% Now married2.4% Separated9.1% Widowed7.1% DivorcedWomen who did not give birth in the past 12 months Now married:
37.5% (199)Unmarried:
62.5% (331)
Marital status - Native Hawaiian / Pacific Islander population 15 years and over
Males 0.0% Never married100.0% Now married0.0% Separated0.0% Widowed0.0% DivorcedFemales 0.0% Never married0.0% Now married0.0% Separated0.0% Widowed100.0% DivorcedWomen who did not give birth in the past 12 months Now married:
0.0% (0)Unmarried:
100.0% (17)
Marital status - Other race population 15 years and over
Males 29.5% Never married47.4% Now married0.0% Separated8.6% Widowed14.6% DivorcedFemales 24.6% Never married54.6% Now married6.8% Separated4.8% Widowed9.2% DivorcedWomen who gave birth in the past 12 months Now married:
61.9% (86)Unmarried:
38.1% (53)
Women who did not give birth in the past 12 months Now married:
54.8% (1,148)Unmarried:
45.2% (949)
Marital status - Two or more races population 15 years and over
Males 31.8% Never married42.8% Now married0.4% Separated4.6% Widowed20.3% DivorcedFemales 40.5% Never married37.8% Now married0.0% Separated6.3% Widowed15.3% DivorcedWomen who gave birth in the past 12 months Now married:
100.0% (125)Unmarried:
0.0% (0)
Women who did not give birth in the past 12 months Now married:
29.1% (1,122)Unmarried:
70.9% (2,741)
Marital status - White alone, not Hispanic / Latino population 15 years and over
Males 34.4% Never married49.3% Now married0.8% Separated5.1% Widowed10.4% DivorcedFemales 21.4% Never married47.4% Now married1.8% Separated13.9% Widowed15.5% DivorcedWomen who gave birth in the past 12 months Now married:
58.9% (901)Unmarried:
41.1% (628)
Women who did not give birth in the past 12 months Now married:
37.8% (5,542)Unmarried:
62.2% (9,104)
Marital status - Hispanic or Latino population 15 years and over
Males 36.0% Never married44.1% Now married0.0% Separated4.2% Widowed15.7% DivorcedFemales 33.5% Never married46.0% Now married0.8% Separated6.6% Widowed13.1% DivorcedWomen who gave birth in the past 12 months Now married:
60.1% (148)Unmarried:
39.9% (98)
Women who did not give birth in the past 12 months Now married:
47.1% (3,038)Unmarried:
52.9% (3,418)
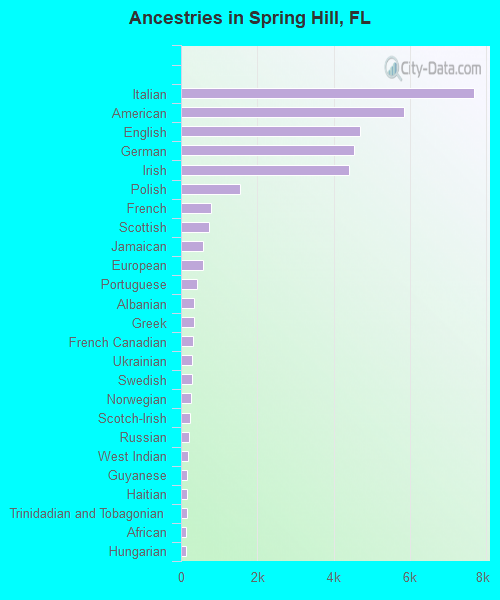
Ancestries in Spring Hill
7,690 13.1% Italian5,847 9.9% American4,702 8.0% English4,537 7.7% German4,415 7.5% Irish1,543 2.6% Polish774 1.3% French734 1.2% Scottish575 1.0% Jamaican568 1.0% European410 0.7% Portuguese352 0.6% Albanian341 0.6% Greek324 0.6% French Canadian278 0.5% Ukrainian277 0.5% Swedish254 0.4% Norwegian248 0.4% Scotch-Irish206 0.4% Russian183 0.3% West Indian158 0.3% Guyanese149 0.3% Haitian147 0.2% Trinidadian and Tobagonian140 0.2% African139 0.2% Hungarian138 0.2% Barbadian127 0.2% Scandinavian120 0.2% Lithuanian118 0.2% British118 0.2% Romanian110 0.2% Eastern European101 0.2% Brazilian97 0.2% Welsh84 0.1% Czech82 0.1% Lebanese75 0.1% Bahamian70 0.1% Dutch69 0.1% Finnish60 0.1% Canadian59 0.1% Belgian49 0.08% Croatian40 0.07% Northern European40 0.07% Danish40 0.07% Cape Verdean38 0.06% Austrian34 0.06% Slovak25 0.04% Slovene21 0.04% Swiss17 0.03% Czechoslovakian17 0.03% Nigerian16 0.03% Ethiopian16 0.03% Syrian16 0.03% Latvian15 0.03% Maltese15 0.03% Serbian13 0.02% Arab13 0.02% Belizean12 0.02% Iranian8 0.01% Celtic7 0.01% Assyrian5 0.01% Egyptian
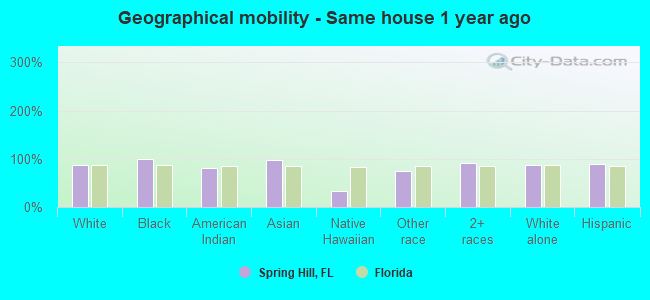
Geographical mobility in Spring Hill Same house 1 year ago 77,440 86.7% White (Caucasian)7,236 99.0% Black or African American443 81.7% American Indian / Alaska Native1,967 97.0% Asian22 32.4% Native Hawaiian / Pacific Islander5,894 74.2% Other race16,304 91.8% Two or more races71,928 86.5% White alone, not Hispanic / Latino23,890 88.2% Hispanic or LatinoMoved within same county 4,201 4.7% White / Caucasian133 1.8% Black or African American30 1.5% Asian193 2.4% Other race94 0.5% Two or more races4,127 5.0% White alone, not Hispanic / Latino770 2.8% Hispanic or LatinoMoved within same state 4,718 5.3% White / Caucasian333 4.6% Black or African American82 15.1% American Indian / Alaska Native16 0.8% Asian1,040 13.1% Other race1,033 5.8% Two or more races4,450 5.4% White alone, not Hispanic / Latino1,423 5.3% Hispanic or LatinoMoved from different state 2,547 2.9% White / Caucasian167 2.3% Black or African American14 2.7% American Indian / Alaska Native20 1.0% Asian78 100.0% Native Hawaiian / Pacific Islander573 7.2% Other race338 1.9% Two or more races2,492 3.0% White alone, not Hispanic / Latino1,101 4.1% Hispanic or LatinoMoved from abroad 439 0.5% White13 0.7% Asian6 0.1% Other race164 0.2% White alone, not Hispanic / Latino252 0.9% Hispanic or Latino
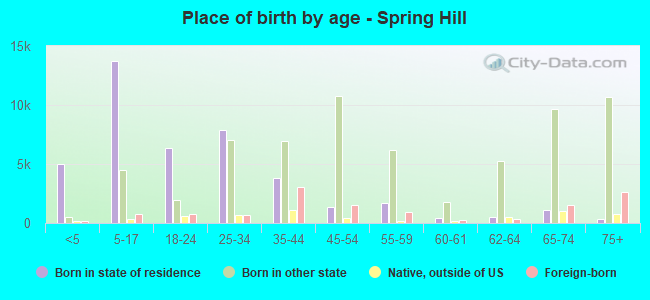
Children Nativity (place of birth) in Spring Hill
Children under 6 years - Living with two parents Both parents native 3,554 100.0% NativeBoth parents foreign-born 378 75.2% Native125 24.8% Foreign-bornOne native, one foreign-born parent 190 100.0% NativeChildren under 6 years - Living with one parent Native parent 2,431 99.7% Native8 0.3% Foreign-bornForeign-born parent 120 100.0% NativeChildren 6 to 17 years - Living with two parents Both parents native 7,661 99.8% Native18 0.2% Foreign-bornBoth parents foreign-born 798 79.5% Native205 20.5% Foreign-bornOne native, one foreign-born parent 690 94.4% Native41 5.6% Foreign-bornChildren 6 to 17 years - Living with one parent Native parent 5,237 100.0% NativeForeign-born parent 564 51.3% Native536 48.7% Foreign-born
Grandparents responsible for own grandchildren in Spring Hill
Grandparents (30 to 59 years) White / Caucasian 220 30.5% Responsible for grandchildren502 69.5% Not responsible for grandchildrenBlack or African American 32 100.0% Responsible for grandchildrenAmerican Indian / Alaska Native 13 38.9% Responsible for grandchildren21 61.1% Not responsible for grandchildrenOther race 18 24.4% Responsible for grandchildren57 75.6% Not responsible for grandchildrenTwo or more races 108 33.9% Responsible for grandchildren210 66.1% Not responsible for grandchildrenWhite alone, not Hispanic / Latino 220 30.5% Responsible for grandchildren502 69.5% Not responsible for grandchildrenHispanic or Latino 129 45.0% Responsible for grandchildren157 55.0% Not responsible for grandchildrenGrandparents (60 years and over) White / Caucasian 793 50.7% Responsible for grandchildren772 49.3% Not responsible for grandchildrenBlack or African American 71 39.2% Responsible for grandchildren110 60.8% Not responsible for grandchildrenOther race 113 100.0% Not responsible for grandchildrenTwo or more races 189 100.0% Not responsible for grandchildrenWhite alone, not Hispanic / Latino 793 55.0% Responsible for grandchildren648 45.0% Not responsible for grandchildrenHispanic or Latino 88 19.7% Responsible for grandchildren360 80.3% Not responsible for grandchildren