Races in Springville, Utah (UT) Detailed Stats
Data:
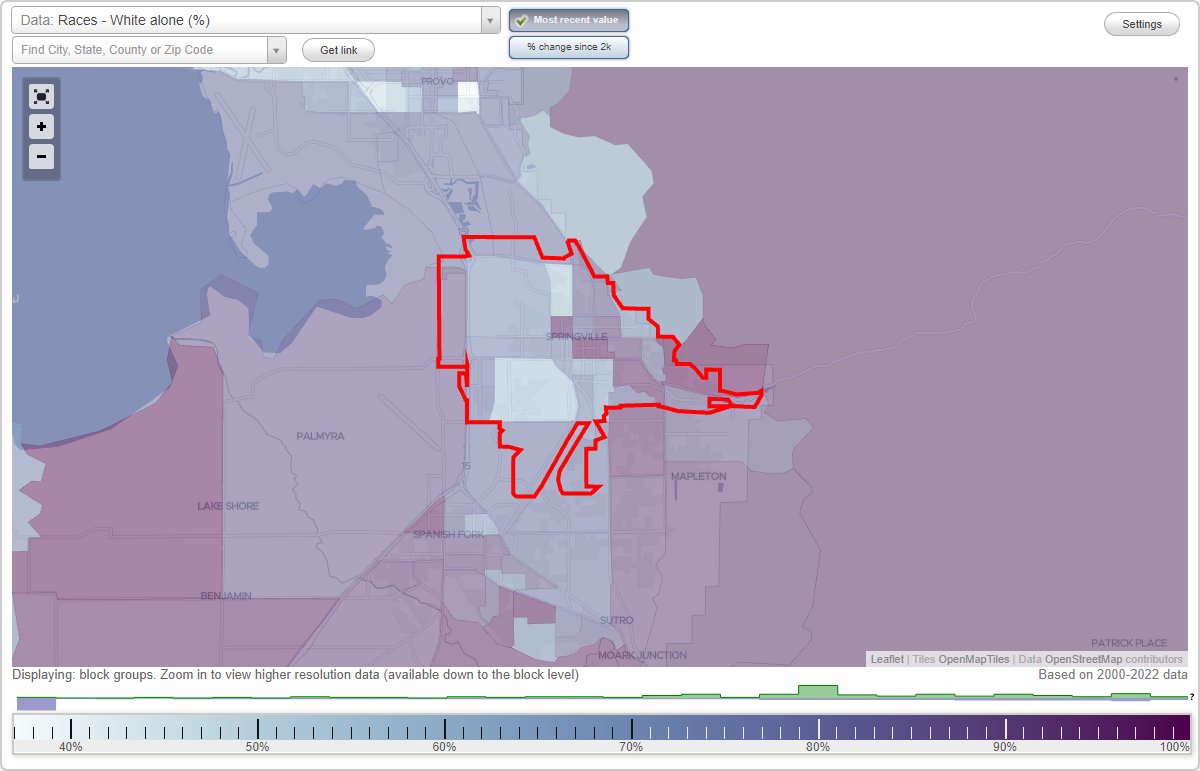
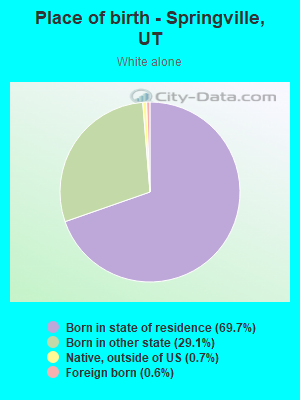
Races - White alone (%)
Races - White alone (% change since 2000)
Races - Black alone (%)
Races - Black alone (% change since 2000)
Races - American Indian alone (%)
Races - American Indian alone (% change since 2000)
Races - Asian alone (%)
Races - Asian alone (% change since 2000)
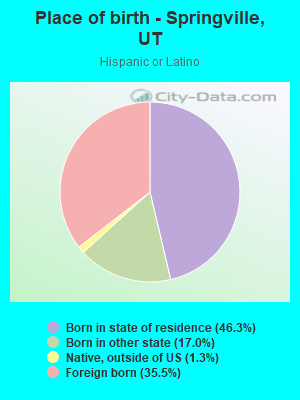
Races - Hispanic (%)
Races - Hispanic (% change since 2000)
Races - Native Hawaiian and Other Pacific Islander alone (%)
Races - Native Hawaiian and Other Pacific Islander alone (% change since 2000)
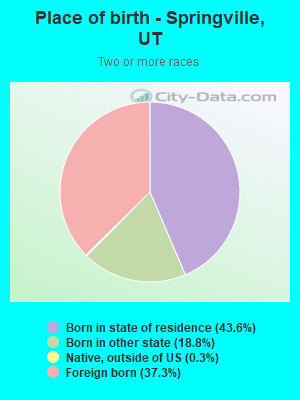
Races - Two or more races(%)
Races - Two or more races(% change since 2000)
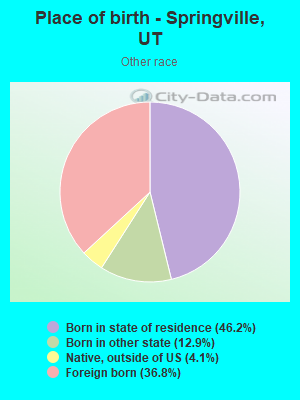
Races - Other race alone (%)
Races - Other race alone (% change since 2000)
Racial diversity
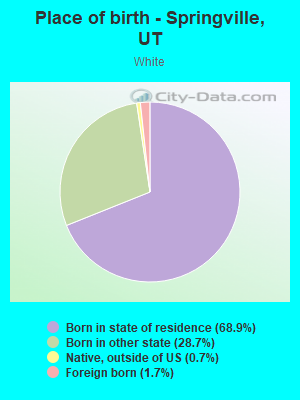
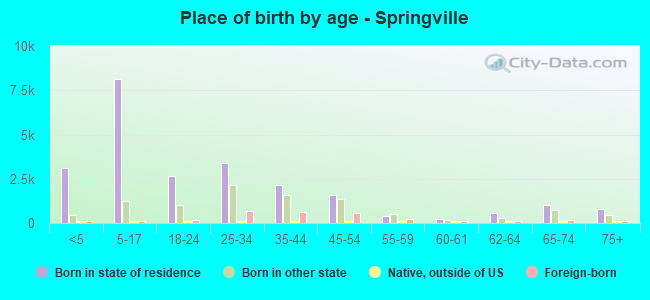
Place of birth - Born in state of residence (%)
Place of birth - Born in state of residence (%) - White
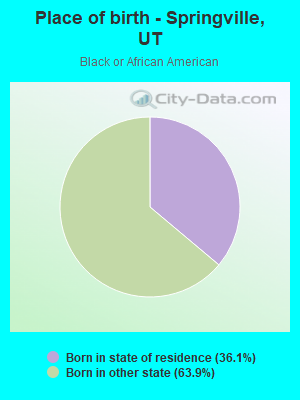
Place of birth - Born in state of residence (%) - Black or African American
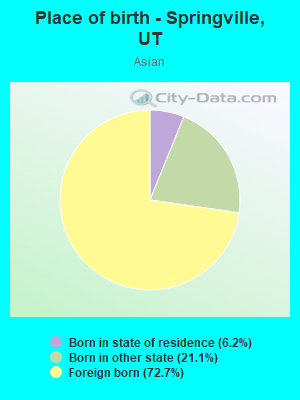
Place of birth - Born in state of residence (%) - Asian
Place of birth - Born in state of residence (%) - Hispanic or Latino
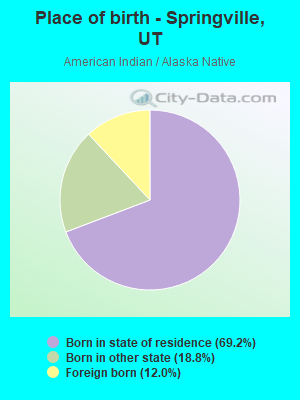
Place of birth - Born in state of residence (%) - American Indian and Alaska Native
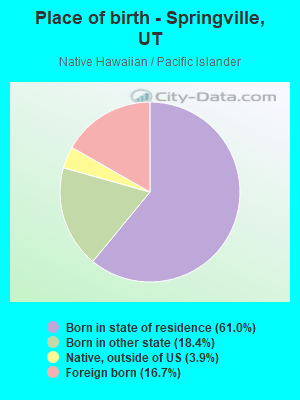
Place of birth - Born in state of residence (%) - Multirace
Place of birth - Born in state of residence (%) - Other Race
Place of birth - Born in other state (%)
Place of birth - Born in other state (%) - White
Place of birth - Born in other state (%) - Black or African American
Place of birth - Born in other state (%) - Asian
Place of birth - Born in other state (%) - Hispanic or Latino
Place of birth - Born in other state (%) - American Indian and Alaska Native
Place of birth - Born in other state (%) - Multirace
Place of birth - Born in other state (%) - Other Race
Place of birth - Native, outside of US (%)
Place of birth - Native, outside of US (%) - White
Place of birth - Native, outside of US (%) - Black or African American
Place of birth - Native, outside of US (%) - Asian
Place of birth - Native, outside of US (%) - Hispanic or Latino
Place of birth - Native, outside of US (%) - American Indian and Alaska Native
Place of birth - Native, outside of US (%) - Multirace
Place of birth - Native, outside of US (%) - Other Race
Place of birth - Foreign born (%)
Place of birth - Foreign born (%) - White
Place of birth - Foreign born (%) - Black or African American
Place of birth - Foreign born (%) - Asian
Place of birth - Foreign born (%) - Hispanic or Latino
Place of birth - Foreign born (%) - American Indian and Alaska Native
Place of birth - Foreign born (%) - Multirace
Place of birth - Foreign born (%) - Other Race
Residents speaking English at home (%)
Residents speaking English at home - Born in the United States (%)
Residents speaking English at home - Native, born elsewhere (%)
Residents speaking English at home - Foreign born (%)
Residents speaking Spanish at home (%)
Residents speaking Spanish at home - Born in the United States (%)
Residents speaking Spanish at home - Native, born elsewhere (%)
Residents speaking Spanish at home - Foreign born (%)
Residents speaking other language at home (%)
Residents speaking other language at home - Born in the United States (%)
Residents speaking other language at home - Native, born elsewhere (%)
Residents speaking other language at home - Foreign born (%)
Marital status - Never married (%)
Marital status - Now married (%)
Marital status - Separated (%)
Marital status - Widowed (%)
Marital status - Divorced (%)
Ancestries Reported - Arab (%)
Ancestries Reported - Czech (%)
Ancestries Reported - Danish (%)
Ancestries Reported - Dutch (%)
Ancestries Reported - English (%)
Ancestries Reported - French (%)
Ancestries Reported - French Canadian (%)
Ancestries Reported - German (%)
Ancestries Reported - Greek (%)
Ancestries Reported - Hungarian (%)
Ancestries Reported - Irish (%)
Ancestries Reported - Italian (%)
Ancestries Reported - Lithuanian (%)
Ancestries Reported - Norwegian (%)
Ancestries Reported - Polish (%)
Ancestries Reported - Portuguese (%)
Ancestries Reported - Russian (%)
Ancestries Reported - Scotch-Irish (%)
Ancestries Reported - Scottish (%)
Ancestries Reported - Slovak (%)
Ancestries Reported - Subsaharan African (%)
Ancestries Reported - Swedish (%)
Ancestries Reported - Swiss (%)
Ancestries Reported - Ukrainian (%)
Ancestries Reported - United States (%)
Ancestries Reported - Welsh (%)
Ancestries Reported - West Indian (%)
Ancestries Reported - Other (%)
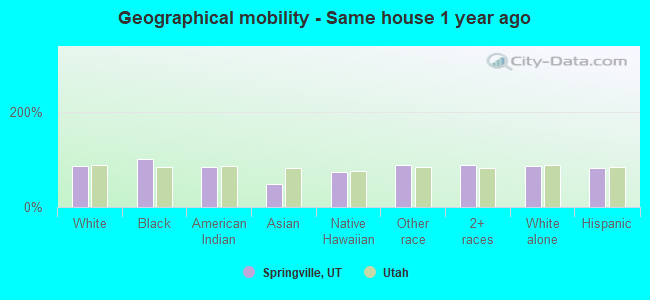
Geographical mobility - Same house 1 year ago (%)
Geographical mobility - Same house 1 year ago (%) - White
Geographical mobility - Same house 1 year ago (%) - Black or African American
Geographical mobility - Same house 1 year ago (%) - Asian
Geographical mobility - Same house 1 year ago (%) - Hispanic or Latino
Geographical mobility - Same house 1 year ago (%) - American Indian and Alaska Native
Geographical mobility - Same house 1 year ago (%) - Multirace
Geographical mobility - Same house 1 year ago (%) - Other Race
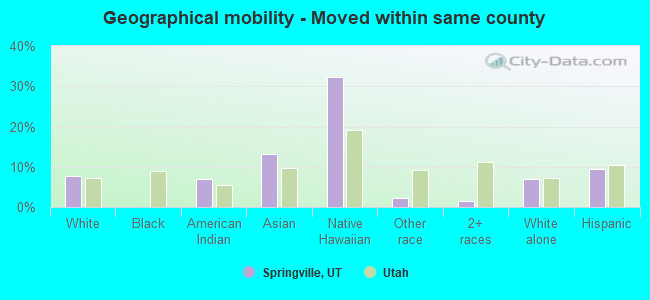
Geographical mobility - Moved within same county (%)
Geographical mobility - Moved within same county (%) - White
Geographical mobility - Moved within same county (%) - Black or African American
Geographical mobility - Moved within same county (%) - Asian
Geographical mobility - Moved within same county (%) - Hispanic or Latino
Geographical mobility - Moved within same county (%) - American Indian and Alaska Native
Geographical mobility - Moved within same county (%) - Multirace
Geographical mobility - Moved within same county (%) - Other Race
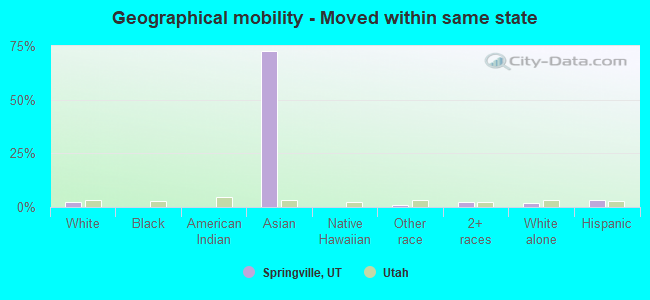
Geographical mobility - Moved from different county within same state (%)
Geographical mobility - Moved from different county within same state (%) - White
Geographical mobility - Moved from different county within same state (%) - Black or African American
Geographical mobility - Moved from different county within same state (%) - Asian
Geographical mobility - Moved from different county within same state (%) - Hispanic or Latino
Geographical mobility - Moved from different county within same state (%) - American Indian and Alaska Native
Geographical mobility - Moved from different county within same state (%) - Multirace
Geographical mobility - Moved from different county within same state (%) - Other Race
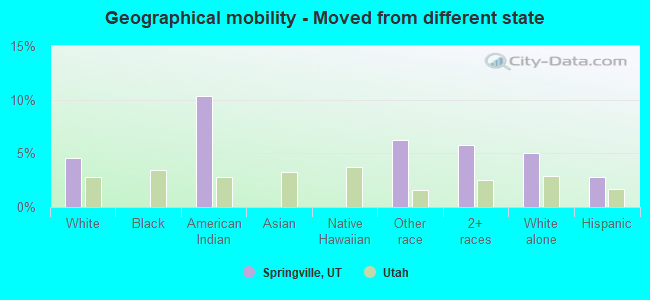
Geographical mobility - Moved from different state (%)
Geographical mobility - Moved from different state (%) - White
Geographical mobility - Moved from different state (%) - Black or African American
Geographical mobility - Moved from different state (%) - Asian
Geographical mobility - Moved from different state (%) - Hispanic or Latino
Geographical mobility - Moved from different state (%) - American Indian and Alaska Native
Geographical mobility - Moved from different state (%) - Multirace
Geographical mobility - Moved from different state (%) - Other Race
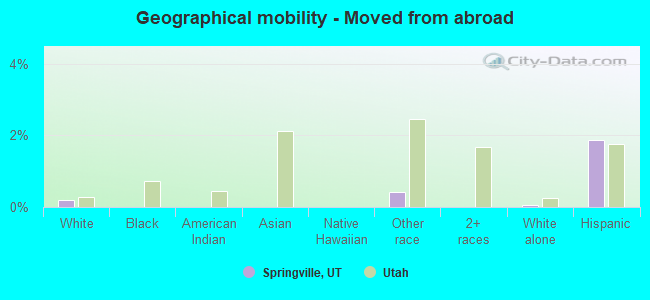
Geographical mobility - Moved from abroad (%)
Geographical mobility - Moved from abroad (%) - White
Geographical mobility - Moved from abroad (%) - Black or African American
Geographical mobility - Moved from abroad (%) - Asian
Geographical mobility - Moved from abroad (%) - Hispanic or Latino
Geographical mobility - Moved from abroad (%) - American Indian and Alaska Native
Geographical mobility - Moved from abroad (%) - Multirace
Geographical mobility - Moved from abroad (%) - Other Race
Place of birth for the foreign-born population - Ireland (%)
Place of birth for the foreign-born population - Denmark (%)
Place of birth for the foreign-born population - Norway (%)
Place of birth for the foreign-born population - Sweden (%)
Place of birth for the foreign-born population - United Kingdom (%)
Place of birth for the foreign-born population - England (%)
Place of birth for the foreign-born population - Scotland (%)
Place of birth for the foreign-born population - Other Northern Europe (%)
Place of birth for the foreign-born population - Austria (%)
Place of birth for the foreign-born population - Belgium (%)
Place of birth for the foreign-born population - France (%)
Place of birth for the foreign-born population - Germany (%)
Place of birth for the foreign-born population - Netherlands (%)
Place of birth for the foreign-born population - Switzerland (%)
Place of birth for the foreign-born population - Other Western Europe (%)
Place of birth for the foreign-born population - Greece (%)
Place of birth for the foreign-born population - Italy (%)
Place of birth for the foreign-born population - Portugal (%)
Place of birth for the foreign-born population - Spain (%)
Place of birth for the foreign-born population - Other Southern Europe (%)
Place of birth for the foreign-born population - Albania (%)
Place of birth for the foreign-born population - Belarus (%)
Place of birth for the foreign-born population - Bosnia and Herzegovina (%)
Place of birth for the foreign-born population - Bulgaria (%)
Place of birth for the foreign-born population - Croatia (%)
Place of birth for the foreign-born population - Czechoslovakia (%)
Place of birth for the foreign-born population - Hungary (%)
Place of birth for the foreign-born population - Latvia (%)
Place of birth for the foreign-born population - Lithuania (%)
Place of birth for the foreign-born population - North Macedonia (Macedonia) (%)
Place of birth for the foreign-born population - Moldova (%)
Place of birth for the foreign-born population - Poland (%)
Place of birth for the foreign-born population - Romania (%)
Place of birth for the foreign-born population - Russia (%)
Place of birth for the foreign-born population - Serbia (%)
Place of birth for the foreign-born population - Ukraine (%)
Place of birth for the foreign-born population - Other Eastern Europe (%)
Place of birth for the foreign-born population - China (%)
Place of birth for the foreign-born population - Hong Kong (%)
Place of birth for the foreign-born population - Taiwan (%)
Place of birth for the foreign-born population - Japan (%)
Place of birth for the foreign-born population - Korea (%)
Place of birth for the foreign-born population - Other Eastern Asia (%)
Place of birth for the foreign-born population - Afghanistan (%)
Place of birth for the foreign-born population - Bangladesh (%)
Place of birth for the foreign-born population - India (%)
Place of birth for the foreign-born population - Iran (%)
Place of birth for the foreign-born population - Kazakhstan (%)
Place of birth for the foreign-born population - Nepal (%)
Place of birth for the foreign-born population - Pakistan (%)
Place of birth for the foreign-born population - Sri Lanka (%)
Place of birth for the foreign-born population - Uzbekistan (%)
Place of birth for the foreign-born population - Other South Central Asia (%)
Place of birth for the foreign-born population - Burma (%)
Place of birth for the foreign-born population - Cambodia (%)
Place of birth for the foreign-born population - Indonesia (%)
Place of birth for the foreign-born population - Laos (%)
Place of birth for the foreign-born population - Malaysia (%)
Place of birth for the foreign-born population - Philippines (%)
Place of birth for the foreign-born population - Singapore (%)
Place of birth for the foreign-born population - Thailand (%)
Place of birth for the foreign-born population - Vietnam (%)
Place of birth for the foreign-born population - Other South Eastern Asia (%)
Place of birth for the foreign-born population - Armenia (%)
Place of birth for the foreign-born population - Iraq (%)
Place of birth for the foreign-born population - Israel (%)
Place of birth for the foreign-born population - Jordan (%)
Place of birth for the foreign-born population - Kuwait (%)
Place of birth for the foreign-born population - Lebanon (%)
Place of birth for the foreign-born population - Saudi Arabia (%)
Place of birth for the foreign-born population - Syria (%)
Place of birth for the foreign-born population - Turkey (%)
Place of birth for the foreign-born population - Yemen (%)
Place of birth for the foreign-born population - Other Western Asia (%)
Place of birth for the foreign-born population - Eritrea (%)
Place of birth for the foreign-born population - Ethiopia (%)
Place of birth for the foreign-born population - Kenya (%)
Place of birth for the foreign-born population - Somalia (%)
Place of birth for the foreign-born population - Uganda (%)
Place of birth for the foreign-born population - Zimbabwe (%)
Place of birth for the foreign-born population - Other Eastern Africa (%)
Place of birth for the foreign-born population - Cameroon (%)
Place of birth for the foreign-born population - Congo (%)
Place of birth for the foreign-born population - Democratic Republic of Congo (Zaire) (%)
Place of birth for the foreign-born population - Other Middle Africa (%)
Place of birth for the foreign-born population - Egypt (%)
Place of birth for the foreign-born population - Morocco (%)
Place of birth for the foreign-born population - Sudan (%)
Place of birth for the foreign-born population - Other Northern Africa (%)
Place of birth for the foreign-born population - South Africa (%)
Place of birth for the foreign-born population - Other Southern Africa (%)
Place of birth for the foreign-born population - Cabo Verde (%)
Place of birth for the foreign-born population - Ghana (%)
Place of birth for the foreign-born population - Liberia (%)
Place of birth for the foreign-born population - Nigeria (%)
Place of birth for the foreign-born population - Senegal (%)
Place of birth for the foreign-born population - Sierra Leone (%)
Place of birth for the foreign-born population - Other Western Africa (%)
Place of birth for the foreign-born population - Australia (%)
Place of birth for the foreign-born population - New Zealand (%)
Place of birth for the foreign-born population - Fiji (%)
Place of birth for the foreign-born population - Micronesia (%)
Place of birth for the foreign-born population - Bahamas (%)
Place of birth for the foreign-born population - Barbados (%)
Place of birth for the foreign-born population - Cuba (%)
Place of birth for the foreign-born population - Dominica (%)
Place of birth for the foreign-born population - Dominican Republic (%)
Place of birth for the foreign-born population - Grenada (%)
Place of birth for the foreign-born population - Haiti (%)
Place of birth for the foreign-born population - Jamaica (%)
Place of birth for the foreign-born population - St. Vincent and the Grenadines (%)
Place of birth for the foreign-born population - Trinidad and Tobago (%)
Place of birth for the foreign-born population - West Indies (%)
Place of birth for the foreign-born population - Other Caribbean (%)
Place of birth for the foreign-born population - Belize (%)
Place of birth for the foreign-born population - Costa Rica (%)
Place of birth for the foreign-born population - El Salvador (%)
Place of birth for the foreign-born population - Guatemala (%)
Place of birth for the foreign-born population - Honduras (%)
Place of birth for the foreign-born population - Mexico (%)
Place of birth for the foreign-born population - Nicaragua (%)
Place of birth for the foreign-born population - Panama (%)
Place of birth for the foreign-born population - Other Central America (%)
Place of birth for the foreign-born population - Argentina (%)
Place of birth for the foreign-born population - Bolivia (%)
Place of birth for the foreign-born population - Brazil (%)
Place of birth for the foreign-born population - Chile (%)
Place of birth for the foreign-born population - Colombia (%)
Place of birth for the foreign-born population - Ecuador (%)
Place of birth for the foreign-born population - Guyana (%)
Place of birth for the foreign-born population - Peru (%)
Place of birth for the foreign-born population - Uruguay (%)
Place of birth for the foreign-born population - Venezuela (%)
Place of birth for the foreign-born population - Other South America (%)
Place of birth for the foreign-born population - Canada (%)
Place of birth for the foreign-born population - Other Northern America (%)
Place of birth for the foreign-born population - Other (%)
Latest news about races in Springville, UT collected exclusively by city-data.com from local newspapers, TV, and radio stations
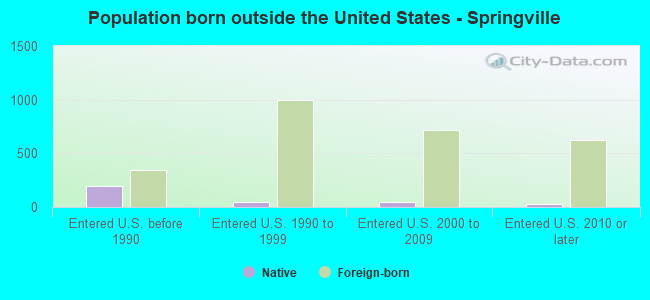
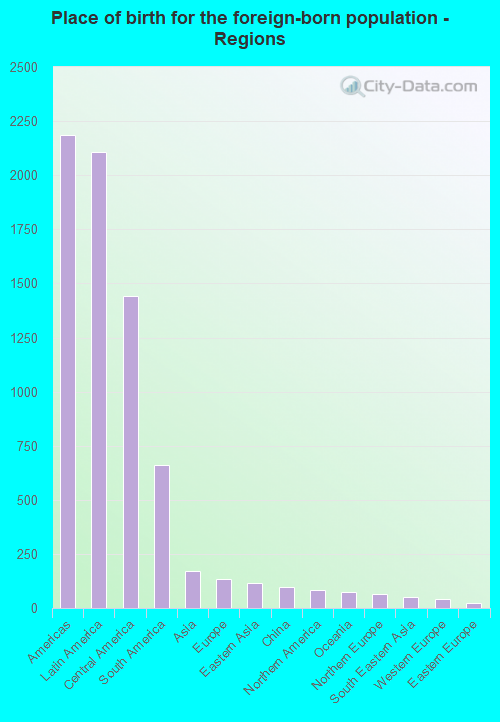
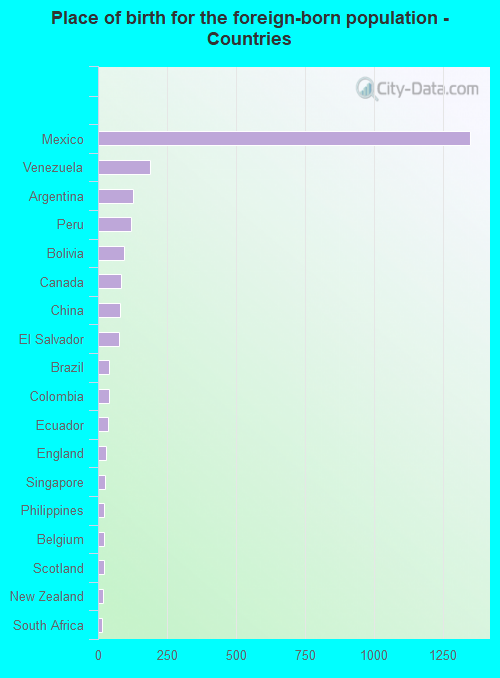
According to 2022 data, the most numerous races in Springville, UT are White alone (29,110 residents), Hispanic (6,209 residents), and Two or more races (726 residents). 81.1% of Springville residents speak English at home. 7.0% of Springville, UT residents are foreign-born (5.6% born in Latin America), which is 14.9% less than the foreign-born rate of 8.0% across the entire state of Utah.
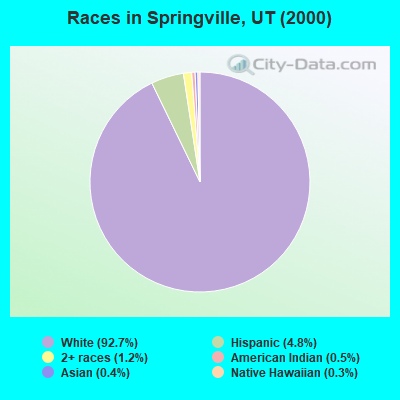
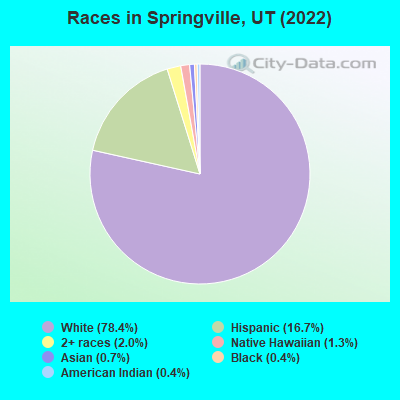
Race distribution in Springville
2000 2022
1,904,265 85.3% White alone 201,559 9.0% Hispanic 36,483 1.6% Asian alone 31,308 1.4% Two or more races 26,663 1.2% American Indian alone 14,806 0.7% Native Hawaiian and Other 16,137 0.7% Black alone 1,948 0.09% Other race alone
2,557,466 75.6% White alone 512,086 15.1% Hispanic 119,308 3.5% Two or more races 82,388 2.4% Asian alone 36,978 1.1% Native Hawaiian and Other 34,873 1.0% Black alone 22,803 0.7% American Indian alone 14,898 0.4% Other race alone
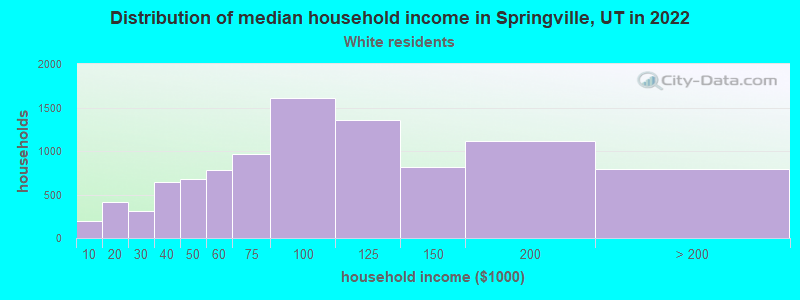
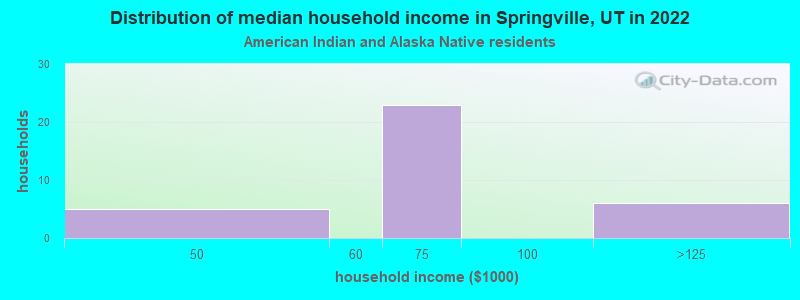
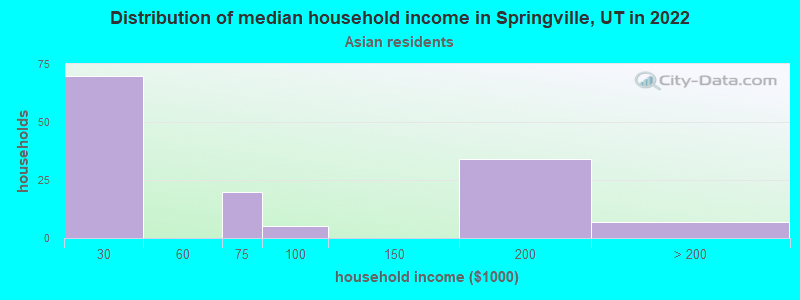
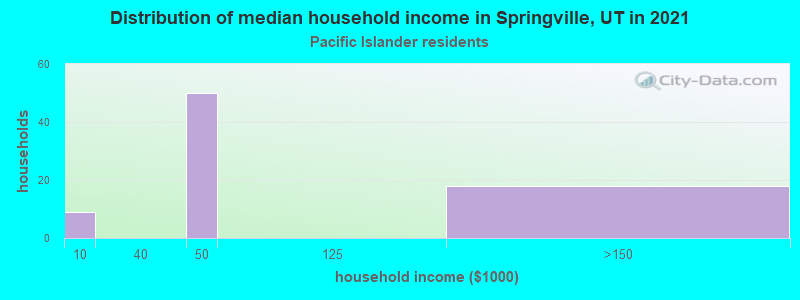
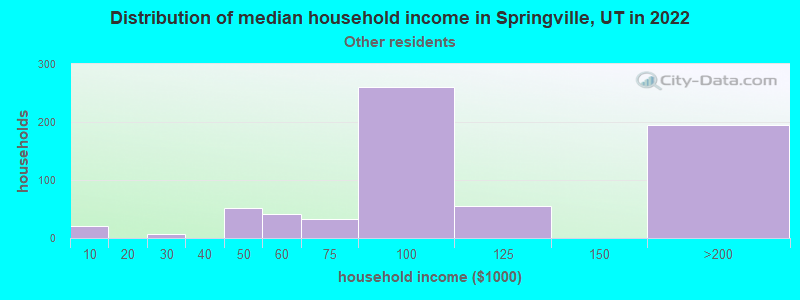
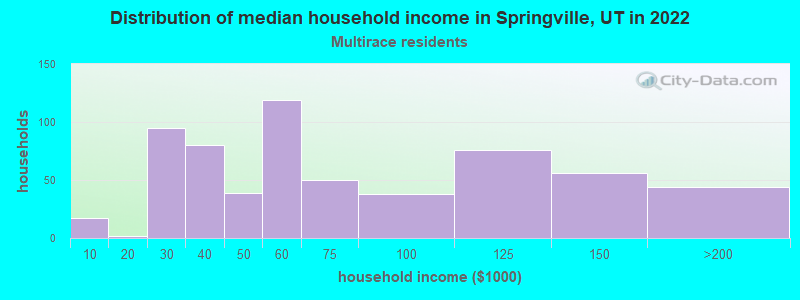
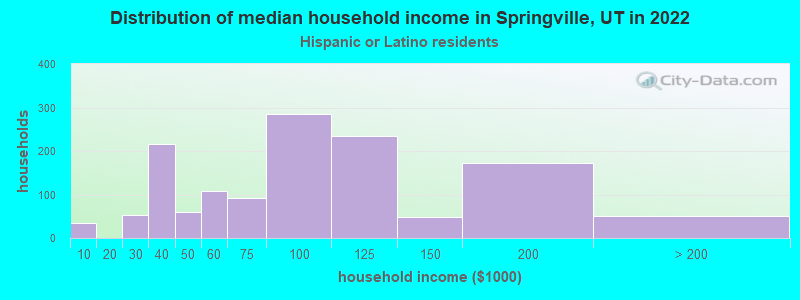
Income and house value in Springville Median household income in 2022 $90,631 White non-Hispanic householders$148,105 American Indian and Alaska Native householders$81,782 Some other race householders$61,474 Two or more races householders$83,610 Hispanic or Latino race householdersMedian 2022 house value $498,404 White Non-Hispanic householders$458,705 Black or African American householders$576,801 American Indian or Alaska Native householders $917,410 Asian householders$291,903 Native Hawaiian and other Pacific Islander householders$389,982 Some other race householders$471,382 Two or more races householders$442,692 Hispanic or Latino householders
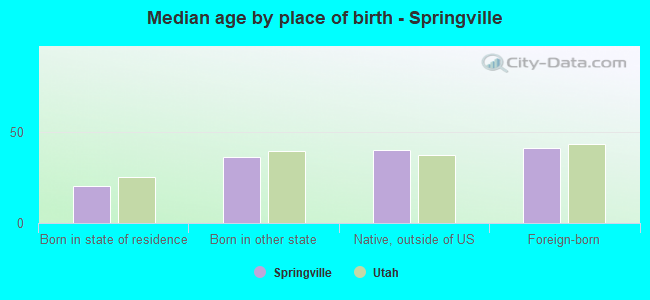
Median age by race in Springville
27.6 Median age for White residents26.3 29.7 22.6 Median age for Black or African American residents20.9 -640,650,405.9 31.7 Median age for American Indian / Alaska Native residents30.2 38.1 24.4 Median age for Asian residents25.2 24.2 15.4 Median age for Native Hawaiian / Pacific Islander residents13.2 28.2 28.1 Median age for Other race residents32.3 16.8 19.1 Median age for Two or more races residents30.2 15.6 28.4 Median age for White alone residents26.8 30.2 23.6 Median age for Hispanic or Latino residents26.0 19.7
Owner/renter occupied households by race in Springville
House owners and renters - White residents 7,016 71.9% Owner occupied2,745 28.1% Renter occupiedHouse owners and renters - American Indian / Alaska Native residents 14 55.5% Owner occupied11 44.5% Renter occupiedHouse owners and renters - Asian residents 64 58.9% Owner occupied44 41.1% Renter occupiedHouse owners and renters - Native Hawaiian / Pacific Islander residents 50 46.5% Owner occupied58 53.5% Renter occupiedHouse owners and renters - Other race residents 384 62.0% Owner occupied235 38.0% Renter occupiedHouse owners and renters - Two or more races residents 367 64.6% Owner occupied201 35.4% Renter occupiedHouse owners and renters - White alone residents 6,826 72.5% Owner occupied2,593 27.5% Renter occupiedHouse owners and renters - Hispanic or Latino residents 782 59.0% Owner occupied543 41.0% Renter occupied
Language usage in Springville
English speakers - Total 81.1% of residents of Springville speak English at home.
14.9% of residents speak Spanish at home 3,354 67.1% Speak English very well1,643 32.9% Speak English less than very well3.9% of residents speak other language at home 1,203 91.7% Speak English very well109 8.3% Speak English less than very well
English speakers - Born in the United States 86.6% of residents of Springville speak English at home.
9.2% of residents speak Spanish at home 834 95.3% Speak English very well41 4.7% Speak English less than very well4.0% of residents speak other language at home 386 100.0% Speak English very well
English speakers - Native, born elsewhere 59.7% of residents of Springville speak English at home.
18.2% of residents speak Spanish at home 39 67.2% Speak English very well19 32.8% Speak English less than very well12.9% of residents speak other language at home 41 100.0% Speak English very well
English speakers - Foreign-born 11.3% of residents of Springville speak English at home.
78.6% of residents speak Spanish at home 800 36.9% Speak English very well1,370 63.1% Speak English less than very well10.0% of residents speak other language at home 216 78.3% Speak English very well60 21.7% Speak English less than very well
White (Caucasian) - Speak only English Native:
92.1% (25,289)Foreign-born:
21.9% (113)
White (Caucasian) - Speak another language Native:
7.5% (2,050)Foreign-born:
68.9% (356)
American Indian / Alaska Native - Speak another language Native:
41.7% (44)Foreign-born:
96.1% (22)
Asian - Speak only English Native:
26.3% (22)Foreign-born:
49.1% (95)
Asian - Speak another language Native:
80.2% (66)Foreign-born:
55.2% (107)
Native Hawaiian / Pacific Islander - Speak another language Native:
17.8% (60)Foreign-born:
90.6% (78)
Other race - Speak another language Native:
84.1% (1,331)Foreign-born:
100.0% (1,020)
Two or more races - Speak only English Native:
62.6% (798)Foreign-born:
13.0% (132)
Two or more races - Speak another language Native:
40.3% (513)Foreign-born:
86.8% (881)
White alone - Speak only English Native:
93.1% (24,385)Foreign-born:
69.6% (112)
White alone - Speak another language Native:
6.8% (1,789)Foreign-born:
32.6% (52)
Hispanic or Latino - Speak only English Native:
46.9% (1,588)Foreign-born:
1.6% (36)
Hispanic or Latino - Speak another language Native:
53.1% (1,799)Foreign-born:
99.6% (2,207)
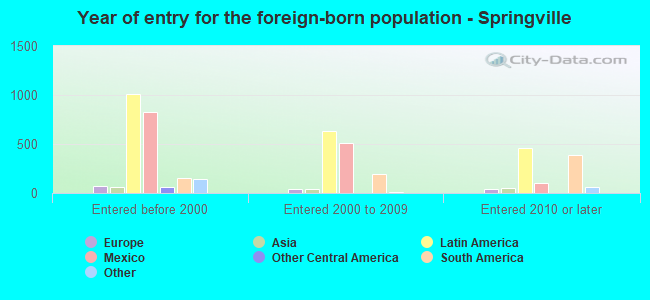
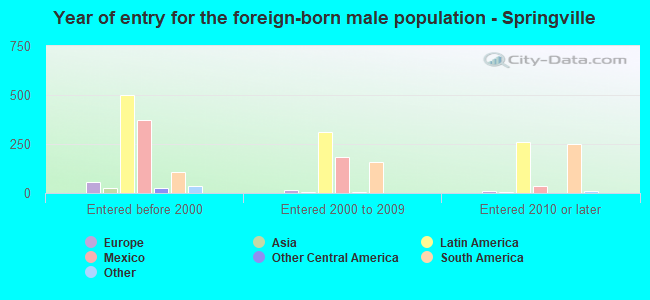
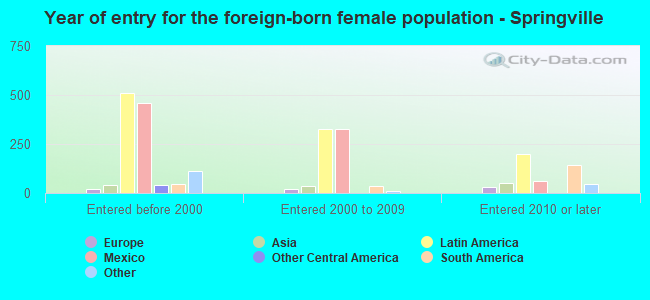
Foreign-born residents in Springville 2,585 residents are foreign born (5.6% Latin America ).
Marital status for residents in Springville Marital status - White (Caucasian) population 15 years and over
Males 27.3% Never married65.0% Now married0.5% Separated1.0% Widowed6.2% DivorcedFemales 24.2% Never married59.0% Now married1.1% Separated4.7% Widowed11.0% DivorcedWomen who gave birth in the past 12 months Now married:
97.9% (696)Unmarried:
2.1% (15)
Women who did not give birth in the past 12 months Now married:
57.3% (4,056)Unmarried:
42.7% (3,027)
Marital status - American Indian / Alaska Native population 15 years and over
Males 22.2% Never married77.8% Now married0.0% Separated0.0% Widowed0.0% DivorcedFemales 13.7% Never married80.0% Now married0.0% Separated6.3% Widowed0.0% DivorcedWomen who gave birth in the past 12 months Now married:
100.0% (13)Unmarried:
0.0% (0)
Women who did not give birth in the past 12 months Now married:
68.6% (26)Unmarried:
31.4% (12)
Marital status - Asian population 15 years and over
Males 4.8% Never married95.2% Now married0.0% Separated0.0% Widowed0.0% DivorcedFemales 0.0% Never married90.3% Now married0.0% Separated4.9% Widowed4.9% DivorcedWomen who gave birth in the past 12 months Now married:
100.0% (46)Unmarried:
0.0% (0)
Women who did not give birth in the past 12 months Now married:
100.0% (27)Unmarried:
0.0% (0)
Marital status - Native Hawaiian / Pacific Islander population 15 years and over
Males 37.5% Never married62.5% Now married0.0% Separated0.0% Widowed0.0% DivorcedFemales 24.5% Never married26.6% Now married0.0% Separated0.0% Widowed48.9% DivorcedWomen who did not give birth in the past 12 months Now married:
29.4% (41)Unmarried:
70.6% (99)
Marital status - Other race population 15 years and over
Males 43.2% Never married49.0% Now married0.0% Separated0.0% Widowed7.8% DivorcedFemales 28.9% Never married61.7% Now married0.0% Separated8.0% Widowed1.4% DivorcedWomen who gave birth in the past 12 months Now married:
100.0% (33)Unmarried:
0.0% (0)
Women who did not give birth in the past 12 months Now married:
61.5% (318)Unmarried:
38.5% (199)
Marital status - Two or more races population 15 years and over
Males 26.6% Never married63.5% Now married6.6% Separated1.2% Widowed2.2% DivorcedFemales 41.7% Never married49.0% Now married0.0% Separated0.0% Widowed9.3% DivorcedWomen who gave birth in the past 12 months Now married:
100.0% (19)Unmarried:
0.0% (0)
Women who did not give birth in the past 12 months Now married:
42.3% (196)Unmarried:
57.7% (267)
Marital status - White alone, not Hispanic / Latino population 15 years and over
Males 27.8% Never married64.0% Now married0.3% Separated1.1% Widowed6.8% DivorcedFemales 23.4% Never married59.1% Now married1.2% Separated5.1% Widowed11.2% DivorcedWomen who gave birth in the past 12 months Now married:
97.7% (679)Unmarried:
2.3% (16)
Women who did not give birth in the past 12 months Now married:
58.0% (3,843)Unmarried:
42.0% (2,784)
Marital status - Hispanic or Latino population 15 years and over
Males 27.9% Never married65.6% Now married3.4% Separated0.4% Widowed2.8% DivorcedFemales 32.7% Never married57.8% Now married0.0% Separated2.2% Widowed7.4% DivorcedWomen who gave birth in the past 12 months Now married:
100.0% (71)Unmarried:
0.0% (0)
Women who did not give birth in the past 12 months Now married:
53.7% (724)Unmarried:
46.3% (624)
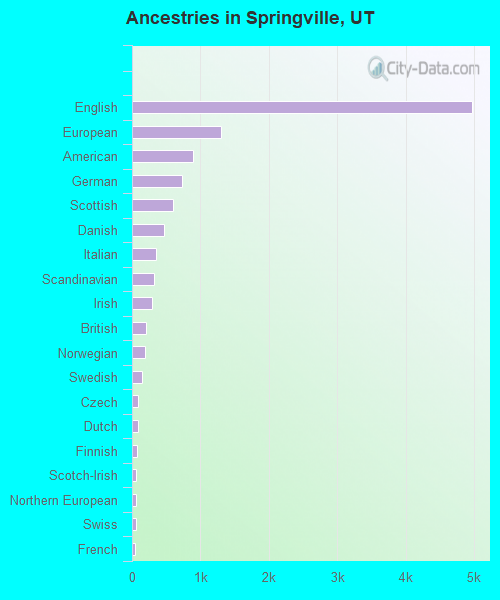
Ancestries in Springville
4,971 27.9% English1,301 7.3% European893 5.0% American732 4.1% German597 3.3% Scottish466 2.6% Danish354 2.0% Italian319 1.8% Scandinavian287 1.6% Irish203 1.1% British192 1.1% Norwegian146 0.8% Swedish92 0.5% Czech89 0.5% Dutch75 0.4% Finnish61 0.3% Scotch-Irish58 0.3% Northern European56 0.3% Swiss49 0.3% French44 0.2% Welsh39 0.2% Polish29 0.2% Ukrainian18 0.1% Belgian14 0.08% Greek14 0.08% Portuguese13 0.07% French Canadian12 0.07% Basque11 0.06% Canadian11 0.06% Slovak10 0.06% Brazilian7 0.04% Armenian7 0.04% Austrian5 0.03% Croatian5 0.03% Yugoslavian3 0.02% Russian1 0.01% Arab
Geographical mobility in Springville Same house 1 year ago 25,935 85.5% White (Caucasian)131 100.0% Black or African American121 82.9% American Indian / Alaska Native135 48.4% Asian301 73.4% Native Hawaiian / Pacific Islander2,413 89.2% Other race2,247 88.7% Two or more races24,689 86.2% White alone, not Hispanic / Latino4,992 82.2% Hispanic or LatinoMoved within same county 2,342 7.7% White / Caucasian10 7.0% American Indian / Alaska Native36 13.1% Asian133 32.3% Native Hawaiian / Pacific Islander58 2.2% Other race41 1.6% Two or more races2,023 7.1% White alone, not Hispanic / Latino578 9.5% Hispanic or LatinoMoved within same state 651 2.1% White / Caucasian203 72.8% Asian25 0.9% Other race62 2.5% Two or more races547 1.9% White alone, not Hispanic / Latino206 3.4% Hispanic or LatinoMoved from different state 1,382 4.6% White / Caucasian15 10.4% American Indian / Alaska Native168 6.2% Other race147 5.8% Two or more races1,431 5.0% White alone, not Hispanic / Latino168 2.8% Hispanic or LatinoMoved from abroad 56 0.2% White12 0.4% Other race13 0.0% White alone, not Hispanic / Latino114 1.9% Hispanic or Latino
Children Nativity (place of birth) in Springville
Children under 6 years - Living with two parents Both parents native 3,466 100.0% NativeBoth parents foreign-born 105 100.0% NativeOne native, one foreign-born parent 287 100.0% NativeChildren under 6 years - Living with one parent Native parent 611 100.0% NativeChildren 6 to 17 years - Living with two parents Both parents native 5,468 99.4% Native34 0.6% Foreign-bornBoth parents foreign-born 429 96.7% Native15 3.3% Foreign-bornOne native, one foreign-born parent 978 96.3% Native38 3.7% Foreign-bornChildren 6 to 17 years - Living with one parent Native parent 1,185 100.0% NativeForeign-born parent 111 51.2% Native106 48.8% Foreign-born
Grandparents responsible for own grandchildren in Springville
Grandparents (30 to 59 years) White / Caucasian 18 20.3% Responsible for grandchildren70 79.7% Not responsible for grandchildrenAmerican Indian / Alaska Native 3 100.0% Not responsible for grandchildrenWhite alone, not Hispanic / Latino 16 16.6% Responsible for grandchildren81 83.4% Not responsible for grandchildrenHispanic or Latino 3 100.0% Responsible for grandchildrenGrandparents (60 years and over) White / Caucasian 136 32.9% Responsible for grandchildren279 67.1% Not responsible for grandchildrenWhite alone, not Hispanic / Latino 140 32.2% Responsible for grandchildren295 67.8% Not responsible for grandchildrenHispanic or Latino 49 100.0% Not responsible for grandchildren