Races in St. Andrews, South Carolina (SC) Detailed Stats
Data:
Races - White alone (%)
Races - White alone (% change since 2000)
Races - Black alone (%)
Races - Black alone (% change since 2000)
Races - American Indian alone (%)
Races - American Indian alone (% change since 2000)
Races - Asian alone (%)
Races - Asian alone (% change since 2000)
Races - Hispanic (%)
Races - Hispanic (% change since 2000)
Races - Native Hawaiian and Other Pacific Islander alone (%)
Races - Native Hawaiian and Other Pacific Islander alone (% change since 2000)
Races - Two or more races(%)
Races - Two or more races(% change since 2000)
Races - Other race alone (%)
Races - Other race alone (% change since 2000)
Racial diversity
Place of birth - Born in state of residence (%)
Place of birth - Born in state of residence (%) - White
Place of birth - Born in state of residence (%) - Black or African American
Place of birth - Born in state of residence (%) - Asian
Place of birth - Born in state of residence (%) - Hispanic or Latino
Place of birth - Born in state of residence (%) - American Indian and Alaska Native
Place of birth - Born in state of residence (%) - Multirace
Place of birth - Born in state of residence (%) - Other Race
Place of birth - Born in other state (%)
Place of birth - Born in other state (%) - White
Place of birth - Born in other state (%) - Black or African American
Place of birth - Born in other state (%) - Asian
Place of birth - Born in other state (%) - Hispanic or Latino
Place of birth - Born in other state (%) - American Indian and Alaska Native
Place of birth - Born in other state (%) - Multirace
Place of birth - Born in other state (%) - Other Race
Place of birth - Native, outside of US (%)
Place of birth - Native, outside of US (%) - White
Place of birth - Native, outside of US (%) - Black or African American
Place of birth - Native, outside of US (%) - Asian
Place of birth - Native, outside of US (%) - Hispanic or Latino
Place of birth - Native, outside of US (%) - American Indian and Alaska Native
Place of birth - Native, outside of US (%) - Multirace
Place of birth - Native, outside of US (%) - Other Race
Place of birth - Foreign born (%)
Place of birth - Foreign born (%) - White
Place of birth - Foreign born (%) - Black or African American
Place of birth - Foreign born (%) - Asian
Place of birth - Foreign born (%) - Hispanic or Latino
Place of birth - Foreign born (%) - American Indian and Alaska Native
Place of birth - Foreign born (%) - Multirace
Place of birth - Foreign born (%) - Other Race
Residents speaking English at home (%)
Residents speaking English at home - Born in the United States (%)
Residents speaking English at home - Native, born elsewhere (%)
Residents speaking English at home - Foreign born (%)
Residents speaking Spanish at home (%)
Residents speaking Spanish at home - Born in the United States (%)
Residents speaking Spanish at home - Native, born elsewhere (%)
Residents speaking Spanish at home - Foreign born (%)
Residents speaking other language at home (%)
Residents speaking other language at home - Born in the United States (%)
Residents speaking other language at home - Native, born elsewhere (%)
Residents speaking other language at home - Foreign born (%)
Marital status - Never married (%)
Marital status - Now married (%)
Marital status - Separated (%)
Marital status - Widowed (%)
Marital status - Divorced (%)
Ancestries Reported - Arab (%)
Ancestries Reported - Czech (%)
Ancestries Reported - Danish (%)
Ancestries Reported - Dutch (%)
Ancestries Reported - English (%)
Ancestries Reported - French (%)
Ancestries Reported - French Canadian (%)
Ancestries Reported - German (%)
Ancestries Reported - Greek (%)
Ancestries Reported - Hungarian (%)
Ancestries Reported - Irish (%)
Ancestries Reported - Italian (%)
Ancestries Reported - Lithuanian (%)
Ancestries Reported - Norwegian (%)
Ancestries Reported - Polish (%)
Ancestries Reported - Portuguese (%)
Ancestries Reported - Russian (%)
Ancestries Reported - Scotch-Irish (%)
Ancestries Reported - Scottish (%)
Ancestries Reported - Slovak (%)
Ancestries Reported - Subsaharan African (%)
Ancestries Reported - Swedish (%)
Ancestries Reported - Swiss (%)
Ancestries Reported - Ukrainian (%)
Ancestries Reported - United States (%)
Ancestries Reported - Welsh (%)
Ancestries Reported - West Indian (%)
Ancestries Reported - Other (%)
Geographical mobility - Same house 1 year ago (%)
Geographical mobility - Same house 1 year ago (%) - White
Geographical mobility - Same house 1 year ago (%) - Black or African American
Geographical mobility - Same house 1 year ago (%) - Asian
Geographical mobility - Same house 1 year ago (%) - Hispanic or Latino
Geographical mobility - Same house 1 year ago (%) - American Indian and Alaska Native
Geographical mobility - Same house 1 year ago (%) - Multirace
Geographical mobility - Same house 1 year ago (%) - Other Race
Geographical mobility - Moved within same county (%)
Geographical mobility - Moved within same county (%) - White
Geographical mobility - Moved within same county (%) - Black or African American
Geographical mobility - Moved within same county (%) - Asian
Geographical mobility - Moved within same county (%) - Hispanic or Latino
Geographical mobility - Moved within same county (%) - American Indian and Alaska Native
Geographical mobility - Moved within same county (%) - Multirace
Geographical mobility - Moved within same county (%) - Other Race
Geographical mobility - Moved from different county within same state (%)
Geographical mobility - Moved from different county within same state (%) - White
Geographical mobility - Moved from different county within same state (%) - Black or African American
Geographical mobility - Moved from different county within same state (%) - Asian
Geographical mobility - Moved from different county within same state (%) - Hispanic or Latino
Geographical mobility - Moved from different county within same state (%) - American Indian and Alaska Native
Geographical mobility - Moved from different county within same state (%) - Multirace
Geographical mobility - Moved from different county within same state (%) - Other Race
Geographical mobility - Moved from different state (%)
Geographical mobility - Moved from different state (%) - White
Geographical mobility - Moved from different state (%) - Black or African American
Geographical mobility - Moved from different state (%) - Asian
Geographical mobility - Moved from different state (%) - Hispanic or Latino
Geographical mobility - Moved from different state (%) - American Indian and Alaska Native
Geographical mobility - Moved from different state (%) - Multirace
Geographical mobility - Moved from different state (%) - Other Race
Geographical mobility - Moved from abroad (%)
Geographical mobility - Moved from abroad (%) - White
Geographical mobility - Moved from abroad (%) - Black or African American
Geographical mobility - Moved from abroad (%) - Asian
Geographical mobility - Moved from abroad (%) - Hispanic or Latino
Geographical mobility - Moved from abroad (%) - American Indian and Alaska Native
Geographical mobility - Moved from abroad (%) - Multirace
Geographical mobility - Moved from abroad (%) - Other Race
Place of birth for the foreign-born population - Ireland (%)
Place of birth for the foreign-born population - Denmark (%)
Place of birth for the foreign-born population - Norway (%)
Place of birth for the foreign-born population - Sweden (%)
Place of birth for the foreign-born population - United Kingdom (%)
Place of birth for the foreign-born population - England (%)
Place of birth for the foreign-born population - Scotland (%)
Place of birth for the foreign-born population - Other Northern Europe (%)
Place of birth for the foreign-born population - Austria (%)
Place of birth for the foreign-born population - Belgium (%)
Place of birth for the foreign-born population - France (%)
Place of birth for the foreign-born population - Germany (%)
Place of birth for the foreign-born population - Netherlands (%)
Place of birth for the foreign-born population - Switzerland (%)
Place of birth for the foreign-born population - Other Western Europe (%)
Place of birth for the foreign-born population - Greece (%)
Place of birth for the foreign-born population - Italy (%)
Place of birth for the foreign-born population - Portugal (%)
Place of birth for the foreign-born population - Spain (%)
Place of birth for the foreign-born population - Other Southern Europe (%)
Place of birth for the foreign-born population - Albania (%)
Place of birth for the foreign-born population - Belarus (%)
Place of birth for the foreign-born population - Bosnia and Herzegovina (%)
Place of birth for the foreign-born population - Bulgaria (%)
Place of birth for the foreign-born population - Croatia (%)
Place of birth for the foreign-born population - Czechoslovakia (%)
Place of birth for the foreign-born population - Hungary (%)
Place of birth for the foreign-born population - Latvia (%)
Place of birth for the foreign-born population - Lithuania (%)
Place of birth for the foreign-born population - North Macedonia (Macedonia) (%)
Place of birth for the foreign-born population - Moldova (%)
Place of birth for the foreign-born population - Poland (%)
Place of birth for the foreign-born population - Romania (%)
Place of birth for the foreign-born population - Russia (%)
Place of birth for the foreign-born population - Serbia (%)
Place of birth for the foreign-born population - Ukraine (%)
Place of birth for the foreign-born population - Other Eastern Europe (%)
Place of birth for the foreign-born population - China (%)
Place of birth for the foreign-born population - Hong Kong (%)
Place of birth for the foreign-born population - Taiwan (%)
Place of birth for the foreign-born population - Japan (%)
Place of birth for the foreign-born population - Korea (%)
Place of birth for the foreign-born population - Other Eastern Asia (%)
Place of birth for the foreign-born population - Afghanistan (%)
Place of birth for the foreign-born population - Bangladesh (%)
Place of birth for the foreign-born population - India (%)
Place of birth for the foreign-born population - Iran (%)
Place of birth for the foreign-born population - Kazakhstan (%)
Place of birth for the foreign-born population - Nepal (%)
Place of birth for the foreign-born population - Pakistan (%)
Place of birth for the foreign-born population - Sri Lanka (%)
Place of birth for the foreign-born population - Uzbekistan (%)
Place of birth for the foreign-born population - Other South Central Asia (%)
Place of birth for the foreign-born population - Burma (%)
Place of birth for the foreign-born population - Cambodia (%)
Place of birth for the foreign-born population - Indonesia (%)
Place of birth for the foreign-born population - Laos (%)
Place of birth for the foreign-born population - Malaysia (%)
Place of birth for the foreign-born population - Philippines (%)
Place of birth for the foreign-born population - Singapore (%)
Place of birth for the foreign-born population - Thailand (%)
Place of birth for the foreign-born population - Vietnam (%)
Place of birth for the foreign-born population - Other South Eastern Asia (%)
Place of birth for the foreign-born population - Armenia (%)
Place of birth for the foreign-born population - Iraq (%)
Place of birth for the foreign-born population - Israel (%)
Place of birth for the foreign-born population - Jordan (%)
Place of birth for the foreign-born population - Kuwait (%)
Place of birth for the foreign-born population - Lebanon (%)
Place of birth for the foreign-born population - Saudi Arabia (%)
Place of birth for the foreign-born population - Syria (%)
Place of birth for the foreign-born population - Turkey (%)
Place of birth for the foreign-born population - Yemen (%)
Place of birth for the foreign-born population - Other Western Asia (%)
Place of birth for the foreign-born population - Eritrea (%)
Place of birth for the foreign-born population - Ethiopia (%)
Place of birth for the foreign-born population - Kenya (%)
Place of birth for the foreign-born population - Somalia (%)
Place of birth for the foreign-born population - Uganda (%)
Place of birth for the foreign-born population - Zimbabwe (%)
Place of birth for the foreign-born population - Other Eastern Africa (%)
Place of birth for the foreign-born population - Cameroon (%)
Place of birth for the foreign-born population - Congo (%)
Place of birth for the foreign-born population - Democratic Republic of Congo (Zaire) (%)
Place of birth for the foreign-born population - Other Middle Africa (%)
Place of birth for the foreign-born population - Egypt (%)
Place of birth for the foreign-born population - Morocco (%)
Place of birth for the foreign-born population - Sudan (%)
Place of birth for the foreign-born population - Other Northern Africa (%)
Place of birth for the foreign-born population - South Africa (%)
Place of birth for the foreign-born population - Other Southern Africa (%)
Place of birth for the foreign-born population - Cabo Verde (%)
Place of birth for the foreign-born population - Ghana (%)
Place of birth for the foreign-born population - Liberia (%)
Place of birth for the foreign-born population - Nigeria (%)
Place of birth for the foreign-born population - Senegal (%)
Place of birth for the foreign-born population - Sierra Leone (%)
Place of birth for the foreign-born population - Other Western Africa (%)
Place of birth for the foreign-born population - Australia (%)
Place of birth for the foreign-born population - New Zealand (%)
Place of birth for the foreign-born population - Fiji (%)
Place of birth for the foreign-born population - Micronesia (%)
Place of birth for the foreign-born population - Bahamas (%)
Place of birth for the foreign-born population - Barbados (%)
Place of birth for the foreign-born population - Cuba (%)
Place of birth for the foreign-born population - Dominica (%)
Place of birth for the foreign-born population - Dominican Republic (%)
Place of birth for the foreign-born population - Grenada (%)
Place of birth for the foreign-born population - Haiti (%)
Place of birth for the foreign-born population - Jamaica (%)
Place of birth for the foreign-born population - St. Vincent and the Grenadines (%)
Place of birth for the foreign-born population - Trinidad and Tobago (%)
Place of birth for the foreign-born population - West Indies (%)
Place of birth for the foreign-born population - Other Caribbean (%)
Place of birth for the foreign-born population - Belize (%)
Place of birth for the foreign-born population - Costa Rica (%)
Place of birth for the foreign-born population - El Salvador (%)
Place of birth for the foreign-born population - Guatemala (%)
Place of birth for the foreign-born population - Honduras (%)
Place of birth for the foreign-born population - Mexico (%)
Place of birth for the foreign-born population - Nicaragua (%)
Place of birth for the foreign-born population - Panama (%)
Place of birth for the foreign-born population - Other Central America (%)
Place of birth for the foreign-born population - Argentina (%)
Place of birth for the foreign-born population - Bolivia (%)
Place of birth for the foreign-born population - Brazil (%)
Place of birth for the foreign-born population - Chile (%)
Place of birth for the foreign-born population - Colombia (%)
Place of birth for the foreign-born population - Ecuador (%)
Place of birth for the foreign-born population - Guyana (%)
Place of birth for the foreign-born population - Peru (%)
Place of birth for the foreign-born population - Uruguay (%)
Place of birth for the foreign-born population - Venezuela (%)
Place of birth for the foreign-born population - Other South America (%)
Place of birth for the foreign-born population - Canada (%)
Place of birth for the foreign-born population - Other Northern America (%)
Place of birth for the foreign-born population - Other (%)
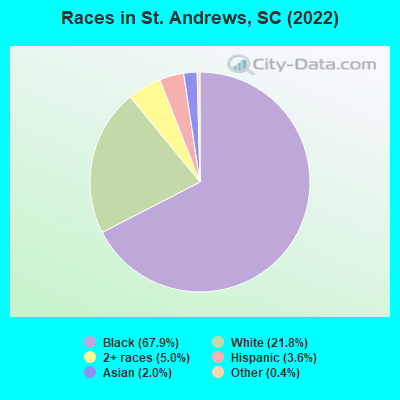
According to 2022 data, the most numerous races in St. Andrews, SC are White alone (4,831 residents), Black alone (15,078 residents), and Hispanic (794 residents). 93.0% of St. Andrews residents speak English at home. 7.5% of St. Andrews, SC residents are foreign-born (2.7% born in Latin America, 2.5% born in Asia, 1.6% born in Africa), which is 33.6% greater than the foreign-born rate of 5.0% across the entire state of South Carolina.
Race distribution in St. Andrews
2000 2022
2,652,291 66.1% White alone 1,178,486 29.4% Black alone 95,076 2.4% Hispanic 35,568 0.9% Asian alone 33,290 0.8% Two or more races 12,765 0.3% American Indian alone 3,266 0.08% Other race alone 1,270 0.03% Native Hawaiian and Other
3,301,739 62.5% White alone 1,313,290 24.9% Black alone 343,783 6.5% Hispanic 190,508 3.6% Two or more races 89,888 1.7% Asian alone 29,390 0.6% Other race alone 12,112 0.2% American Indian alone 1,924 0.04% Native Hawaiian and Other
Income and house value in St. Andrews Median household income in 2022 $53,541 White non-Hispanic householders$39,959 Black householders$62,592 Asian householders$38,082 Some other race householders$41,123 Two or more races householders$46,332 Hispanic or Latino race householdersMedian 2022 house value $153,429 White Non-Hispanic householders$152,885 Black or African American householders $164,116 Asian householders$249,073 Some other race householders$139,481 Two or more races householders$146,002 Hispanic or Latino householders
Median age by race in St. Andrews
38.2 Median age for White residents35.2 39.2 31.7 Median age for Black or African American residents28.4 34.6 -373,815,675.8 Median age for American Indian / Alaska Native residents-364,102,563.7 -712,765,956.7 49.6 Median age for Asian residents37.3 48.7 -698,412,697.7 Median age for Native Hawaiian / Pacific Islander residents-551,574,375.1 -1,016,109,044.8 28.2 Median age for Other race residents29.4 27.8 27.0 Median age for Two or more races residents30.0 29.1 38.2 Median age for White alone residents35.0 39.3 25.9 Median age for Hispanic or Latino residents29.4 21.9
Owner/renter occupied households by race in St. Andrews
House owners and renters - White residents 1,215 46.9% Owner occupied1,374 53.1% Renter occupiedHouse owners and renters - Black or African American residents 1,683 25.1% Owner occupied5,014 74.9% Renter occupiedHouse owners and renters - American Indian / Alaska Native residents 6 100.0% Owner occupiedHouse owners and renters - Asian residents 82 40.0% Owner occupied123 60.0% Renter occupiedHouse owners and renters - Other race residents 96 73.5% Owner occupied35 26.5% Renter occupiedHouse owners and renters - Two or more races residents 161 26.9% Owner occupied437 73.1% Renter occupiedHouse owners and renters - White alone residents 1,215 46.8% Owner occupied1,383 53.2% Renter occupiedHouse owners and renters - Hispanic or Latino residents 112 50.2% Owner occupied111 49.8% Renter occupied
Language usage in St. Andrews
English speakers - Total 93.0% of residents of St. Andrews speak English at home.
2.4% of residents speak Spanish at home 359 74.0% Speak English very well126 26.0% Speak English less than very well4.2% of residents speak other language at home 590 68.7% Speak English very well269 31.3% Speak English less than very well
English speakers - Born in the United States 97.3% of residents of St. Andrews speak English at home.
1.8% of residents speak Spanish at home 128 100.0% Speak English very well0.6% of residents speak other language at home 34 77.3% Speak English very well10 22.7% Speak English less than very well
English speakers - Native, born elsewhere 92.9% of residents of St. Andrews speak English at home.
6.1% of residents speak Spanish at home 19 79.2% Speak English very well5 20.8% Speak English less than very well2.8% of residents speak other language at home 11 100.0% Speak English very well
English speakers - Foreign-born 27.1% of residents of St. Andrews speak English at home.
13.5% of residents speak Spanish at home 91 46.0% Speak English very well107 54.0% Speak English less than very well45.5% of residents speak other language at home 456 68.2% Speak English very well213 31.8% Speak English less than very well
White (Caucasian) - Speak only English Native:
97.4% (4,278)Foreign-born:
34.1% (68)
White (Caucasian) - Speak another language Native:
2.7% (117)Foreign-born:
63.3% (126)
Black or African American - Speak only English Native:
99.2% (13,481)Foreign-born:
36.9% (140)
Black or African American - Speak another language Native:
1.0% (130)Foreign-born:
69.5% (264)
Asian - Speak only English Native:
36.9% (9)Foreign-born:
22.2% (87)
Asian - Speak another language Native:
65.0% (16)Foreign-born:
65.2% (255)
Other race - Speak only English Native:
52.8% (121)Foreign-born:
6.0% (9)
Other race - Speak another language Native:
47.6% (109)Foreign-born:
92.7% (136)
Two or more races - Speak only English Native:
96.4% (942)Foreign-born:
11.8% (30)
Two or more races - Speak another language Native:
4.6% (45)Foreign-born:
83.3% (210)
White alone - Speak only English Native:
97.5% (4,269)Foreign-born:
42.9% (77)
White alone - Speak another language Native:
2.4% (104)Foreign-born:
57.2% (103)
Hispanic or Latino - Speak only English Native:
57.8% (231)Foreign-born:
7.4% (17)
Hispanic or Latino - Speak another language Native:
41.9% (168)Foreign-born:
99.2% (225)
Foreign-born residents in St. Andrews 1,672 residents are foreign born (2.7% Latin America , 2.5% Asia , 1.6% Africa ).
This city:
7.5%South Carolina:
5.3%
Marital status for residents in St. Andrews Marital status - White (Caucasian) population 15 years and over
Males 41.2% Never married38.4% Now married4.3% Separated1.7% Widowed14.4% DivorcedFemales 35.0% Never married36.9% Now married0.9% Separated10.8% Widowed16.4% DivorcedWomen who gave birth in the past 12 months Now married:
0.0% (0)Unmarried:
100.0% (11)
Women who did not give birth in the past 12 months Now married:
40.1% (521)Unmarried:
59.9% (778)
Marital status - Black or African American population 15 years and over
Males 57.0% Never married24.2% Now married4.5% Separated3.5% Widowed10.8% DivorcedFemales 58.6% Never married18.1% Now married1.7% Separated4.3% Widowed17.3% DivorcedWomen who gave birth in the past 12 months Now married:
28.8% (118)Unmarried:
71.2% (292)
Women who did not give birth in the past 12 months Now married:
14.4% (568)Unmarried:
85.6% (3,373)
Marital status - Asian population 15 years and over
Males 57.6% Never married42.4% Now married0.0% Separated0.0% Widowed0.0% DivorcedFemales 24.6% Never married54.5% Now married17.4% Separated0.0% Widowed3.4% DivorcedWomen who gave birth in the past 12 months Now married:
0.0% (0)Unmarried:
100.0% (65)
Women who did not give birth in the past 12 months Now married:
85.0% (194)Unmarried:
15.0% (34)
Marital status - Other race population 15 years and over
Males 46.8% Never married40.3% Now married0.0% Separated0.0% Widowed12.9% DivorcedFemales 51.4% Never married35.5% Now married0.0% Separated5.8% Widowed7.2% DivorcedWomen who did not give birth in the past 12 months Now married:
47.1% (60)Unmarried:
52.9% (67)
Marital status - Two or more races population 15 years and over
Males 57.0% Never married20.1% Now married8.4% Separated0.0% Widowed14.5% DivorcedFemales 44.1% Never married36.8% Now married0.0% Separated10.4% Widowed8.7% DivorcedWomen who gave birth in the past 12 months Now married:
100.0% (145)Unmarried:
0.0% (0)
Women who did not give birth in the past 12 months Now married:
11.7% (35)Unmarried:
88.3% (264)
Marital status - White alone, not Hispanic / Latino population 15 years and over
Males 41.1% Never married38.3% Now married4.4% Separated1.8% Widowed14.5% DivorcedFemales 34.9% Never married36.7% Now married0.9% Separated11.0% Widowed16.6% DivorcedWomen who gave birth in the past 12 months Now married:
0.0% (0)Unmarried:
100.0% (11)
Women who did not give birth in the past 12 months Now married:
39.7% (519)Unmarried:
60.3% (788)
Marital status - Hispanic or Latino population 15 years and over
Males 47.0% Never married25.3% Now married16.1% Separated0.0% Widowed11.5% DivorcedFemales 43.5% Never married40.7% Now married0.0% Separated3.8% Widowed12.0% DivorcedWomen who did not give birth in the past 12 months Now married:
52.1% (94)Unmarried:
47.9% (86)
Ancestries in St. Andrews
432 3.3% American367 2.8% Jamaican364 2.8% German347 2.7% African332 2.5% English179 1.4% Moroccan153 1.2% Irish121 0.9% Ghanaian110 0.8% Iraqi95 0.7% Iranian76 0.6% Ukrainian70 0.5% Eastern European62 0.5% Scotch-Irish54 0.4% Scottish54 0.4% Welsh53 0.4% European53 0.4% French47 0.4% Polish46 0.4% Norwegian43 0.3% Italian41 0.3% British24 0.2% Ethiopian19 0.1% Canadian18 0.1% Trinidadian and Tobagonian13 0.10% Nigerian12 0.09% Latvian12 0.09% Russian7 0.05% Pennsylvania German7 0.05% U.S. Virgin Islander6 0.05% Swedish
Children Nativity (place of birth) in St. Andrews
Children under 6 years - Living with two parents Both parents native 517 100.0% NativeBoth parents foreign-born 112 64.7% Native61 35.3% Foreign-bornOne native, one foreign-born parent 68 100.0% NativeChildren under 6 years - Living with one parent Native parent 1,027 100.0% NativeForeign-born parent 22 46.8% Native25 53.2% Foreign-bornChildren 6 to 17 years - Living with two parents Both parents native 491 100.0% NativeBoth parents foreign-born 76 64.2% Native42 35.8% Foreign-bornOne native, one foreign-born parent 17 100.0% NativeChildren 6 to 17 years - Living with one parent Native parent 2,092 98.4% Native34 1.6% Foreign-bornForeign-born parent 203 74.4% Native70 25.6% Foreign-born
Grandparents responsible for own grandchildren in St. Andrews
Grandparents (30 to 59 years) White / Caucasian 10 100.0% Not responsible for grandchildrenBlack or African American 37 20.6% Responsible for grandchildren142 79.4% Not responsible for grandchildrenWhite alone, not Hispanic / Latino 10 100.0% Not responsible for grandchildrenGrandparents (60 years and over) White / Caucasian 18 42.9% Responsible for grandchildren24 57.1% Not responsible for grandchildrenBlack or African American 21 18.7% Responsible for grandchildren91 81.3% Not responsible for grandchildrenWhite alone, not Hispanic / Latino 18 42.5% Responsible for grandchildren24 57.5% Not responsible for grandchildren