Races in St. Anthony, Minnesota (MN) Detailed Stats
Data:
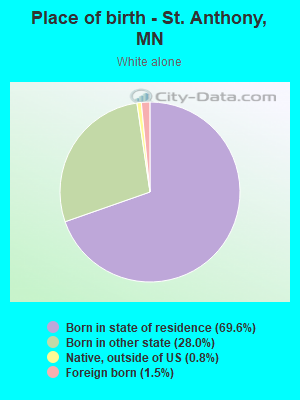
Races - White alone (%)
Races - White alone (% change since 2000)
Races - Black alone (%)
Races - Black alone (% change since 2000)
Races - American Indian alone (%)
Races - American Indian alone (% change since 2000)
Races - Asian alone (%)
Races - Asian alone (% change since 2000)
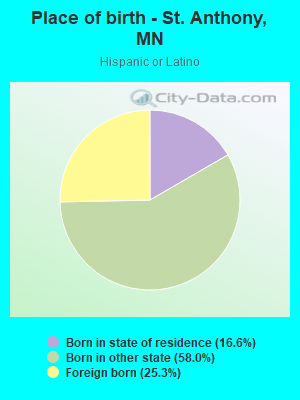
Races - Hispanic (%)
Races - Hispanic (% change since 2000)
Races - Native Hawaiian and Other Pacific Islander alone (%)
Races - Native Hawaiian and Other Pacific Islander alone (% change since 2000)
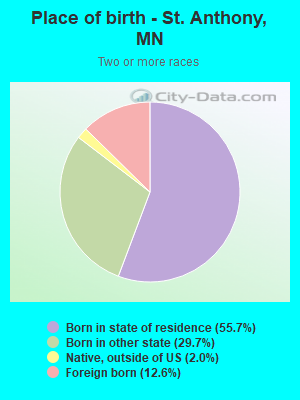
Races - Two or more races(%)
Races - Two or more races(% change since 2000)
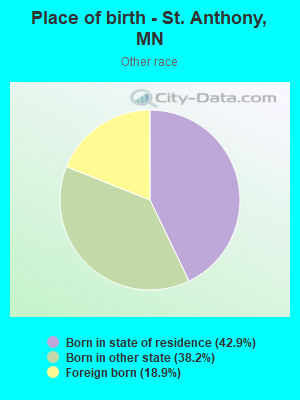
Races - Other race alone (%)
Races - Other race alone (% change since 2000)
Racial diversity
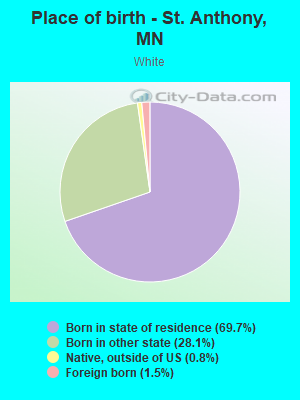
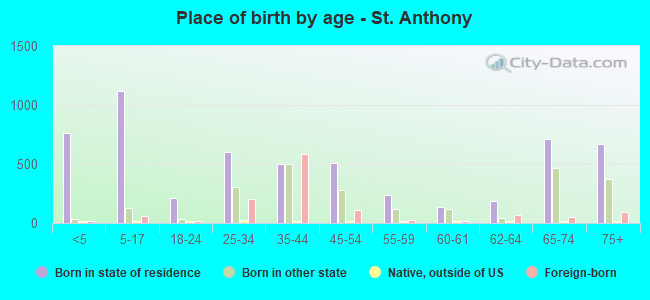
Place of birth - Born in state of residence (%)
Place of birth - Born in state of residence (%) - White
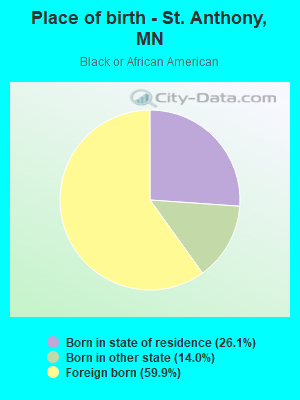
Place of birth - Born in state of residence (%) - Black or African American
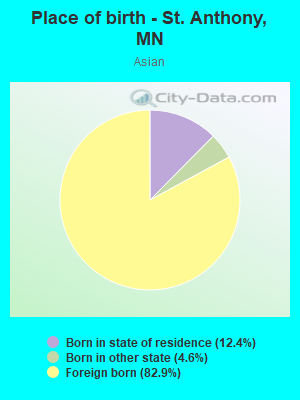
Place of birth - Born in state of residence (%) - Asian
Place of birth - Born in state of residence (%) - Hispanic or Latino
Place of birth - Born in state of residence (%) - American Indian and Alaska Native
Place of birth - Born in state of residence (%) - Multirace
Place of birth - Born in state of residence (%) - Other Race
Place of birth - Born in other state (%)
Place of birth - Born in other state (%) - White
Place of birth - Born in other state (%) - Black or African American
Place of birth - Born in other state (%) - Asian
Place of birth - Born in other state (%) - Hispanic or Latino
Place of birth - Born in other state (%) - American Indian and Alaska Native
Place of birth - Born in other state (%) - Multirace
Place of birth - Born in other state (%) - Other Race
Place of birth - Native, outside of US (%)
Place of birth - Native, outside of US (%) - White
Place of birth - Native, outside of US (%) - Black or African American
Place of birth - Native, outside of US (%) - Asian
Place of birth - Native, outside of US (%) - Hispanic or Latino
Place of birth - Native, outside of US (%) - American Indian and Alaska Native
Place of birth - Native, outside of US (%) - Multirace
Place of birth - Native, outside of US (%) - Other Race
Place of birth - Foreign born (%)
Place of birth - Foreign born (%) - White
Place of birth - Foreign born (%) - Black or African American
Place of birth - Foreign born (%) - Asian
Place of birth - Foreign born (%) - Hispanic or Latino
Place of birth - Foreign born (%) - American Indian and Alaska Native
Place of birth - Foreign born (%) - Multirace
Place of birth - Foreign born (%) - Other Race
Residents speaking English at home (%)
Residents speaking English at home - Born in the United States (%)
Residents speaking English at home - Native, born elsewhere (%)
Residents speaking English at home - Foreign born (%)
Residents speaking Spanish at home (%)
Residents speaking Spanish at home - Born in the United States (%)
Residents speaking Spanish at home - Native, born elsewhere (%)
Residents speaking Spanish at home - Foreign born (%)
Residents speaking other language at home (%)
Residents speaking other language at home - Born in the United States (%)
Residents speaking other language at home - Native, born elsewhere (%)
Residents speaking other language at home - Foreign born (%)
Marital status - Never married (%)
Marital status - Now married (%)
Marital status - Separated (%)
Marital status - Widowed (%)
Marital status - Divorced (%)
Ancestries Reported - Arab (%)
Ancestries Reported - Czech (%)
Ancestries Reported - Danish (%)
Ancestries Reported - Dutch (%)
Ancestries Reported - English (%)
Ancestries Reported - French (%)
Ancestries Reported - French Canadian (%)
Ancestries Reported - German (%)
Ancestries Reported - Greek (%)
Ancestries Reported - Hungarian (%)
Ancestries Reported - Irish (%)
Ancestries Reported - Italian (%)
Ancestries Reported - Lithuanian (%)
Ancestries Reported - Norwegian (%)
Ancestries Reported - Polish (%)
Ancestries Reported - Portuguese (%)
Ancestries Reported - Russian (%)
Ancestries Reported - Scotch-Irish (%)
Ancestries Reported - Scottish (%)
Ancestries Reported - Slovak (%)
Ancestries Reported - Subsaharan African (%)
Ancestries Reported - Swedish (%)
Ancestries Reported - Swiss (%)
Ancestries Reported - Ukrainian (%)
Ancestries Reported - United States (%)
Ancestries Reported - Welsh (%)
Ancestries Reported - West Indian (%)
Ancestries Reported - Other (%)
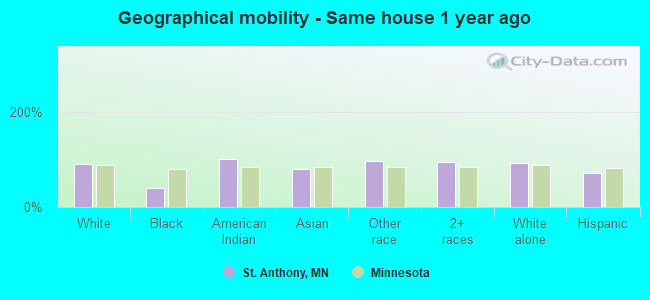
Geographical mobility - Same house 1 year ago (%)
Geographical mobility - Same house 1 year ago (%) - White
Geographical mobility - Same house 1 year ago (%) - Black or African American
Geographical mobility - Same house 1 year ago (%) - Asian
Geographical mobility - Same house 1 year ago (%) - Hispanic or Latino
Geographical mobility - Same house 1 year ago (%) - American Indian and Alaska Native
Geographical mobility - Same house 1 year ago (%) - Multirace
Geographical mobility - Same house 1 year ago (%) - Other Race
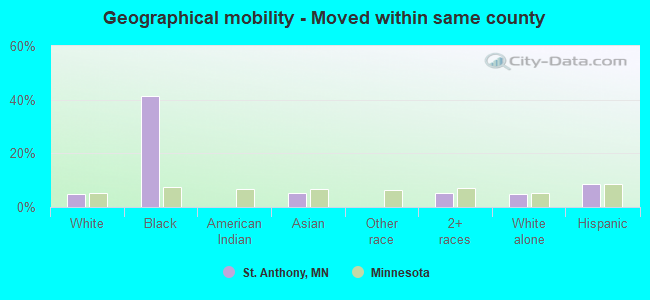
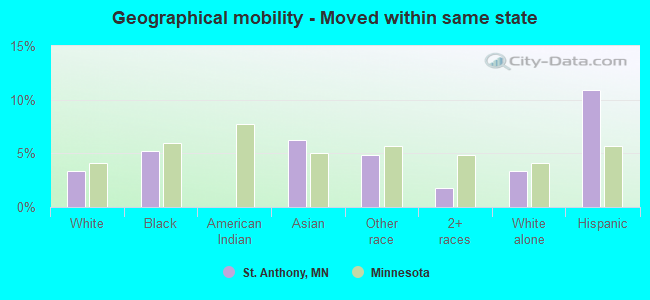
Geographical mobility - Moved within same county (%)
Geographical mobility - Moved within same county (%) - White
Geographical mobility - Moved within same county (%) - Black or African American
Geographical mobility - Moved within same county (%) - Asian
Geographical mobility - Moved within same county (%) - Hispanic or Latino
Geographical mobility - Moved within same county (%) - American Indian and Alaska Native
Geographical mobility - Moved within same county (%) - Multirace
Geographical mobility - Moved within same county (%) - Other Race
Geographical mobility - Moved from different county within same state (%)
Geographical mobility - Moved from different county within same state (%) - White
Geographical mobility - Moved from different county within same state (%) - Black or African American
Geographical mobility - Moved from different county within same state (%) - Asian
Geographical mobility - Moved from different county within same state (%) - Hispanic or Latino
Geographical mobility - Moved from different county within same state (%) - American Indian and Alaska Native
Geographical mobility - Moved from different county within same state (%) - Multirace
Geographical mobility - Moved from different county within same state (%) - Other Race
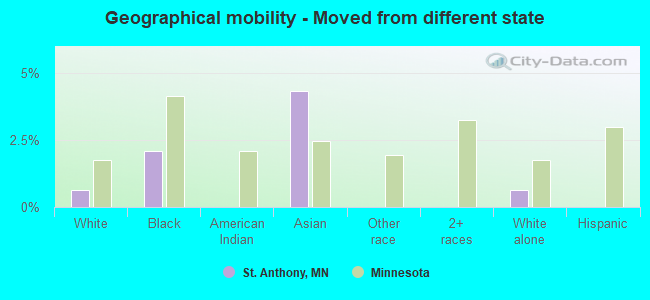
Geographical mobility - Moved from different state (%)
Geographical mobility - Moved from different state (%) - White
Geographical mobility - Moved from different state (%) - Black or African American
Geographical mobility - Moved from different state (%) - Asian
Geographical mobility - Moved from different state (%) - Hispanic or Latino
Geographical mobility - Moved from different state (%) - American Indian and Alaska Native
Geographical mobility - Moved from different state (%) - Multirace
Geographical mobility - Moved from different state (%) - Other Race
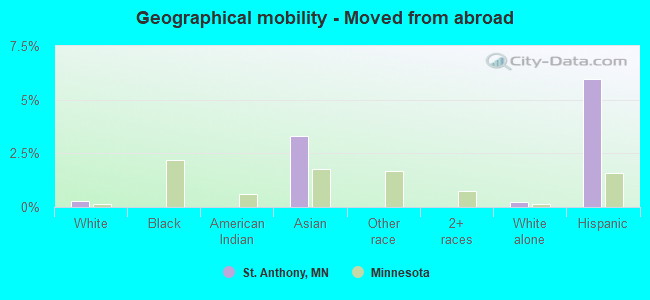
Geographical mobility - Moved from abroad (%)
Geographical mobility - Moved from abroad (%) - White
Geographical mobility - Moved from abroad (%) - Black or African American
Geographical mobility - Moved from abroad (%) - Asian
Geographical mobility - Moved from abroad (%) - Hispanic or Latino
Geographical mobility - Moved from abroad (%) - American Indian and Alaska Native
Geographical mobility - Moved from abroad (%) - Multirace
Geographical mobility - Moved from abroad (%) - Other Race
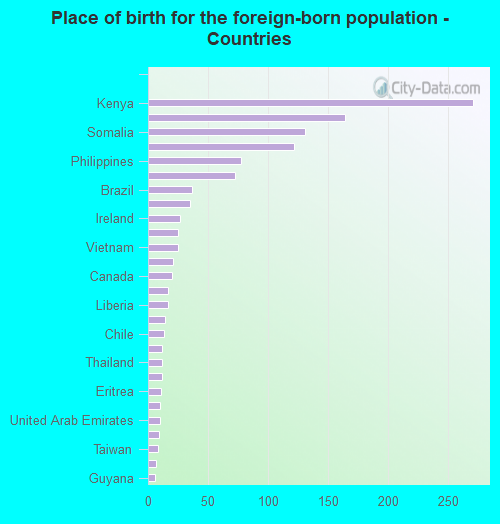
Place of birth for the foreign-born population - Ireland (%)
Place of birth for the foreign-born population - Denmark (%)
Place of birth for the foreign-born population - Norway (%)
Place of birth for the foreign-born population - Sweden (%)
Place of birth for the foreign-born population - United Kingdom (%)
Place of birth for the foreign-born population - England (%)
Place of birth for the foreign-born population - Scotland (%)
Place of birth for the foreign-born population - Other Northern Europe (%)
Place of birth for the foreign-born population - Austria (%)
Place of birth for the foreign-born population - Belgium (%)
Place of birth for the foreign-born population - France (%)
Place of birth for the foreign-born population - Germany (%)
Place of birth for the foreign-born population - Netherlands (%)
Place of birth for the foreign-born population - Switzerland (%)
Place of birth for the foreign-born population - Other Western Europe (%)
Place of birth for the foreign-born population - Greece (%)
Place of birth for the foreign-born population - Italy (%)
Place of birth for the foreign-born population - Portugal (%)
Place of birth for the foreign-born population - Spain (%)
Place of birth for the foreign-born population - Other Southern Europe (%)
Place of birth for the foreign-born population - Albania (%)
Place of birth for the foreign-born population - Belarus (%)
Place of birth for the foreign-born population - Bosnia and Herzegovina (%)
Place of birth for the foreign-born population - Bulgaria (%)
Place of birth for the foreign-born population - Croatia (%)
Place of birth for the foreign-born population - Czechoslovakia (%)
Place of birth for the foreign-born population - Hungary (%)
Place of birth for the foreign-born population - Latvia (%)
Place of birth for the foreign-born population - Lithuania (%)
Place of birth for the foreign-born population - North Macedonia (Macedonia) (%)
Place of birth for the foreign-born population - Moldova (%)
Place of birth for the foreign-born population - Poland (%)
Place of birth for the foreign-born population - Romania (%)
Place of birth for the foreign-born population - Russia (%)
Place of birth for the foreign-born population - Serbia (%)
Place of birth for the foreign-born population - Ukraine (%)
Place of birth for the foreign-born population - Other Eastern Europe (%)
Place of birth for the foreign-born population - China (%)
Place of birth for the foreign-born population - Hong Kong (%)
Place of birth for the foreign-born population - Taiwan (%)
Place of birth for the foreign-born population - Japan (%)
Place of birth for the foreign-born population - Korea (%)
Place of birth for the foreign-born population - Other Eastern Asia (%)
Place of birth for the foreign-born population - Afghanistan (%)
Place of birth for the foreign-born population - Bangladesh (%)
Place of birth for the foreign-born population - India (%)
Place of birth for the foreign-born population - Iran (%)
Place of birth for the foreign-born population - Kazakhstan (%)
Place of birth for the foreign-born population - Nepal (%)
Place of birth for the foreign-born population - Pakistan (%)
Place of birth for the foreign-born population - Sri Lanka (%)
Place of birth for the foreign-born population - Uzbekistan (%)
Place of birth for the foreign-born population - Other South Central Asia (%)
Place of birth for the foreign-born population - Burma (%)
Place of birth for the foreign-born population - Cambodia (%)
Place of birth for the foreign-born population - Indonesia (%)
Place of birth for the foreign-born population - Laos (%)
Place of birth for the foreign-born population - Malaysia (%)
Place of birth for the foreign-born population - Philippines (%)
Place of birth for the foreign-born population - Singapore (%)
Place of birth for the foreign-born population - Thailand (%)
Place of birth for the foreign-born population - Vietnam (%)
Place of birth for the foreign-born population - Other South Eastern Asia (%)
Place of birth for the foreign-born population - Armenia (%)
Place of birth for the foreign-born population - Iraq (%)
Place of birth for the foreign-born population - Israel (%)
Place of birth for the foreign-born population - Jordan (%)
Place of birth for the foreign-born population - Kuwait (%)
Place of birth for the foreign-born population - Lebanon (%)
Place of birth for the foreign-born population - Saudi Arabia (%)
Place of birth for the foreign-born population - Syria (%)
Place of birth for the foreign-born population - Turkey (%)
Place of birth for the foreign-born population - Yemen (%)
Place of birth for the foreign-born population - Other Western Asia (%)
Place of birth for the foreign-born population - Eritrea (%)
Place of birth for the foreign-born population - Ethiopia (%)
Place of birth for the foreign-born population - Kenya (%)
Place of birth for the foreign-born population - Somalia (%)
Place of birth for the foreign-born population - Uganda (%)
Place of birth for the foreign-born population - Zimbabwe (%)
Place of birth for the foreign-born population - Other Eastern Africa (%)
Place of birth for the foreign-born population - Cameroon (%)
Place of birth for the foreign-born population - Congo (%)
Place of birth for the foreign-born population - Democratic Republic of Congo (Zaire) (%)
Place of birth for the foreign-born population - Other Middle Africa (%)
Place of birth for the foreign-born population - Egypt (%)
Place of birth for the foreign-born population - Morocco (%)
Place of birth for the foreign-born population - Sudan (%)
Place of birth for the foreign-born population - Other Northern Africa (%)
Place of birth for the foreign-born population - South Africa (%)
Place of birth for the foreign-born population - Other Southern Africa (%)
Place of birth for the foreign-born population - Cabo Verde (%)
Place of birth for the foreign-born population - Ghana (%)
Place of birth for the foreign-born population - Liberia (%)
Place of birth for the foreign-born population - Nigeria (%)
Place of birth for the foreign-born population - Senegal (%)
Place of birth for the foreign-born population - Sierra Leone (%)
Place of birth for the foreign-born population - Other Western Africa (%)
Place of birth for the foreign-born population - Australia (%)
Place of birth for the foreign-born population - New Zealand (%)
Place of birth for the foreign-born population - Fiji (%)
Place of birth for the foreign-born population - Micronesia (%)
Place of birth for the foreign-born population - Bahamas (%)
Place of birth for the foreign-born population - Barbados (%)
Place of birth for the foreign-born population - Cuba (%)
Place of birth for the foreign-born population - Dominica (%)
Place of birth for the foreign-born population - Dominican Republic (%)
Place of birth for the foreign-born population - Grenada (%)
Place of birth for the foreign-born population - Haiti (%)
Place of birth for the foreign-born population - Jamaica (%)
Place of birth for the foreign-born population - St. Vincent and the Grenadines (%)
Place of birth for the foreign-born population - Trinidad and Tobago (%)
Place of birth for the foreign-born population - West Indies (%)
Place of birth for the foreign-born population - Other Caribbean (%)
Place of birth for the foreign-born population - Belize (%)
Place of birth for the foreign-born population - Costa Rica (%)
Place of birth for the foreign-born population - El Salvador (%)
Place of birth for the foreign-born population - Guatemala (%)
Place of birth for the foreign-born population - Honduras (%)
Place of birth for the foreign-born population - Mexico (%)
Place of birth for the foreign-born population - Nicaragua (%)
Place of birth for the foreign-born population - Panama (%)
Place of birth for the foreign-born population - Other Central America (%)
Place of birth for the foreign-born population - Argentina (%)
Place of birth for the foreign-born population - Bolivia (%)
Place of birth for the foreign-born population - Brazil (%)
Place of birth for the foreign-born population - Chile (%)
Place of birth for the foreign-born population - Colombia (%)
Place of birth for the foreign-born population - Ecuador (%)
Place of birth for the foreign-born population - Guyana (%)
Place of birth for the foreign-born population - Peru (%)
Place of birth for the foreign-born population - Uruguay (%)
Place of birth for the foreign-born population - Venezuela (%)
Place of birth for the foreign-born population - Other South America (%)
Place of birth for the foreign-born population - Canada (%)
Place of birth for the foreign-born population - Other Northern America (%)
Place of birth for the foreign-born population - Other (%)
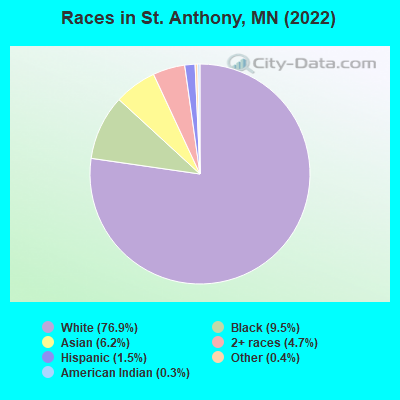
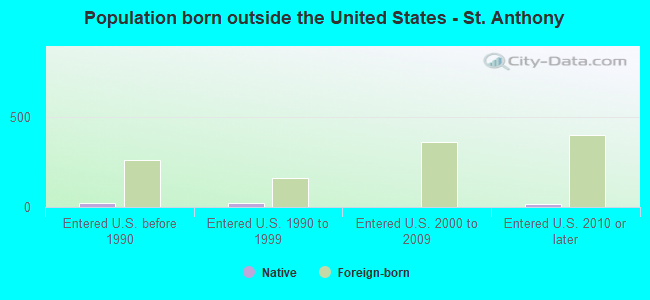
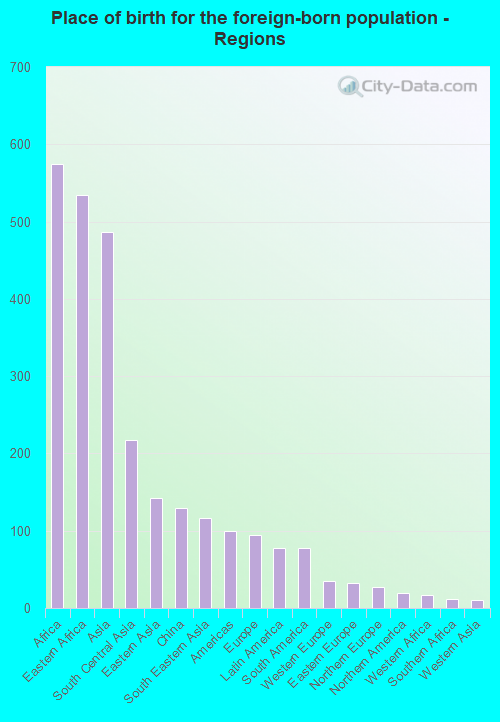
According to 2022 data, the most numerous races in St. Anthony, MN are White alone (7,118 residents), Black alone (875 residents), and Hispanic (135 residents). 86.6% of St. Anthony residents speak English at home. 13.6% of St. Anthony, MN residents are foreign-born (6.0% born in Africa, 5.0% born in Asia), which is 41.1% greater than the foreign-born rate of 8.0% across the entire state of Minnesota.
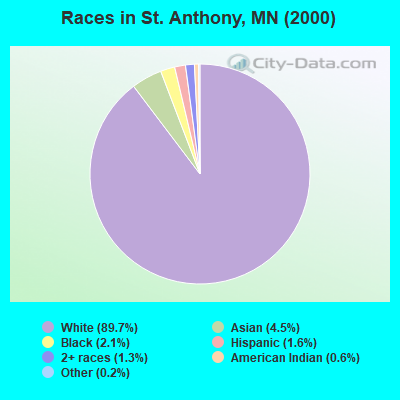
Race distribution in St. Anthony
2000 2022
4,337,143 88.2% White alone 168,813 3.4% Black alone 143,382 2.9% Hispanic 141,083 2.9% Asian alone 70,304 1.4% Two or more races 52,009 1.1% American Indian alone 5,031 0.1% Other race alone 1,714 0.03% Native Hawaiian and Other
4,356,347 76.2% White alone 395,179 6.9% Black alone 333,830 5.8% Hispanic 294,800 5.2% Asian alone 259,649 4.5% Two or more races 42,125 0.7% American Indian alone 32,976 0.6% Other race alone 2,278 0.04% Native Hawaiian and Other
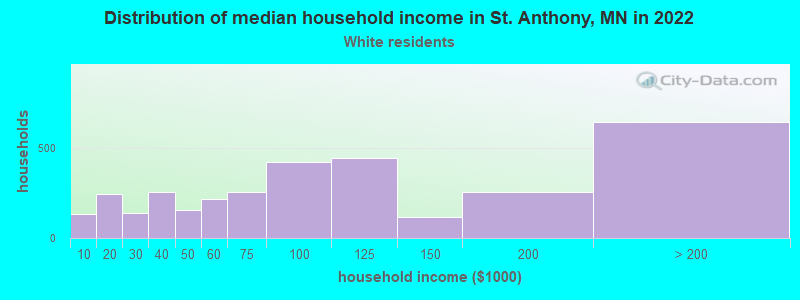
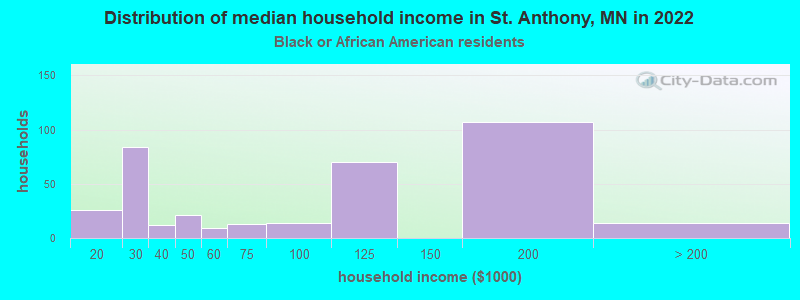
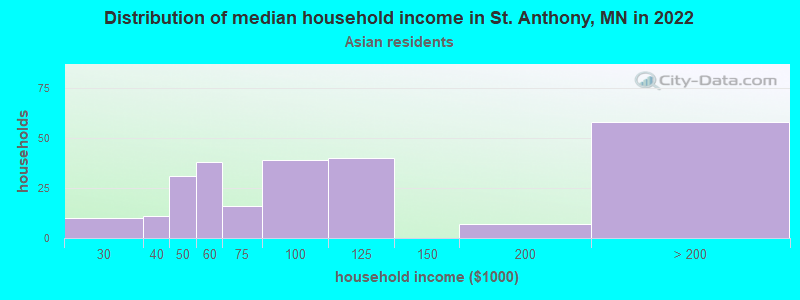
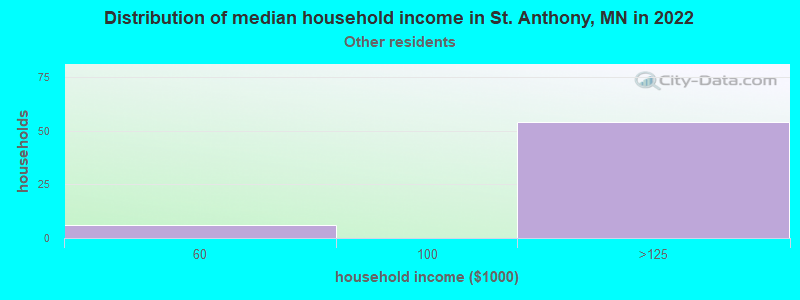
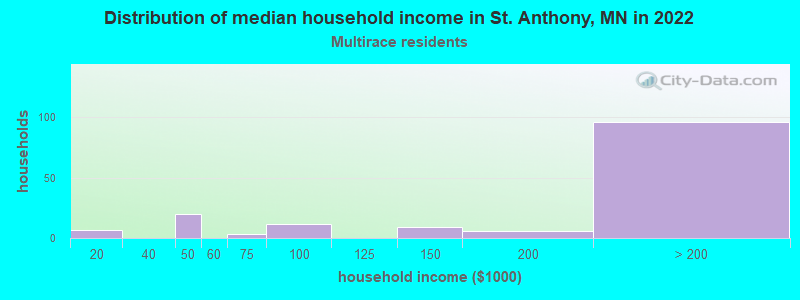
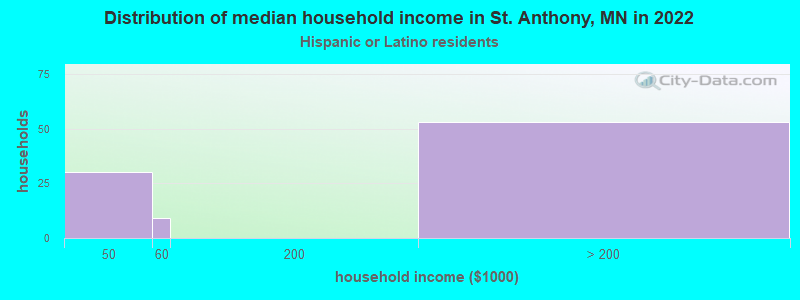
Income and house value in St. Anthony Median household income in 2022 $87,543 White non-Hispanic householders$103,709 Black householders$75,406 Asian householdersover $200,000 Two or more races householdersover $200,000 Hispanic or Latino race householdersMedian 2022 house value $390,726 White Non-Hispanic householders$343,763 American Indian or Alaska Native householders $331,151 Asian householders$368,989 Hispanic or Latino householders
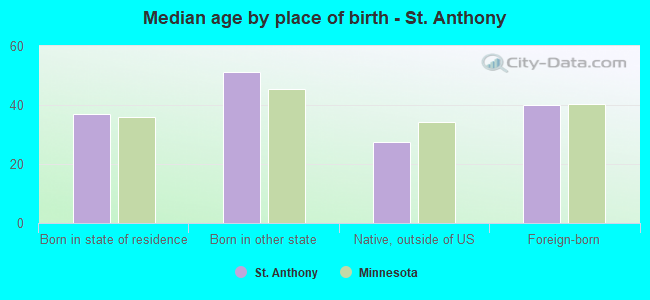
Median age by race in St. Anthony
47.4 Median age for White residents44.9 49.4 37.3 Median age for Black or African American residents37.7 34.0 -624,444,443.8 Median age for American Indian / Alaska Native residents-619,552,414.0 -643,749,999.4 37.1 Median age for Asian residents36.4 37.5 -790,303,029.5 Median age for Native Hawaiian / Pacific Islander residents-856,799,036.4 -365,948,037.2 86.3 Median age for Other race residents97.5 -706,616,728.4 27.8 Median age for Two or more races residents33.4 13.0 47.1 Median age for White alone residents44.8 48.9 43.7 Median age for Hispanic or Latino residents43.7 68.2
Owner/renter occupied households by race in St. Anthony
House owners and renters - White residents 2,196 67.0% Owner occupied1,082 33.0% Renter occupiedHouse owners and renters - Black or African American residents 342 100.0% Renter occupiedHouse owners and renters - American Indian / Alaska Native residents 7 100.0% Renter occupiedHouse owners and renters - Asian residents 106 40.7% Owner occupied155 59.3% Renter occupiedHouse owners and renters - Other race residents 11 25.7% Owner occupied32 74.3% Renter occupiedHouse owners and renters - Two or more races residents 120 76.8% Owner occupied36 23.2% Renter occupiedHouse owners and renters - White alone residents 2,214 67.0% Owner occupied1,090 33.0% Renter occupiedHouse owners and renters - Hispanic or Latino residents 59 73.3% Owner occupied22 26.7% Renter occupied
Language usage in St. Anthony
English speakers - Total 86.6% of residents of St. Anthony speak English at home.
0.7% of residents speak Spanish at home 46 82.1% Speak English very well10 17.9% Speak English less than very well12.8% of residents speak other language at home 929 86.3% Speak English very well147 13.7% Speak English less than very well
English speakers - Born in the United States 94.6% of residents of St. Anthony speak English at home.
0.3% of residents speak Spanish at home 8 100.0% Speak English very well5.1% of residents speak other language at home 100 83.3% Speak English very well20 16.7% Speak English less than very well
All residents speak only English at home
English speakers - Foreign-born 19.4% of residents of St. Anthony speak English at home.
1.5% of residents speak Spanish at home 18 100.0% Speak English very well80.1% of residents speak other language at home 813 86.0% Speak English very well132 14.0% Speak English less than very well
White (Caucasian) - Speak only English Native:
99.3% (6,428)Foreign-born:
68.0% (70)
White (Caucasian) - Speak another language Native:
1.1% (68)Foreign-born:
40.5% (42)
Black or African American - Speak only English Native:
94.4% (153)Foreign-born:
7.8% (41)
Asian - Speak only English Native:
41.8% (27)Foreign-born:
21.2% (99)
Asian - Speak another language Native:
57.9% (38)Foreign-born:
78.9% (370)
Other race - Speak only English Native:
94.4% (53)Foreign-born:
47.5% (6)
Other race - Speak another language Native:
16.1% (9)Foreign-born:
50.4% (6)
Two or more races - Speak only English Native:
91.2% (372)Foreign-born:
29.2% (21)
Two or more races - Speak another language Native:
9.3% (38)Foreign-born:
71.8% (51)
White alone - Speak only English Native:
99.0% (6,438)Foreign-born:
67.0% (73)
White alone - Speak another language Native:
1.1% (74)Foreign-born:
37.0% (41)
Hispanic or Latino - Speak only English Native:
61.3% (64)Foreign-born:
53.1% (17)
Hispanic or Latino - Speak another language Native:
39.9% (42)Foreign-born:
59.1% (19)
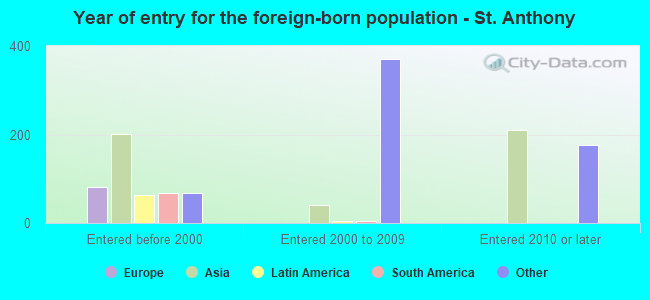
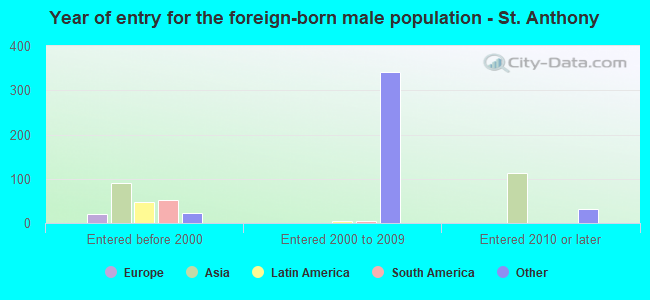
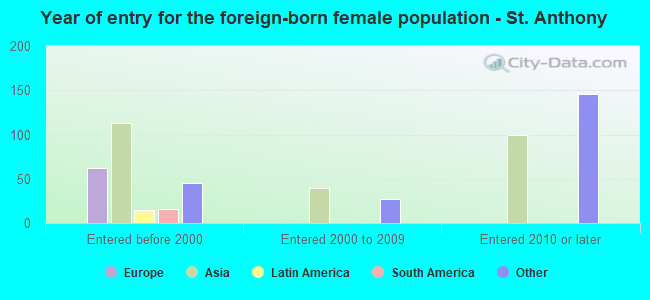
Foreign-born residents in St. Anthony 1,257 residents are foreign born (6.0% Africa , 5.0% Asia ).
This city:
13.6%Minnesota:
8.5%
Marital status for residents in St. Anthony Marital status - White (Caucasian) population 15 years and over
Males 26.5% Never married58.4% Now married0.4% Separated4.6% Widowed10.2% DivorcedFemales 26.6% Never married47.9% Now married0.8% Separated11.0% Widowed13.7% DivorcedWomen who gave birth in the past 12 months Now married:
100.0% (137)Unmarried:
0.0% (0)
Women who did not give birth in the past 12 months Now married:
50.0% (601)Unmarried:
50.0% (602)
Marital status - Black or African American population 15 years and over
Males 53.9% Never married17.8% Now married6.5% Separated0.0% Widowed21.8% DivorcedFemales 68.8% Never married19.6% Now married0.0% Separated5.5% Widowed6.0% DivorcedWomen who did not give birth in the past 12 months Now married:
14.7% (20)Unmarried:
85.3% (114)
Marital status - Asian population 15 years and over
Males 12.2% Never married66.8% Now married7.0% Separated0.0% Widowed14.0% DivorcedFemales 4.8% Never married73.6% Now married0.0% Separated2.4% Widowed19.2% DivorcedWomen who gave birth in the past 12 months Now married:
0.0% (0)Unmarried:
100.0% (12)
Women who did not give birth in the past 12 months Now married:
76.6% (157)Unmarried:
23.4% (48)
Marital status - Other race population 15 years and over
Males 34.9% Never married0.0% Now married0.0% Separated65.1% Widowed0.0% DivorcedFemales 0.0% Never married40.0% Now married0.0% Separated0.0% Widowed60.0% DivorcedMarital status - Two or more races population 15 years and over
Males 33.5% Never married53.9% Now married0.0% Separated6.3% Widowed6.3% DivorcedFemales 0.0% Never married72.4% Now married0.0% Separated0.0% Widowed27.6% DivorcedWomen who did not give birth in the past 12 months Now married:
67.9% (26)Unmarried:
32.1% (12)
Marital status - White alone, not Hispanic / Latino population 15 years and over
Males 26.3% Never married58.6% Now married0.4% Separated4.6% Widowed10.2% DivorcedFemales 26.5% Never married47.8% Now married0.8% Separated11.1% Widowed13.8% DivorcedWomen who gave birth in the past 12 months Now married:
100.0% (140)Unmarried:
0.0% (0)
Women who did not give birth in the past 12 months Now married:
50.3% (612)Unmarried:
49.7% (605)
Marital status - Hispanic or Latino population 15 years and over
Males 32.2% Never married38.9% Now married0.0% Separated14.4% Widowed14.4% DivorcedFemales 19.5% Never married36.6% Now married0.0% Separated0.0% Widowed43.9% DivorcedWomen who did not give birth in the past 12 months Now married:
0.0% (0)Unmarried:
100.0% (18)
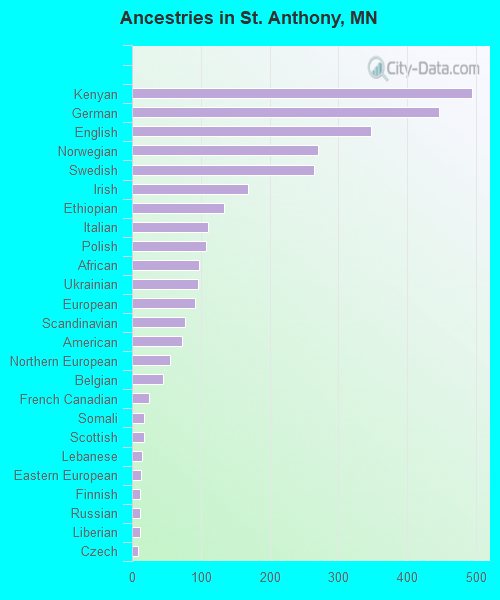
Ancestries in St. Anthony
494 13.3% Kenyan446 12.0% German347 9.4% English270 7.3% Norwegian265 7.1% Swedish168 4.5% Irish133 3.6% Ethiopian111 3.0% Italian107 2.9% Polish97 2.6% African96 2.6% Ukrainian91 2.5% European77 2.1% Scandinavian73 2.0% American55 1.5% Northern European45 1.2% Belgian25 0.7% French Canadian18 0.5% Somali17 0.5% Scottish14 0.4% Lebanese13 0.4% Eastern European12 0.3% Finnish12 0.3% Russian11 0.3% Liberian9 0.2% Czech8 0.2% Dutch6 0.2% Austrian4 0.1% Scotch-Irish3 0.08% British2 0.05% French
Children Nativity (place of birth) in St. Anthony
Children under 6 years - Living with two parents Both parents native 618 100.0% NativeBoth parents foreign-born 75 81.7% Native17 18.3% Foreign-bornOne native, one foreign-born parent 13 100.0% NativeChildren under 6 years - Living with one parent Native parent 48 100.0% NativeForeign-born parent 92 100.0% NativeChildren 6 to 17 years - Living with two parents Both parents native 1,072 99.2% Native9 0.8% Foreign-bornBoth parents foreign-born 44 59.9% Native30 40.1% Foreign-bornOne native, one foreign-born parent 52 100.0% NativeChildren 6 to 17 years - Living with one parent Native parent 75 100.0% NativeForeign-born parent 15 52.3% Native14 47.7% Foreign-born