Races in St. Charles, Illinois (IL) Detailed Stats
Data:
Races - White alone (%)
Races - White alone (% change since 2000)
Races - Black alone (%)
Races - Black alone (% change since 2000)
Races - American Indian alone (%)
Races - American Indian alone (% change since 2000)
Races - Asian alone (%)
Races - Asian alone (% change since 2000)
Races - Hispanic (%)
Races - Hispanic (% change since 2000)
Races - Native Hawaiian and Other Pacific Islander alone (%)
Races - Native Hawaiian and Other Pacific Islander alone (% change since 2000)
Races - Two or more races(%)
Races - Two or more races(% change since 2000)
Races - Other race alone (%)
Races - Other race alone (% change since 2000)
Racial diversity
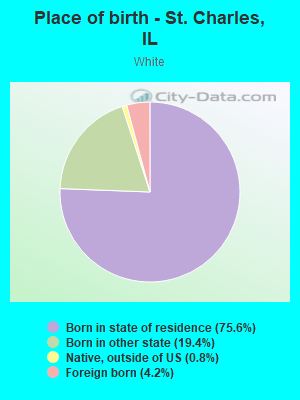
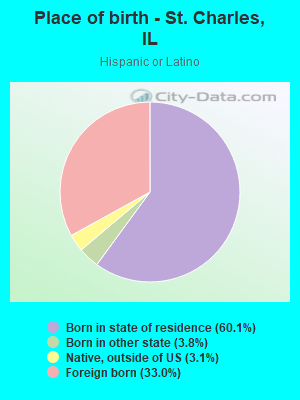
Place of birth - Born in state of residence (%)
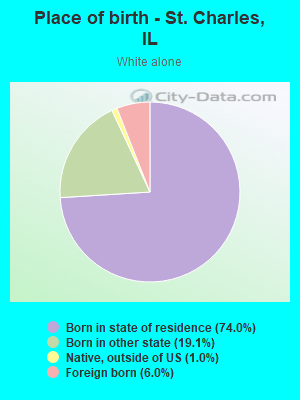
Place of birth - Born in state of residence (%) - White
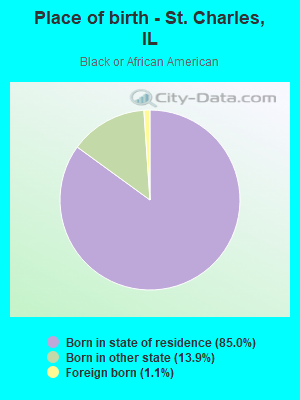
Place of birth - Born in state of residence (%) - Black or African American
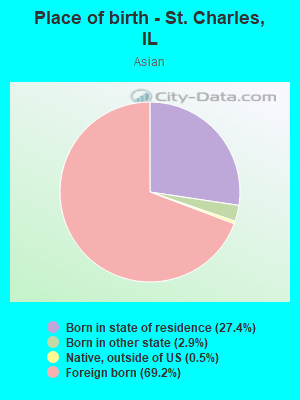
Place of birth - Born in state of residence (%) - Asian
Place of birth - Born in state of residence (%) - Hispanic or Latino
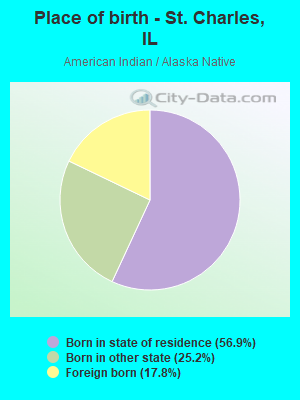
Place of birth - Born in state of residence (%) - American Indian and Alaska Native
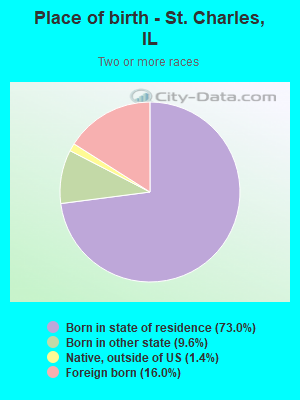
Place of birth - Born in state of residence (%) - Multirace
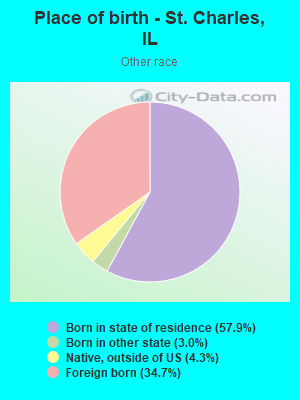
Place of birth - Born in state of residence (%) - Other Race
Place of birth - Born in other state (%)
Place of birth - Born in other state (%) - White
Place of birth - Born in other state (%) - Black or African American
Place of birth - Born in other state (%) - Asian
Place of birth - Born in other state (%) - Hispanic or Latino
Place of birth - Born in other state (%) - American Indian and Alaska Native
Place of birth - Born in other state (%) - Multirace
Place of birth - Born in other state (%) - Other Race
Place of birth - Native, outside of US (%)
Place of birth - Native, outside of US (%) - White
Place of birth - Native, outside of US (%) - Black or African American
Place of birth - Native, outside of US (%) - Asian
Place of birth - Native, outside of US (%) - Hispanic or Latino
Place of birth - Native, outside of US (%) - American Indian and Alaska Native
Place of birth - Native, outside of US (%) - Multirace
Place of birth - Native, outside of US (%) - Other Race
Place of birth - Foreign born (%)
Place of birth - Foreign born (%) - White
Place of birth - Foreign born (%) - Black or African American
Place of birth - Foreign born (%) - Asian
Place of birth - Foreign born (%) - Hispanic or Latino
Place of birth - Foreign born (%) - American Indian and Alaska Native
Place of birth - Foreign born (%) - Multirace
Place of birth - Foreign born (%) - Other Race
Residents speaking English at home (%)
Residents speaking English at home - Born in the United States (%)
Residents speaking English at home - Native, born elsewhere (%)
Residents speaking English at home - Foreign born (%)
Residents speaking Spanish at home (%)
Residents speaking Spanish at home - Born in the United States (%)
Residents speaking Spanish at home - Native, born elsewhere (%)
Residents speaking Spanish at home - Foreign born (%)
Residents speaking other language at home (%)
Residents speaking other language at home - Born in the United States (%)
Residents speaking other language at home - Native, born elsewhere (%)
Residents speaking other language at home - Foreign born (%)
Marital status - Never married (%)
Marital status - Now married (%)
Marital status - Separated (%)
Marital status - Widowed (%)
Marital status - Divorced (%)
Ancestries Reported - Arab (%)
Ancestries Reported - Czech (%)
Ancestries Reported - Danish (%)
Ancestries Reported - Dutch (%)
Ancestries Reported - English (%)
Ancestries Reported - French (%)
Ancestries Reported - French Canadian (%)
Ancestries Reported - German (%)
Ancestries Reported - Greek (%)
Ancestries Reported - Hungarian (%)
Ancestries Reported - Irish (%)
Ancestries Reported - Italian (%)
Ancestries Reported - Lithuanian (%)
Ancestries Reported - Norwegian (%)
Ancestries Reported - Polish (%)
Ancestries Reported - Portuguese (%)
Ancestries Reported - Russian (%)
Ancestries Reported - Scotch-Irish (%)
Ancestries Reported - Scottish (%)
Ancestries Reported - Slovak (%)
Ancestries Reported - Subsaharan African (%)
Ancestries Reported - Swedish (%)
Ancestries Reported - Swiss (%)
Ancestries Reported - Ukrainian (%)
Ancestries Reported - United States (%)
Ancestries Reported - Welsh (%)
Ancestries Reported - West Indian (%)
Ancestries Reported - Other (%)
Geographical mobility - Same house 1 year ago (%)
Geographical mobility - Same house 1 year ago (%) - White
Geographical mobility - Same house 1 year ago (%) - Black or African American
Geographical mobility - Same house 1 year ago (%) - Asian
Geographical mobility - Same house 1 year ago (%) - Hispanic or Latino
Geographical mobility - Same house 1 year ago (%) - American Indian and Alaska Native
Geographical mobility - Same house 1 year ago (%) - Multirace
Geographical mobility - Same house 1 year ago (%) - Other Race
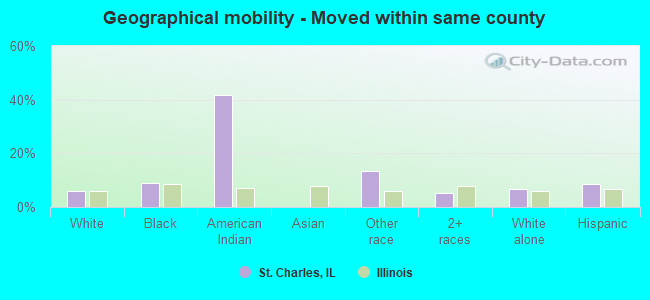
Geographical mobility - Moved within same county (%)
Geographical mobility - Moved within same county (%) - White
Geographical mobility - Moved within same county (%) - Black or African American
Geographical mobility - Moved within same county (%) - Asian
Geographical mobility - Moved within same county (%) - Hispanic or Latino
Geographical mobility - Moved within same county (%) - American Indian and Alaska Native
Geographical mobility - Moved within same county (%) - Multirace
Geographical mobility - Moved within same county (%) - Other Race
Geographical mobility - Moved from different county within same state (%)
Geographical mobility - Moved from different county within same state (%) - White
Geographical mobility - Moved from different county within same state (%) - Black or African American
Geographical mobility - Moved from different county within same state (%) - Asian
Geographical mobility - Moved from different county within same state (%) - Hispanic or Latino
Geographical mobility - Moved from different county within same state (%) - American Indian and Alaska Native
Geographical mobility - Moved from different county within same state (%) - Multirace
Geographical mobility - Moved from different county within same state (%) - Other Race
Geographical mobility - Moved from different state (%)
Geographical mobility - Moved from different state (%) - White
Geographical mobility - Moved from different state (%) - Black or African American
Geographical mobility - Moved from different state (%) - Asian
Geographical mobility - Moved from different state (%) - Hispanic or Latino
Geographical mobility - Moved from different state (%) - American Indian and Alaska Native
Geographical mobility - Moved from different state (%) - Multirace
Geographical mobility - Moved from different state (%) - Other Race
Geographical mobility - Moved from abroad (%)
Geographical mobility - Moved from abroad (%) - White
Geographical mobility - Moved from abroad (%) - Black or African American
Geographical mobility - Moved from abroad (%) - Asian
Geographical mobility - Moved from abroad (%) - Hispanic or Latino
Geographical mobility - Moved from abroad (%) - American Indian and Alaska Native
Geographical mobility - Moved from abroad (%) - Multirace
Geographical mobility - Moved from abroad (%) - Other Race
Place of birth for the foreign-born population - Ireland (%)
Place of birth for the foreign-born population - Denmark (%)
Place of birth for the foreign-born population - Norway (%)
Place of birth for the foreign-born population - Sweden (%)
Place of birth for the foreign-born population - United Kingdom (%)
Place of birth for the foreign-born population - England (%)
Place of birth for the foreign-born population - Scotland (%)
Place of birth for the foreign-born population - Other Northern Europe (%)
Place of birth for the foreign-born population - Austria (%)
Place of birth for the foreign-born population - Belgium (%)
Place of birth for the foreign-born population - France (%)
Place of birth for the foreign-born population - Germany (%)
Place of birth for the foreign-born population - Netherlands (%)
Place of birth for the foreign-born population - Switzerland (%)
Place of birth for the foreign-born population - Other Western Europe (%)
Place of birth for the foreign-born population - Greece (%)
Place of birth for the foreign-born population - Italy (%)
Place of birth for the foreign-born population - Portugal (%)
Place of birth for the foreign-born population - Spain (%)
Place of birth for the foreign-born population - Other Southern Europe (%)
Place of birth for the foreign-born population - Albania (%)
Place of birth for the foreign-born population - Belarus (%)
Place of birth for the foreign-born population - Bosnia and Herzegovina (%)
Place of birth for the foreign-born population - Bulgaria (%)
Place of birth for the foreign-born population - Croatia (%)
Place of birth for the foreign-born population - Czechoslovakia (%)
Place of birth for the foreign-born population - Hungary (%)
Place of birth for the foreign-born population - Latvia (%)
Place of birth for the foreign-born population - Lithuania (%)
Place of birth for the foreign-born population - North Macedonia (Macedonia) (%)
Place of birth for the foreign-born population - Moldova (%)
Place of birth for the foreign-born population - Poland (%)
Place of birth for the foreign-born population - Romania (%)
Place of birth for the foreign-born population - Russia (%)
Place of birth for the foreign-born population - Serbia (%)
Place of birth for the foreign-born population - Ukraine (%)
Place of birth for the foreign-born population - Other Eastern Europe (%)
Place of birth for the foreign-born population - China (%)
Place of birth for the foreign-born population - Hong Kong (%)
Place of birth for the foreign-born population - Taiwan (%)
Place of birth for the foreign-born population - Japan (%)
Place of birth for the foreign-born population - Korea (%)
Place of birth for the foreign-born population - Other Eastern Asia (%)
Place of birth for the foreign-born population - Afghanistan (%)
Place of birth for the foreign-born population - Bangladesh (%)
Place of birth for the foreign-born population - India (%)
Place of birth for the foreign-born population - Iran (%)
Place of birth for the foreign-born population - Kazakhstan (%)
Place of birth for the foreign-born population - Nepal (%)
Place of birth for the foreign-born population - Pakistan (%)
Place of birth for the foreign-born population - Sri Lanka (%)
Place of birth for the foreign-born population - Uzbekistan (%)
Place of birth for the foreign-born population - Other South Central Asia (%)
Place of birth for the foreign-born population - Burma (%)
Place of birth for the foreign-born population - Cambodia (%)
Place of birth for the foreign-born population - Indonesia (%)
Place of birth for the foreign-born population - Laos (%)
Place of birth for the foreign-born population - Malaysia (%)
Place of birth for the foreign-born population - Philippines (%)
Place of birth for the foreign-born population - Singapore (%)
Place of birth for the foreign-born population - Thailand (%)
Place of birth for the foreign-born population - Vietnam (%)
Place of birth for the foreign-born population - Other South Eastern Asia (%)
Place of birth for the foreign-born population - Armenia (%)
Place of birth for the foreign-born population - Iraq (%)
Place of birth for the foreign-born population - Israel (%)
Place of birth for the foreign-born population - Jordan (%)
Place of birth for the foreign-born population - Kuwait (%)
Place of birth for the foreign-born population - Lebanon (%)
Place of birth for the foreign-born population - Saudi Arabia (%)
Place of birth for the foreign-born population - Syria (%)
Place of birth for the foreign-born population - Turkey (%)
Place of birth for the foreign-born population - Yemen (%)
Place of birth for the foreign-born population - Other Western Asia (%)
Place of birth for the foreign-born population - Eritrea (%)
Place of birth for the foreign-born population - Ethiopia (%)
Place of birth for the foreign-born population - Kenya (%)
Place of birth for the foreign-born population - Somalia (%)
Place of birth for the foreign-born population - Uganda (%)
Place of birth for the foreign-born population - Zimbabwe (%)
Place of birth for the foreign-born population - Other Eastern Africa (%)
Place of birth for the foreign-born population - Cameroon (%)
Place of birth for the foreign-born population - Congo (%)
Place of birth for the foreign-born population - Democratic Republic of Congo (Zaire) (%)
Place of birth for the foreign-born population - Other Middle Africa (%)
Place of birth for the foreign-born population - Egypt (%)
Place of birth for the foreign-born population - Morocco (%)
Place of birth for the foreign-born population - Sudan (%)
Place of birth for the foreign-born population - Other Northern Africa (%)
Place of birth for the foreign-born population - South Africa (%)
Place of birth for the foreign-born population - Other Southern Africa (%)
Place of birth for the foreign-born population - Cabo Verde (%)
Place of birth for the foreign-born population - Ghana (%)
Place of birth for the foreign-born population - Liberia (%)
Place of birth for the foreign-born population - Nigeria (%)
Place of birth for the foreign-born population - Senegal (%)
Place of birth for the foreign-born population - Sierra Leone (%)
Place of birth for the foreign-born population - Other Western Africa (%)
Place of birth for the foreign-born population - Australia (%)
Place of birth for the foreign-born population - New Zealand (%)
Place of birth for the foreign-born population - Fiji (%)
Place of birth for the foreign-born population - Micronesia (%)
Place of birth for the foreign-born population - Bahamas (%)
Place of birth for the foreign-born population - Barbados (%)
Place of birth for the foreign-born population - Cuba (%)
Place of birth for the foreign-born population - Dominica (%)
Place of birth for the foreign-born population - Dominican Republic (%)
Place of birth for the foreign-born population - Grenada (%)
Place of birth for the foreign-born population - Haiti (%)
Place of birth for the foreign-born population - Jamaica (%)
Place of birth for the foreign-born population - St. Vincent and the Grenadines (%)
Place of birth for the foreign-born population - Trinidad and Tobago (%)
Place of birth for the foreign-born population - West Indies (%)
Place of birth for the foreign-born population - Other Caribbean (%)
Place of birth for the foreign-born population - Belize (%)
Place of birth for the foreign-born population - Costa Rica (%)
Place of birth for the foreign-born population - El Salvador (%)
Place of birth for the foreign-born population - Guatemala (%)
Place of birth for the foreign-born population - Honduras (%)
Place of birth for the foreign-born population - Mexico (%)
Place of birth for the foreign-born population - Nicaragua (%)
Place of birth for the foreign-born population - Panama (%)
Place of birth for the foreign-born population - Other Central America (%)
Place of birth for the foreign-born population - Argentina (%)
Place of birth for the foreign-born population - Bolivia (%)
Place of birth for the foreign-born population - Brazil (%)
Place of birth for the foreign-born population - Chile (%)
Place of birth for the foreign-born population - Colombia (%)
Place of birth for the foreign-born population - Ecuador (%)
Place of birth for the foreign-born population - Guyana (%)
Place of birth for the foreign-born population - Peru (%)
Place of birth for the foreign-born population - Uruguay (%)
Place of birth for the foreign-born population - Venezuela (%)
Place of birth for the foreign-born population - Other South America (%)
Place of birth for the foreign-born population - Canada (%)
Place of birth for the foreign-born population - Other Northern America (%)
Place of birth for the foreign-born population - Other (%)
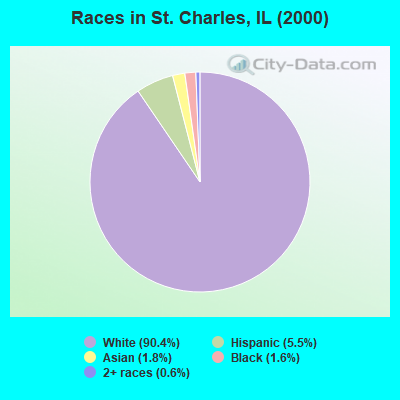
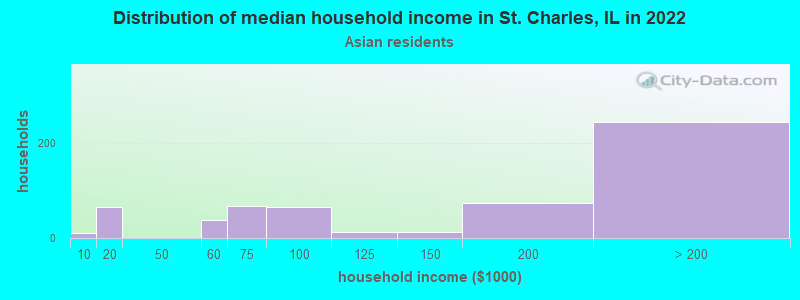
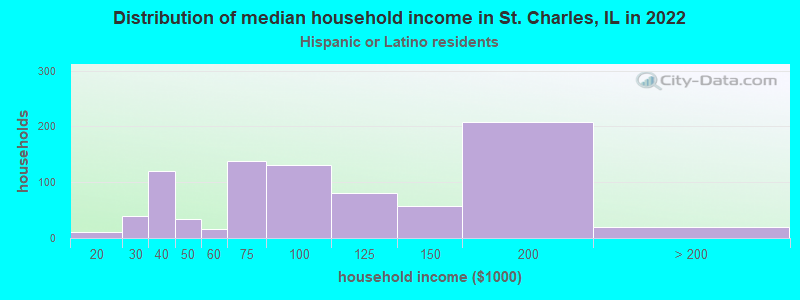
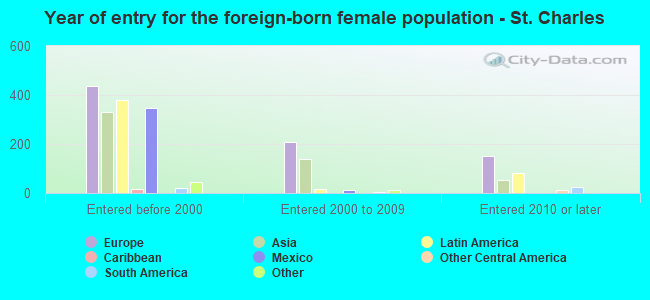
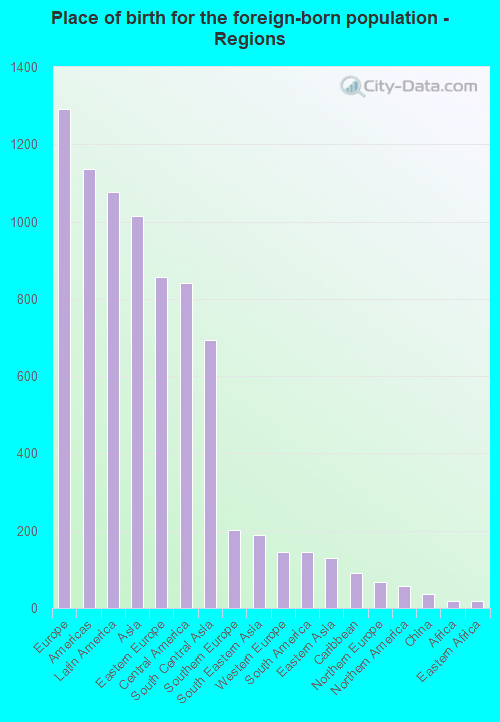
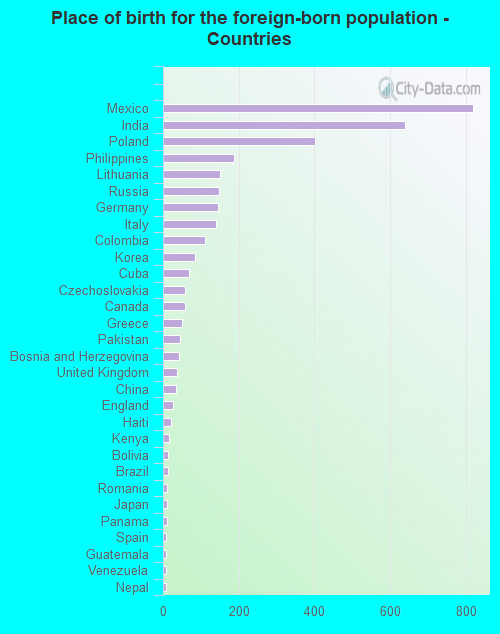
According to 2022 data, the most numerous races in St. Charles, IL are White alone (25,024 residents), Hispanic (3,184 residents), and Black alone (1,003 residents). 83.5% of St. Charles residents speak English at home. 10.6% of St. Charles, IL residents are foreign-born (3.9% born in Europe, 3.3% born in Latin America, 3.1% born in Asia), which is 31.9% less than the foreign-born rate of 14.0% across the entire state of Illinois.
Race distribution in St. Charles
2000 2022
8,424,140 67.8% White alone 1,856,152 14.9% Black alone 1,530,262 12.3% Hispanic 419,916 3.4% Asian alone 153,996 1.2% Two or more races 13,479 0.1% Other race alone 18,232 0.1% American Indian alone 3,116 0.03% Native Hawaiian and Other
7,356,301 58.5% White alone 2,299,726 18.3% Hispanic 1,660,423 13.2% Black alone 747,296 5.9% Asian alone 458,599 3.6% Two or more races 45,386 0.4% Other race alone 10,405 0.08% American Indian alone 3,896 0.03% Native Hawaiian and Other
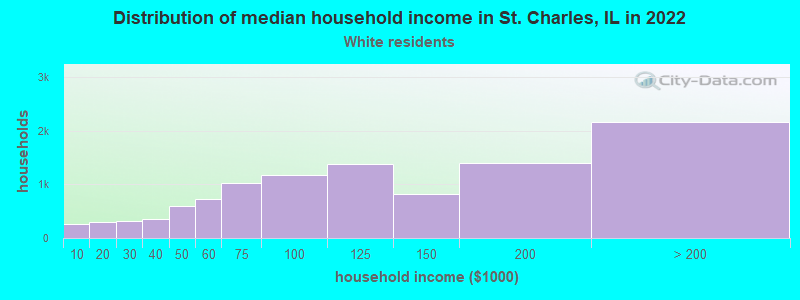
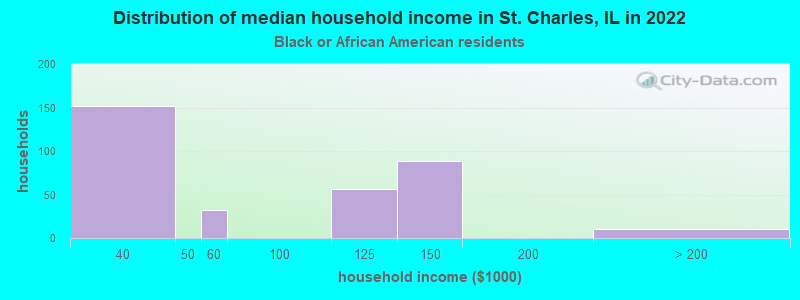
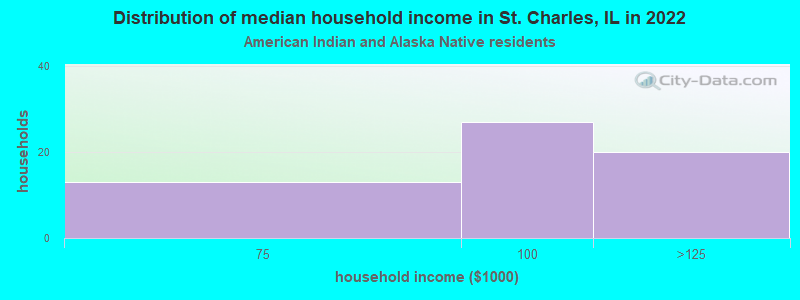
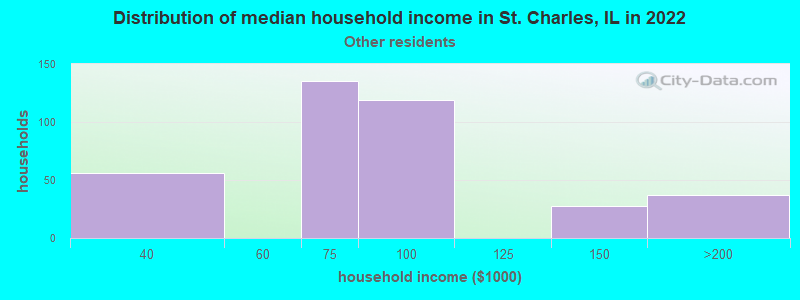
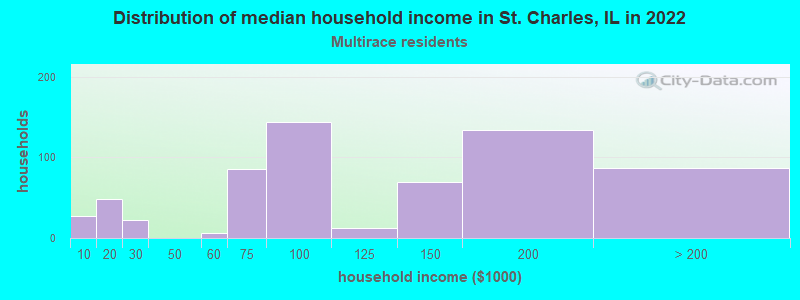
Income and house value in St. Charles Median household income in 2022 $107,575 White non-Hispanic householders$65,092 American Indian and Alaska Native householders$173,243 Asian householders$79,018 Some other race householders$88,299 Two or more races householders$84,712 Hispanic or Latino race householdersMedian 2022 house value $378,257 White Non-Hispanic householders$399,592 Black or African American householders$147,805 American Indian or Alaska Native householders $502,998 Asian householders$269,470 Some other race householders$448,412 Two or more races householders$296,571 Hispanic or Latino householders
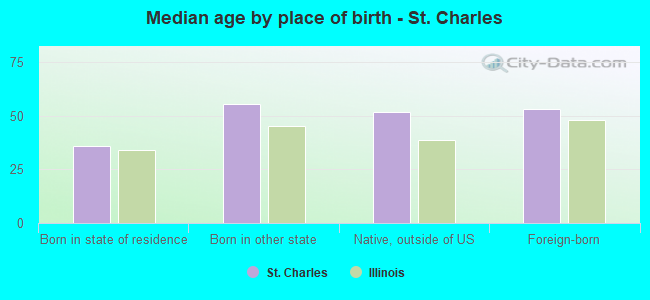
Median age by race in St. Charles
46.7 Median age for White residents44.5 48.7 31.5 Median age for Black or African American residents48.4 32.0 40.6 Median age for American Indian / Alaska Native residents15.0 63.7 50.3 Median age for Asian residents48.4 49.6 -593,236,714.4 Median age for Native Hawaiian / Pacific Islander residents-658,536,584.7 -576,015,108.0 34.5 Median age for Other race residents37.4 21.5 27.6 Median age for Two or more races residents25.7 34.8 45.2 Median age for White alone residents44.3 46.6 27.9 Median age for Hispanic or Latino residents28.0 26.7
Owner/renter occupied households by race in St. Charles
House owners and renters - White residents 7,666 73.3% Owner occupied2,790 26.7% Renter occupiedHouse owners and renters - Black or African American residents 233 62.9% Owner occupied138 37.1% Renter occupiedHouse owners and renters - American Indian / Alaska Native residents 50 100.0% Renter occupiedHouse owners and renters - Asian residents 491 79.9% Owner occupied123 20.1% Renter occupiedHouse owners and renters - Other race residents 123 34.1% Owner occupied236 65.9% Renter occupiedHouse owners and renters - Two or more races residents 427 65.3% Owner occupied227 34.7% Renter occupiedHouse owners and renters - White alone residents 8,076 73.4% Owner occupied2,933 26.6% Renter occupiedHouse owners and renters - Hispanic or Latino residents 307 36.5% Owner occupied535 63.5% Renter occupied
Language usage in St. Charles
English speakers - Total 83.5% of residents of St. Charles speak English at home.
7.5% of residents speak Spanish at home 1,652 71.0% Speak English very well675 29.0% Speak English less than very well9.4% of residents speak other language at home 2,188 75.4% Speak English very well715 24.6% Speak English less than very well
English speakers - Born in the United States 96.2% of residents of St. Charles speak English at home.
3.3% of residents speak Spanish at home 175 100.0% Speak English very well0.9% of residents speak other language at home 35 70.0% Speak English very well15 30.0% Speak English less than very well
English speakers - Native, born elsewhere 45.4% of residents of St. Charles speak English at home.
30.4% of residents speak Spanish at home 99 100.0% Speak English very well24.5% of residents speak other language at home 72 90.0% Speak English very well8 10.0% Speak English less than very well
English speakers - Foreign-born 18.4% of residents of St. Charles speak English at home.
27.7% of residents speak Spanish at home 393 39.7% Speak English very well597 60.3% Speak English less than very well57.5% of residents speak other language at home 1,428 69.6% Speak English very well623 30.4% Speak English less than very well
White (Caucasian) - Speak only English Native:
99.5% (21,515)Foreign-born:
29.7% (291)
White (Caucasian) - Speak another language Native:
2.7% (579)Foreign-born:
72.7% (713)
American Indian / Alaska Native - Speak another language Native:
36.4% (41)Foreign-born:
100.0% (26)
Asian - Speak only English Native:
47.7% (226)Foreign-born:
23.1% (251)
Asian - Speak another language Native:
53.8% (255)Foreign-born:
76.9% (837)
Other race - Speak another language Native:
64.9% (405)Foreign-born:
97.5% (377)
Two or more races - Speak only English Native:
82.4% (1,843)Foreign-born:
5.1% (24)
Two or more races - Speak another language Native:
19.3% (431)Foreign-born:
94.8% (446)
White alone - Speak only English Native:
96.6% (21,623)Foreign-born:
21.3% (319)
White alone - Speak another language Native:
3.3% (736)Foreign-born:
79.2% (1,186)
Hispanic or Latino - Speak only English Native:
47.8% (924)Foreign-born:
5.0% (53)
Hispanic or Latino - Speak another language Native:
52.4% (1,013)Foreign-born:
94.8% (1,005)
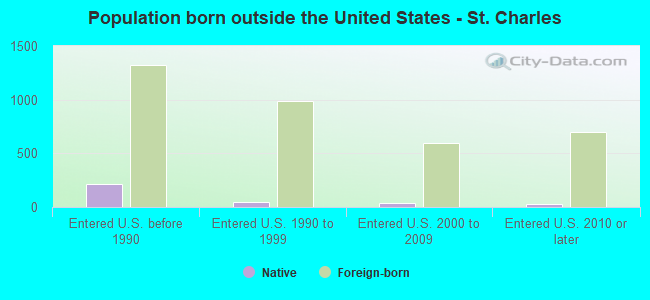
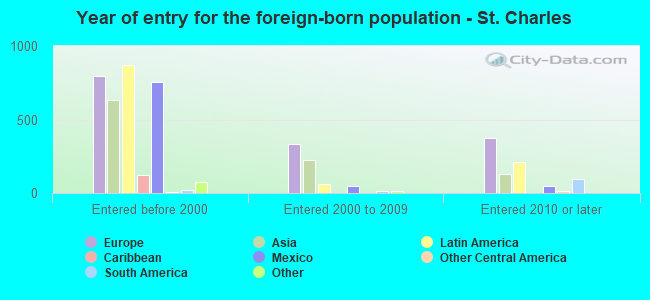
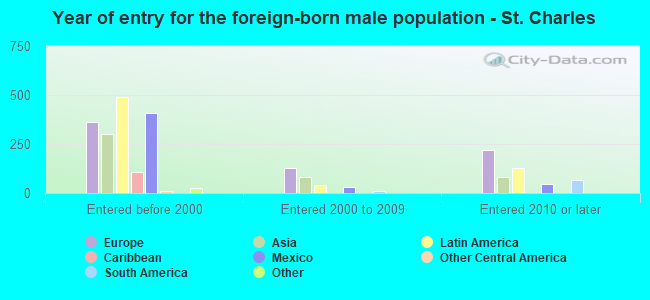
Foreign-born residents in St. Charles 3,458 residents are foreign born (3.9% Europe , 3.3% Latin America , 3.1% Asia ).
This city:
10.6%Illinois:
14.1%
Marital status for residents in St. Charles Marital status - White (Caucasian) population 15 years and over
Males 31.7% Never married57.0% Now married0.3% Separated3.3% Widowed7.7% DivorcedFemales 25.6% Never married55.4% Now married0.8% Separated7.5% Widowed10.8% DivorcedWomen who gave birth in the past 12 months Now married:
78.8% (152)Unmarried:
21.2% (41)
Women who did not give birth in the past 12 months Now married:
45.4% (2,096)Unmarried:
54.6% (2,524)
Marital status - Black or African American population 15 years and over
Males 46.0% Never married54.0% Now married0.0% Separated0.0% Widowed0.0% DivorcedFemales 45.8% Never married36.9% Now married0.0% Separated0.0% Widowed17.4% DivorcedWomen who gave birth in the past 12 months Now married:
0.0% (0)Unmarried:
100.0% (74)
Women who did not give birth in the past 12 months Now married:
42.7% (81)Unmarried:
57.3% (109)
Marital status - American Indian / Alaska Native population 15 years and over
Males 74.4% Never married0.0% Now married0.0% Separated0.0% Widowed25.6% DivorcedFemales 26.4% Never married43.4% Now married0.0% Separated0.0% Widowed30.2% DivorcedWomen who did not give birth in the past 12 months Now married:
25.0% (17)Unmarried:
75.0% (50)
Marital status - Asian population 15 years and over
Males 25.2% Never married69.8% Now married0.0% Separated4.9% Widowed0.0% DivorcedFemales 4.9% Never married80.2% Now married0.0% Separated14.9% Widowed0.0% DivorcedWomen who did not give birth in the past 12 months Now married:
85.5% (227)Unmarried:
14.5% (38)
Marital status - Other race population 15 years and over
Males 38.3% Never married45.3% Now married0.0% Separated16.4% Widowed0.0% DivorcedFemales 62.7% Never married37.3% Now married0.0% Separated0.0% Widowed0.0% DivorcedWomen who gave birth in the past 12 months Now married:
100.0% (3)Unmarried:
0.0% (0)
Women who did not give birth in the past 12 months Now married:
32.4% (140)Unmarried:
67.6% (293)
Marital status - Two or more races population 15 years and over
Males 48.7% Never married43.4% Now married0.0% Separated0.0% Widowed7.9% DivorcedFemales 29.9% Never married44.4% Now married5.0% Separated3.1% Widowed17.5% DivorcedWomen who did not give birth in the past 12 months Now married:
38.0% (187)Unmarried:
62.0% (305)
Marital status - White alone, not Hispanic / Latino population 15 years and over
Males 28.9% Never married59.3% Now married0.4% Separated3.5% Widowed7.9% DivorcedFemales 25.1% Never married55.7% Now married0.8% Separated7.6% Widowed10.8% DivorcedWomen who gave birth in the past 12 months Now married:
80.7% (167)Unmarried:
19.3% (40)
Women who did not give birth in the past 12 months Now married:
44.9% (2,257)Unmarried:
55.1% (2,776)
Marital status - Hispanic or Latino population 15 years and over
Males 57.1% Never married34.1% Now married0.0% Separated4.0% Widowed4.8% DivorcedFemales 48.8% Never married37.9% Now married0.6% Separated3.2% Widowed9.5% DivorcedWomen who gave birth in the past 12 months Now married:
57.9% (11)Unmarried:
42.1% (8)
Women who did not give birth in the past 12 months Now married:
38.2% (327)Unmarried:
61.8% (529)
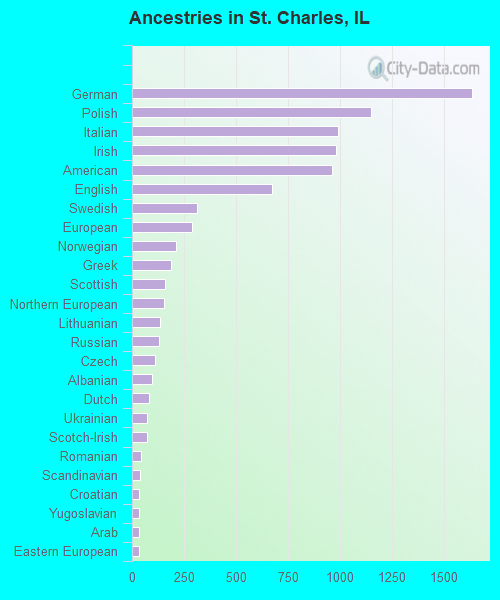
Ancestries in St. Charles
1,637 12.1% German1,150 8.5% Polish992 7.3% Italian984 7.3% Irish962 7.1% American672 5.0% English315 2.3% Swedish291 2.2% European211 1.6% Norwegian190 1.4% Greek160 1.2% Scottish154 1.1% Northern European136 1.0% Lithuanian129 1.0% Russian109 0.8% Czech96 0.7% Albanian84 0.6% Dutch73 0.5% Ukrainian72 0.5% Scotch-Irish41 0.3% Romanian40 0.3% Scandinavian36 0.3% Croatian36 0.3% Yugoslavian35 0.3% Arab32 0.2% Eastern European27 0.2% Slovak26 0.2% Danish22 0.2% Hungarian21 0.2% Canadian16 0.1% Lebanese15 0.1% Macedonian13 0.10% Austrian13 0.10% French13 0.10% Portuguese12 0.09% Slovene11 0.08% French Canadian8 0.06% Pennsylvania German5 0.04% Swiss4 0.03% Belgian3 0.02% British
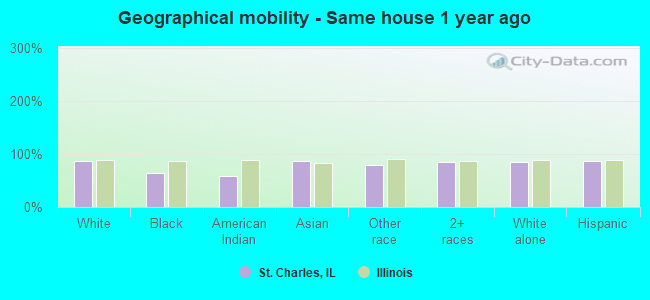
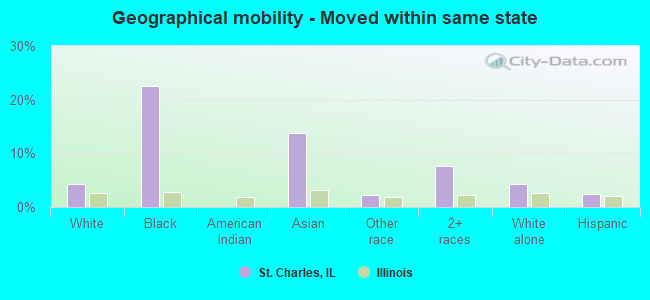
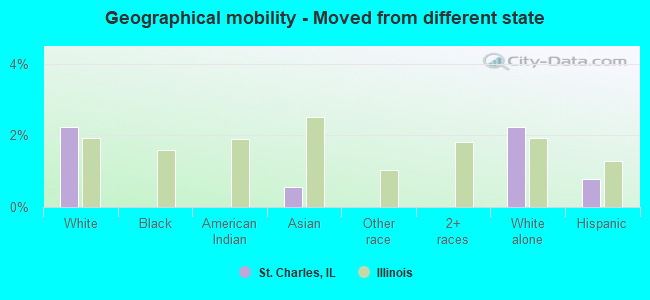
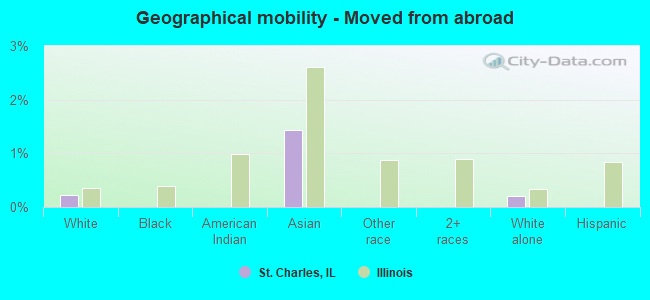
Geographical mobility in St. Charles Same house 1 year ago 20,089 86.3% White (Caucasian)597 64.7% Black or African American99 59.1% American Indian / Alaska Native1,373 87.5% Asian893 79.2% Other race2,477 84.8% Two or more races21,313 85.7% White alone, not Hispanic / Latino2,768 87.4% Hispanic or LatinoMoved within same county 1,383 5.9% White / Caucasian81 8.8% Black or African American70 41.6% American Indian / Alaska Native150 13.3% Other race153 5.2% Two or more races1,655 6.7% White alone, not Hispanic / Latino269 8.5% Hispanic or LatinoMoved within same state 985 4.2% White / Caucasian207 22.5% Black or African American217 13.8% Asian25 2.2% Other race223 7.6% Two or more races1,049 4.2% White alone, not Hispanic / Latino79 2.5% Hispanic or LatinoMoved from different state 519 2.2% White / Caucasian9 0.6% Asian554 2.2% White alone, not Hispanic / Latino25 0.8% Hispanic or LatinoMoved from abroad 50 0.2% White22 1.4% Asian49 0.2% White alone, not Hispanic / Latino
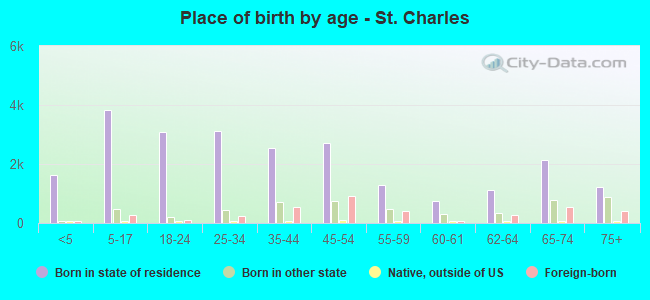
Children Nativity (place of birth) in St. Charles
Children under 6 years - Living with two parents Both parents native 1,359 100.0% NativeBoth parents foreign-born 32 100.0% NativeOne native, one foreign-born parent 122 100.0% NativeChildren under 6 years - Living with one parent Native parent 342 100.0% NativeForeign-born parent 22 100.0% NativeChildren 6 to 17 years - Living with two parents Both parents native 2,062 99.1% Native18 0.9% Foreign-bornBoth parents foreign-born 342 60.0% Native228 40.0% Foreign-bornOne native, one foreign-born parent 453 100.0% NativeChildren 6 to 17 years - Living with one parent Native parent 862 100.0% NativeForeign-born parent 57 51.0% Native55 49.0% Foreign-born
Grandparents responsible for own grandchildren in St. Charles
Grandparents (30 to 59 years) White / Caucasian 44 100.0% Responsible for grandchildrenTwo or more races 21 100.0% Not responsible for grandchildrenWhite alone, not Hispanic / Latino 62 100.0% Responsible for grandchildrenHispanic or Latino 8 100.0% Not responsible for grandchildrenGrandparents (60 years and over) White / Caucasian 53 55.5% Responsible for grandchildren43 44.5% Not responsible for grandchildrenTwo or more races 25 100.0% Not responsible for grandchildrenWhite alone, not Hispanic / Latino 57 52.2% Responsible for grandchildren53 47.8% Not responsible for grandchildrenHispanic or Latino 10 100.0% Not responsible for grandchildren